Mga Batayang Estadistika
| Nilai Portofolio | $ 13,221,538,661 |
| Posisi Saat Ini | 41 |
Kepemilikan Terbaru, Kinerja, AUM (dari 13F, 13D)
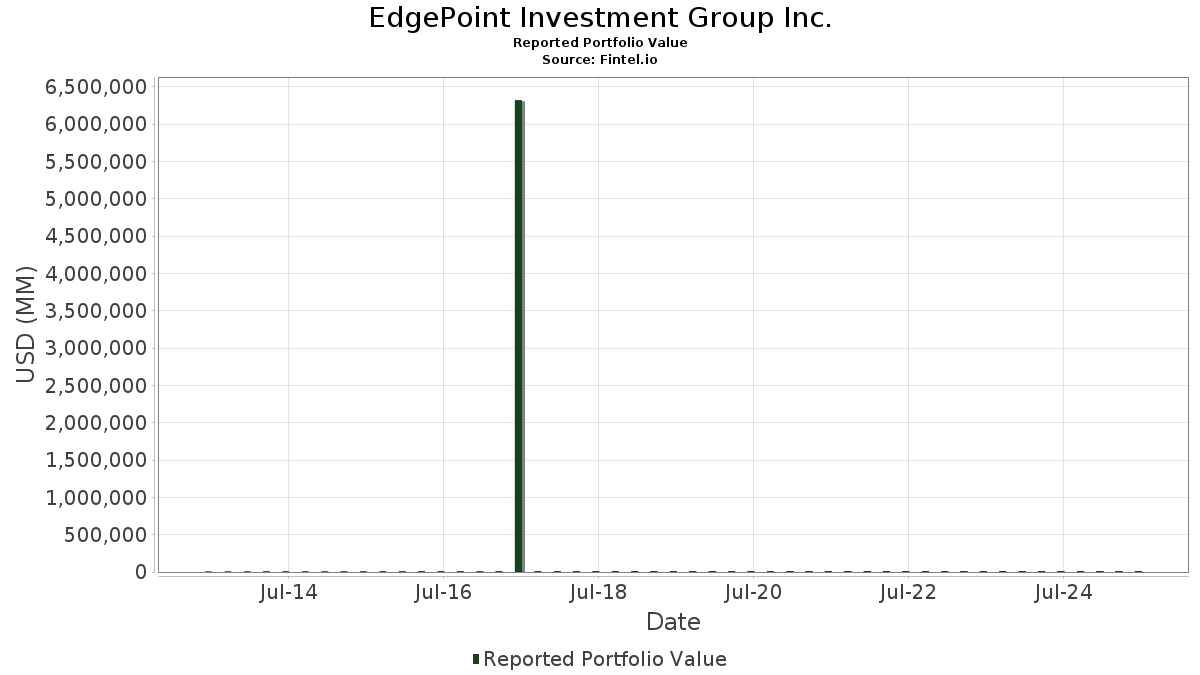
EdgePoint Investment Group Inc. telah mengungkapkan total kepemilikan 41 dalam pengajuan SEC terbaru mereka. Nilai portofolio terbaru dihitung sebesar $ 13,221,538,661 USD. Aset yang Dikelola (AUM) sebenarnya adalah nilai ini ditambah kas (yang tidak diungkapkan). Aset-aset utama EdgePoint Investment Group Inc. adalah Dollar Tree, Inc. (US:DLTR) , Norfolk Southern Corporation (US:NSC) , Applied Materials, Inc. (US:AMAT) , Dayforce Inc. (US:DAY) , and Restaurant Brands International Inc. (US:QSR) . Posisi baru EdgePoint Investment Group Inc. meliputi: OR Royalties Inc. (US:OR) , Robinhood Markets, Inc. (US:HOOD) , Parker-Hannifin Corporation (US:PH) , Quest Diagnostics Incorporated (US:DGX) , and Nu Holdings Ltd. (US:NU) . Industri unggulan EdgePoint Investment Group Inc. adalah "Business Services" (sic 73) , "Oil And Gas Extraction" (sic 13) , and "Water Transportation" (sic 44) .
Peningkatan Tertinggi Kuartal Ini
Kami menggunakan perubahan dalam alokasi portofolio karena ini adalah metrik yang paling bermakna. Perubahan dapat disebabkan oleh perdagangan atau perubahan harga saham.
| Keamanan | Saham (MM) |
Nilai (Juta Dolar AS) |
Portfolio % | ΔPorsyento ng Portfolio |
|---|---|---|---|---|
| 23.64 | 607.90 | 4.5978 | 4.5978 | |
| 1.32 | 536.45 | 4.0574 | 2.6631 | |
| 10.83 | 1,072.19 | 8.1094 | 2.2469 | |
| 4.99 | 913.79 | 6.9114 | 1.2470 | |
| 2.79 | 178.44 | 1.3497 | 0.8593 | |
| 2.93 | 529.58 | 4.0055 | 0.7242 | |
| 4.24 | 715.31 | 5.4102 | 0.7074 | |
| 56.76 | 324.93 | 2.4576 | 0.7010 | |
| 2.22 | 568.22 | 4.2977 | 0.6123 | |
| 6.43 | 205.33 | 1.5530 | 0.5397 |
Penurunan Tertinggi Kuartal Ini
Kami menggunakan perubahan dalam alokasi portofolio karena ini adalah metrik yang paling bermakna. Perubahan dapat disebabkan oleh perdagangan atau perubahan harga saham.
| Keamanan | Saham (MM) |
Nilai (Juta Dolar AS) |
Portfolio % | ΔPorsyento ng Portfolio |
|---|---|---|---|---|
| 0.00 | 0.00 | -4.1067 | ||
| 0.57 | 35.33 | 0.2672 | -2.0356 | |
| 12.92 | 857.57 | 6.4862 | -0.9208 | |
| 6.88 | 731.90 | 5.5356 | -0.6432 | |
| 4.47 | 165.30 | 1.2502 | -0.4352 | |
| 5.64 | 123.98 | 0.9377 | -0.4252 | |
| 3.56 | 584.60 | 4.4216 | -0.2901 | |
| 1.90 | 393.30 | 2.9747 | -0.1778 | |
| 2.28 | 109.89 | 0.8312 | -0.1681 | |
| 0.05 | 3.99 | 0.0302 | -0.0039 |
Pengajuan 13D/G
Ini adalah daftar pengajuan 13D dan 13G yang dibuat dalam setahun terakhir (jika ada). Klik ikon tautan untuk melihat riwayat transaksi lengkap. Baris berwarna hijau menunjukkan posisi baru. Baris berwarna merah menunjukkan posisi yang sudah ditutup.
| Tanggal File | Formulir | Keamanan | Sebelumnya Saham |
Saat ini Saham |
ΔPersentase Saham | % Kepemilikan |
% ΔKepemilikan | |
|---|---|---|---|---|---|---|---|---|
| 2025-08-14 | ATS / ATS Corporation | 5,017,996 | 6,434,005 | 28.22 | 6.59 | 28.71 | ||
| 2025-08-14 | MAT / Mattel, Inc. | 36,158,043 | 40,823,584 | 12.90 | 12.64 | 15.43 | ||
| 2025-08-14 | DLTR / Dollar Tree, Inc. | 10,825,801 | 5.19 | |||||
| 2025-08-14 | RVTY / Revvity, Inc. | 6,789,660 | 5.76 | |||||
| 2025-08-14 | AQN / Algonquin Power & Utilities Corp. | 42,223,594 | 56,764,441 | 34.44 | 7.39 | 34.36 | ||
| 2025-07-07 | DAY / Dayforce Inc. | 13,860,521 | 16,244,490 | 17.20 | 10.20 | 17.24 | ||
| 2025-04-07 | PRMLF / NexMetals Mining Corp. | 176,765,217 | 34.50 | |||||
| 2025-04-07 | BERY / Berry Global Group, Inc. | 11,623,898 | 3,355,322 | -71.13 | 2.90 | -71.29 | ||
| 2025-02-14 | PSMT / PriceSmart, Inc. | 2,683,418 | 1,457,697 | -45.68 | 4.80 | -46.07 | ||
| 2025-02-14 | OSKGF / Osisko Gold Royalties Ltd. | 24,226,649 | 22,485,775 | -7.19 | 12.00 | -8.40 | ||
| 2024-09-27 | PNRLF / Premium Resources Ltd. | 37,549,531 | 18.80 |
Pengajuan 13F dan Dana
Formulir ini diajukan pada 2025-08-14 untuk periode pelaporan 2025-06-30. Klik ikon tautan untuk melihat riwayat transaksi selengkapnya.
Tingkatkan ke versi premium untuk membuka data premium dan ekspor ke Excel. ![]() .
.
| Keamanan | Ketik | Harga Saham Rata-rata | Saham (MM) |
ΔSaham (%) |
ΔSaham (%) |
Nilai ($MM) |
Portpolyo (%) |
ΔPortofolio (%) |
|
|---|---|---|---|---|---|---|---|---|---|
| DLTR / Dollar Tree, Inc. | 10.83 | 12.28 | 1,072.19 | 48.14 | 8.1094 | 2.2469 | |||
| NSC / Norfolk Southern Corporation | 4.18 | 4.62 | 1,070.70 | 13.06 | 8.0982 | 0.4276 | |||
| AMAT / Applied Materials, Inc. | 4.99 | 3.58 | 913.79 | 30.67 | 6.9114 | 1.2470 | |||
| DAY / Dayforce Inc. | 16.24 | 17.20 | 899.78 | 11.29 | 6.8054 | 0.2569 | |||
| QSR / Restaurant Brands International Inc. | 12.92 | -5.80 | 857.57 | -6.22 | 6.4862 | -0.9208 | |||
| MAT / Mattel, Inc. | 40.82 | 12.90 | 805.04 | 14.59 | 6.0889 | 0.3984 | |||
| RBA / RB Global, Inc. | 6.88 | -9.40 | 731.90 | -4.06 | 5.5356 | -0.6432 | |||
| TEL / TE Connectivity plc | 4.24 | 3.22 | 715.31 | 23.20 | 5.4102 | 0.7074 | |||
| RVTY / Revvity, Inc. | 6.79 | 26.65 | 656.70 | 15.78 | 4.9669 | 0.3729 | |||
| OR / OR Royalties Inc. | 23.64 | 607.90 | 4.5978 | 4.5978 | |||||
| FNV / Franco-Nevada Corporation | 3.56 | -3.77 | 584.60 | 0.50 | 4.4216 | -0.2901 | |||
| JLL / Jones Lang LaSalle Incorporated | 2.22 | 21.04 | 568.22 | 24.88 | 4.2977 | 0.6123 | |||
| ROST / Ross Stores, Inc. | 4.41 | 8.87 | 563.26 | 8.69 | 4.2601 | 0.0628 | |||
| TMO / Thermo Fisher Scientific Inc. | 1.32 | 282.46 | 536.45 | 211.64 | 4.0574 | 2.6631 | |||
| AME / AMETEK, Inc. | 2.93 | 24.36 | 529.58 | 30.73 | 4.0055 | 0.7242 | |||
| LECO / Lincoln Electric Holdings, Inc. | 1.90 | -7.80 | 393.30 | 1.05 | 2.9747 | -0.1778 | |||
| AQN / Algonquin Power & Utilities Corp. | 56.76 | 34.44 | 324.93 | 49.83 | 2.4576 | 0.7010 | |||
| WBD / Warner Bros. Discovery, Inc. | 22.42 | 1.51 | 256.91 | 8.41 | 1.9431 | 0.0237 | |||
| ATS / ATS Corporation | 6.43 | 28.22 | 205.33 | 64.13 | 1.5530 | 0.5397 | |||
| RMBS / Rambus Inc. | 2.79 | 138.40 | 178.44 | 194.78 | 1.3497 | 0.8593 | |||
| LKQ / LKQ Corporation | 4.47 | -8.69 | 165.30 | -20.56 | 1.2502 | -0.4352 | |||
| GNTX / Gentex Corporation | 5.64 | -21.93 | 123.98 | -26.32 | 0.9377 | -0.4252 | |||
| CCOI / Cogent Communications Holdings, Inc. | 2.28 | 13.28 | 109.89 | -10.93 | 0.8312 | -0.1681 | |||
| TWST / Twist Bioscience Corporation | 2.39 | 114.33 | 87.78 | 100.85 | 0.6639 | 0.3099 | |||
| GIL / Gildan Activewear Inc. | 1.48 | -0.98 | 73.00 | 10.42 | 0.5521 | 0.0166 | |||
| HBM / Hudbay Minerals Inc. | 6.79 | -10.99 | 72.11 | 24.65 | 0.5454 | 0.0768 | |||
| TCX / Tucows Inc. | 2.12 | 0.59 | 41.88 | 17.34 | 0.3167 | 0.0277 | |||
| BN / Brookfield Corporation | 0.57 | -89.50 | 35.33 | -87.57 | 0.2672 | -2.0356 | |||
| EchoStar Corporation / NOTE 3.875%11/3 (278768AB2) | 19.71 | 0.0000 | |||||||
| BAM / Brookfield Asset Management Ltd. | 0.16 | 0.00 | 8.82 | 14.40 | 0.0667 | 0.0043 | |||
| XPL / Solitario Resources Corp. | 7.27 | 0.00 | 4.73 | 8.34 | 0.0358 | 0.0004 | |||
| IFF / International Flavors & Fragrances Inc. | 0.05 | 0.00 | 3.99 | -5.22 | 0.0302 | -0.0039 | |||
| SEE / Sealed Air Corporation | 0.02 | 23.51 | 0.75 | 32.57 | 0.0057 | 0.0011 | |||
| NESRW / National Energy Services Reunited Corp. - Equity Warrant | 1.00 | 0.00 | 0.55 | 57.71 | 0.0042 | 0.0013 | |||
| HOOD / Robinhood Markets, Inc. | 0.00 | 0.41 | 0.0031 | 0.0031 | |||||
| LYFT / Lyft, Inc. | 0.02 | 49.82 | 0.34 | 99.40 | 0.0025 | 0.0012 | |||
| PCG / PG&E Corporation | 0.02 | 57.66 | 0.31 | 27.80 | 0.0023 | 0.0004 | |||
| PH / Parker-Hannifin Corporation | 0.00 | 0.28 | 0.0021 | 0.0021 | |||||
| DGX / Quest Diagnostics Incorporated | 0.00 | 0.23 | 0.0017 | 0.0017 | |||||
| NU / Nu Holdings Ltd. | 0.01 | 0.19 | 0.0014 | 0.0014 | |||||
| LZM / Lifezone Metals Limited | 0.02 | 0.07 | 0.0005 | 0.0005 | |||||
| ELV / Elevance Health, Inc. | 0.00 | -100.00 | 0.00 | 0.0000 | |||||
| OSKGF / Osisko Gold Royalties Ltd. | 0.00 | -100.00 | 0.00 | -100.00 | -4.1067 | ||||
| BERY / Berry Global Group, Inc. | 0.00 | -100.00 | 0.00 | 0.0000 | |||||
| IE / Ivanhoe Electric Inc. | 0.00 | -100.00 | 0.00 | 0.0000 | |||||
| GOLD / Barrick Mining Corporation | 0.00 | -100.00 | 0.00 | 0.0000 | |||||
| BLND / Blend Labs, Inc. | 0.00 | -100.00 | 0.00 | 0.0000 |