Mga Batayang Estadistika
| Nilai Portofolio | $ 61,856,000 |
| Posisi Saat Ini | 64 |
Kepemilikan Terbaru, Kinerja, AUM (dari 13F, 13D)
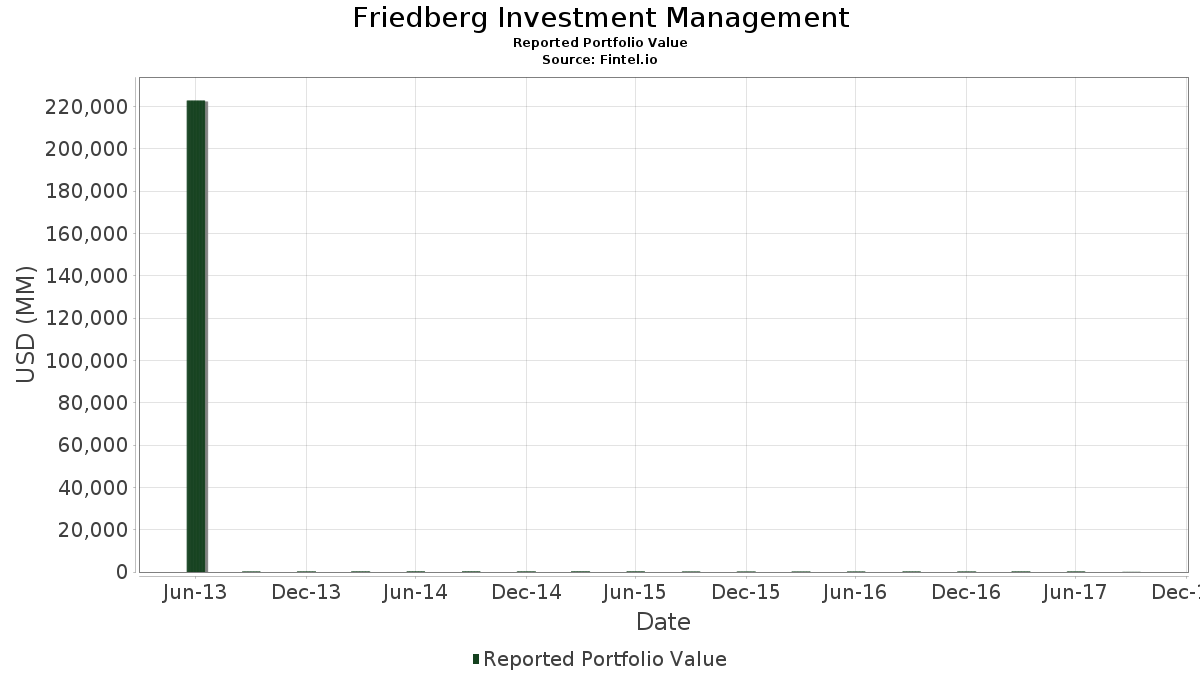
Friedberg Investment Management telah mengungkapkan total kepemilikan 64 dalam pengajuan SEC terbaru mereka. Nilai portofolio terbaru dihitung sebesar $ 61,856,000 USD. Aset yang Dikelola (AUM) sebenarnya adalah nilai ini ditambah kas (yang tidak diungkapkan). Aset-aset utama Friedberg Investment Management adalah Cencora, Inc. (US:COR) , American Tower Corporation (US:AMT) , National Instruments Corp. (US:NATI) , Waste Connections, Inc. (US:WCN) , and NextEra Energy, Inc. (US:NEE) . Posisi baru Friedberg Investment Management meliputi: Pool Corporation (US:POOL) , .
Peningkatan Tertinggi Kuartal Ini
Kami menggunakan perubahan dalam alokasi portofolio karena ini adalah metrik yang paling bermakna. Perubahan dapat disebabkan oleh perdagangan atau perubahan harga saham.
| Keamanan | Saham (MM) |
Nilai (Juta Dolar AS) |
Portfolio % | ΔPorsyento ng Portfolio |
|---|---|---|---|---|
| 0.01 | 1.98 | 3.2074 | 3.2074 | |
| 0.03 | 1.77 | 2.8647 | 2.8647 | |
| 0.03 | 1.75 | 2.8227 | 2.8227 | |
| 0.04 | 1.25 | 2.0127 | 2.0127 | |
| 0.01 | 1.20 | 1.9351 | 1.9351 | |
| 0.03 | 1.06 | 1.7137 | 1.7137 | |
| 0.02 | 2.44 | 3.9511 | 1.6986 | |
| 0.03 | 0.95 | 1.5326 | 1.5326 | |
| 0.02 | 0.88 | 1.4178 | 1.4178 | |
| 0.03 | 3.77 | 6.0932 | 1.2035 |
Penurunan Tertinggi Kuartal Ini
Kami menggunakan perubahan dalam alokasi portofolio karena ini adalah metrik yang paling bermakna. Perubahan dapat disebabkan oleh perdagangan atau perubahan harga saham.
| Keamanan | Saham (MM) |
Nilai (Juta Dolar AS) |
Portfolio % | ΔPorsyento ng Portfolio |
|---|---|---|---|---|
| 0.00 | 0.00 | -1.4988 | ||
| 0.02 | 0.93 | 1.5051 | -1.1793 | |
| 0.01 | 1.47 | 2.3797 | -0.9795 | |
| 0.00 | 0.00 | -0.7344 | ||
| 0.00 | 0.00 | -0.7130 | ||
| 0.00 | 0.29 | 0.4721 | -0.7054 | |
| 0.01 | 1.02 | 1.6506 | -0.6109 | |
| 0.00 | 0.25 | 0.4090 | -0.4201 | |
| 0.01 | 0.59 | 0.9490 | -0.4097 | |
| 0.00 | 0.51 | 0.8213 | -0.2945 |
Pengajuan 13F dan Dana
Formulir ini diajukan pada 2017-11-08 untuk periode pelaporan 2017-09-30. Klik ikon tautan untuk melihat riwayat transaksi selengkapnya.
Tingkatkan ke versi premium untuk membuka data premium dan ekspor ke Excel. ![]() .
.
| Keamanan | Ketik | Harga Saham Rata-rata | Saham (MM) |
ΔSaham (%) |
ΔSaham (%) |
Nilai ($MM) |
Portpolyo (%) |
ΔPortofolio (%) |
|
|---|---|---|---|---|---|---|---|---|---|
| COR / Cencora, Inc. | 0.03 | -69.45 | 3.77 | -66.97 | 6.0932 | 1.2035 | |||
| AMT / American Tower Corporation | 0.02 | -67.73 | 2.83 | -66.66 | 4.5768 | 0.9386 | |||
| NATI / National Instruments Corp. | 0.06 | -68.37 | 2.51 | -66.84 | 4.0562 | 0.8144 | |||
| WCN / Waste Connections, Inc. | 0.04 | -69.66 | 2.48 | -67.04 | 4.0093 | 0.7851 | |||
| NEE / NextEra Energy, Inc. | 0.02 | -55.55 | 2.44 | -53.51 | 3.9511 | 1.6986 | |||
| MMP / Magellan Midstream Partners L.P. | 0.03 | -72.26 | 2.26 | -72.34 | 3.6488 | 0.1525 | |||
| CTAS / Cintas Corporation | 0.01 | -67.42 | 1.98 | -62.71 | 3.2074 | 3.2074 | |||
| EPAM / EPAM Systems, Inc. | 0.02 | -67.79 | 1.93 | -66.32 | 3.1185 | 0.6643 | |||
| MIDD / The Middleby Corporation | 0.01 | -67.27 | 1.89 | -65.48 | 3.0474 | 0.7075 | |||
| ORA / Ormat Technologies, Inc. | 0.03 | -61.41 | 1.77 | -59.86 | 2.8647 | 2.8647 | |||
| CONE / CyrusOne Inc | 0.03 | -67.98 | 1.75 | -66.16 | 2.8227 | 2.8227 | |||
| ZTS / Zoetis Inc. | 0.03 | -69.68 | 1.60 | -69.01 | 2.5915 | 0.3755 | |||
| GOOGL / Alphabet Inc. | 0.00 | -60.86 | 1.59 | -59.01 | 2.5656 | 0.9066 | |||
| WAB / Westinghouse Air Brake Technologies Corporation | 0.02 | -69.61 | 1.52 | -74.83 | 2.4525 | -0.1299 | |||
| ANSS / ANSYS, Inc. | 0.01 | -81.39 | 1.47 | -81.22 | 2.3797 | -0.9795 | |||
| IDXX / IDEXX Laboratories, Inc. | 0.01 | -66.16 | 1.43 | -67.40 | 2.3054 | 0.4312 | |||
| EPD / Enterprise Products Partners L.P. - Limited Partnership | 0.05 | -69.23 | 1.36 | -70.38 | 2.1954 | 0.2309 | |||
| COST / Costco Wholesale Corporation | 0.01 | -61.59 | 1.26 | -60.56 | 2.0418 | 0.6699 | |||
| REXR / Rexford Industrial Realty, Inc. | 0.04 | -63.89 | 1.25 | -62.33 | 2.0127 | 2.0127 | |||
| POOL / Pool Corporation | 0.01 | 1.20 | 1.9351 | 1.9351 | |||||
| PAA / Plains All American Pipeline, L.P. - Limited Partnership | 0.05 | -66.86 | 1.10 | -73.28 | 1.7864 | 0.0147 | |||
| NEP / XPLR Infrastructure, LP - Limited Partnership | 0.03 | -73.03 | 1.06 | -70.64 | 1.7137 | 1.7137 | |||
| XPO / XPO, Inc. | 0.02 | -67.67 | 1.05 | -66.10 | 1.6959 | 0.3702 | |||
| ALGN / Align Technology, Inc. | 0.01 | -84.41 | 1.02 | -80.66 | 1.6506 | -0.6109 | |||
| STAG / STAG Industrial, Inc. | 0.03 | -82.45 | 0.95 | -82.53 | 1.5326 | 1.5326 | |||
| AGR / Avangrid, Inc. | 0.02 | -78.86 | 0.94 | -77.30 | 1.5213 | -0.2547 | |||
| MAIN / Main Street Capital Corporation | 0.02 | -85.63 | 0.93 | -85.14 | 1.5051 | -1.1793 | |||
| MCRI / Monarch Casino & Resort, Inc. | 0.02 | -76.86 | 0.88 | -69.77 | 1.4178 | 1.4178 | |||
| EPR / EPR Properties | 0.01 | -75.41 | 0.87 | -76.13 | 1.4065 | -0.1548 | |||
| DLR / Digital Realty Trust, Inc. | 0.01 | -69.70 | 0.79 | -68.24 | 1.2804 | 0.2118 | |||
| ARE / Alexandria Real Estate Equities, Inc. | 0.01 | -77.89 | 0.75 | -78.18 | 1.2190 | -0.2618 | |||
| US26885B1008 / EQT Midstream Partners LP | 0.01 | -63.52 | 0.66 | -63.33 | 1.0670 | 0.2957 | |||
| MTDR / Matador Resources Company | 0.02 | -79.75 | 0.65 | -74.28 | 1.0444 | -0.0320 | |||
| SBAC / SBA Communications Corporation | 0.00 | -77.06 | 0.61 | -75.49 | 0.9829 | -0.0801 | |||
| AWK / American Water Works Company, Inc. | 0.01 | -82.18 | 0.59 | -81.49 | 0.9490 | -0.4097 | |||
| HIW / Highwoods Properties, Inc. | 0.01 | -72.06 | 0.58 | -71.29 | 0.9312 | 0.9312 | |||
| CMS / CMS Energy Corporation | 0.01 | -66.16 | 0.57 | -66.11 | 0.9183 | 0.2001 | |||
| RYN / Rayonier Inc. | 0.02 | -79.75 | 0.56 | -79.67 | 0.9053 | -0.2751 | |||
| GOOG / Alphabet Inc. | 0.00 | -11.45 | 0.56 | -6.55 | 0.8989 | 0.6439 | |||
| POWI / Power Integrations, Inc. | 0.01 | 0.55 | 0.8811 | 0.8811 | |||||
| HCC / Warrior Met Coal, Inc. | 0.00 | -80.78 | 0.51 | -80.49 | 0.8213 | -0.2945 | |||
| BKH / Black Hills Corporation | 0.01 | -83.92 | 0.50 | -83.60 | 0.8132 | 0.8132 | |||
| ORBC / Orbcomm Inc | 0.05 | -49.76 | 0.49 | -53.48 | 0.7889 | 0.7889 | |||
| CVCO / Cavco Industries, Inc. | 0.00 | -73.57 | 0.46 | -69.95 | 0.7437 | 0.0877 | |||
| TEGP / Tallgrass Energy GP, LP | 0.01 | -73.45 | 0.41 | -70.48 | 0.6628 | 0.6628 | |||
| PAR / PAR Technology Corporation | 0.04 | -60.21 | 0.40 | -51.23 | 0.6386 | 0.6386 | |||
| CCI / Crown Castle Inc. | 0.00 | -75.00 | 0.38 | -75.05 | 0.6159 | 0.6159 | |||
| MSFT / Microsoft Corporation | 0.00 | -66.78 | 0.36 | -64.09 | 0.5852 | 0.1533 | |||
| BLBD / Blue Bird Corporation | 0.02 | -62.01 | 0.35 | -54.01 | 0.5658 | 0.5658 | |||
| EQIX / Equinix, Inc. | 0.00 | -69.08 | 0.34 | -67.82 | 0.5561 | 0.5561 | |||
| ALE / ALLETE, Inc. | 0.00 | -82.66 | 0.34 | -81.31 | 0.5448 | -0.2277 | |||
| VTR / Ventas, Inc. | 0.01 | -57.42 | 0.34 | -60.07 | 0.5416 | 0.1821 | |||
| MA / Mastercard Incorporated | 0.00 | -77.82 | 0.32 | -74.22 | 0.5206 | -0.0146 | |||
| LTC / LTC Properties, Inc. | 0.01 | -82.36 | 0.32 | -83.91 | 0.5157 | 0.5157 | |||
| CELG / Celgene Corp. | 0.00 | -90.55 | 0.29 | -89.37 | 0.4721 | -0.7054 | |||
| SRLP / Sprague Resources LP - Unit | 0.01 | -80.04 | 0.28 | -82.60 | 0.4591 | 0.4591 | |||
| DEA / Easterly Government Properties, Inc. | 0.01 | -72.99 | 0.28 | -73.38 | 0.4575 | 0.4575 | |||
| VRSK / Verisk Analytics, Inc. | 0.00 | -86.75 | 0.25 | -86.93 | 0.4090 | -0.4201 | |||
| EOG / EOG Resources, Inc. | 0.00 | -75.83 | 0.24 | -74.16 | 0.3864 | -0.0100 | |||
| EQC / Equity Commonwealth | 0.01 | -88.78 | 0.23 | -89.19 | 0.3767 | 0.3767 | |||
| WES / Western Midstream Partners, LP - Limited Partnership | 0.00 | -71.39 | 0.22 | -65.84 | 0.3573 | 0.0801 | |||
| IDA / IDACORP, Inc. | 0.00 | -77.95 | 0.21 | -77.29 | 0.3363 | 0.3363 | |||
| TEP / Tallgrass Energy Partners, LP | 0.00 | -87.07 | 0.20 | -87.65 | 0.3249 | 0.3249 | |||
| OKE / ONEOK, Inc. | 0.00 | -74.56 | 0.20 | -73.05 | 0.3233 | 0.0054 | |||
| DGI / DigitalGlobe, Inc. | 0.00 | -100.00 | 0.00 | -100.00 | -0.1140 | ||||
| RSPP / RSP Permian, Inc. | 0.00 | -100.00 | 0.00 | -100.00 | 0.0000 | ||||
| TREC / Trecora Resources | 0.00 | -100.00 | 0.00 | -100.00 | 0.0000 | ||||
| XOM / Exxon Mobil Corporation | 0.00 | -100.00 | 0.00 | -100.00 | -0.1684 | ||||
| CIO / City Office REIT, Inc. | 0.00 | -100.00 | 0.00 | -100.00 | 0.0000 | ||||
| US3024451011 / FLIR Systems, Inc. | 0.00 | -100.00 | 0.00 | -100.00 | -0.1251 | ||||
| GWRE / Guidewire Software, Inc. | 0.00 | -100.00 | 0.00 | -100.00 | 0.0000 | ||||
| LGND / Ligand Pharmaceuticals Incorporated | 0.00 | -100.00 | 0.00 | -100.00 | -0.2194 | ||||
| HF / Tidal Trust II - DGA Core Plus Absolute Return ETF | 0.00 | -100.00 | 0.00 | -100.00 | 0.0000 | ||||
| LKQ / LKQ Corporation | 0.00 | -100.00 | 0.00 | -100.00 | -0.1101 | ||||
| TYL / Tyler Technologies, Inc. | 0.00 | -100.00 | 0.00 | -100.00 | -0.2147 | ||||
| BEP / Brookfield Renewable Partners L.P. - Limited Partnership | 0.00 | -100.00 | 0.00 | -100.00 | -0.1671 | ||||
| SUI / Sun Communities, Inc. | 0.00 | -100.00 | 0.00 | -100.00 | -0.7130 | ||||
| UNIT / Unity Group LLC | 0.00 | -100.00 | 0.00 | -100.00 | -0.7344 | ||||
| ROIC / Retail Opportunity Investments Corp. | 0.00 | -100.00 | 0.00 | -100.00 | -1.4988 | ||||
| PPL / Pembina Pipeline Corporation | 0.00 | -100.00 | 0.00 | -100.00 | -0.2279 | ||||
| HRL / Hormel Foods Corporation | 0.00 | -100.00 | 0.00 | -100.00 | -0.0904 | ||||
| GLPI / Gaming and Leisure Properties, Inc. | 0.00 | -100.00 | 0.00 | -100.00 | 0.0000 | ||||
| LOW / Lowe's Companies, Inc. | 0.00 | -100.00 | 0.00 | -100.00 | -0.0977 | ||||
| PBR / Petróleo Brasileiro S.A. - Petrobras - Depositary Receipt (Common Stock) | 0.00 | -100.00 | 0.00 | -100.00 | 0.0000 | ||||
| AG / First Majestic Silver Corp. | 0.00 | -100.00 | 0.00 | -100.00 | 0.0000 | ||||
| OKS / ONEOK Partners, L.P. | 0.00 | -100.00 | 0.00 | -100.00 | 0.0000 | ||||
| DOC / Healthpeak Properties, Inc. | 0.00 | -100.00 | 0.00 | -100.00 | 0.0000 |