Mga Batayang Estadistika
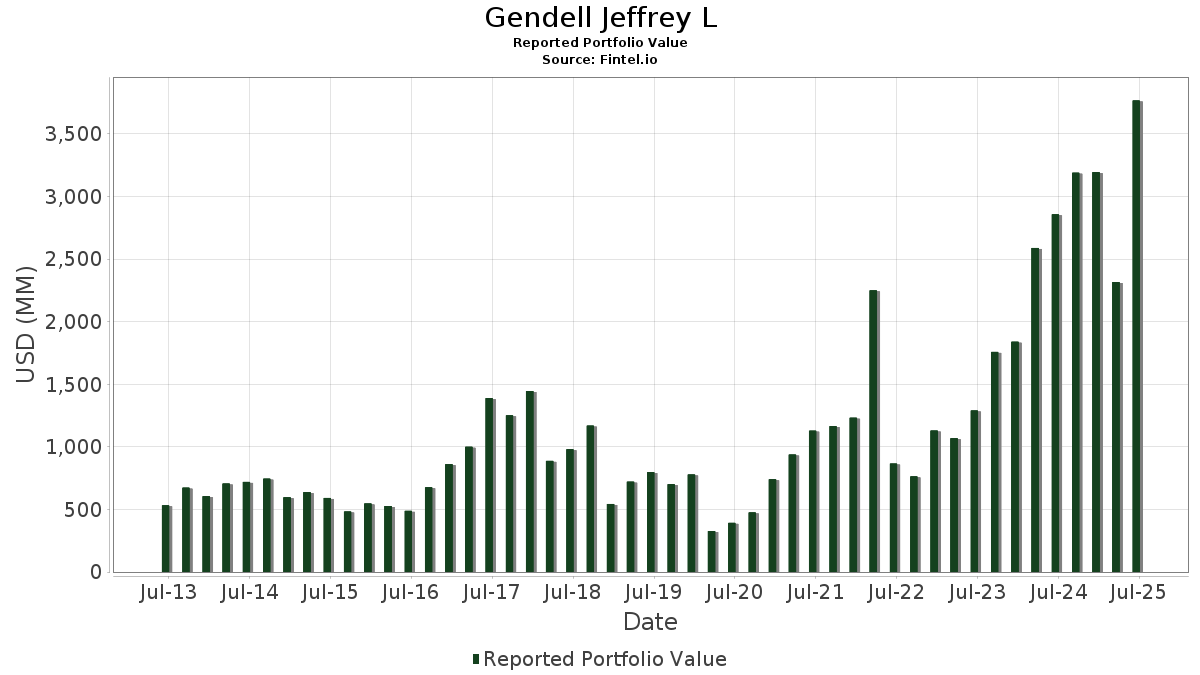
| Nilai Portofolio | $ 3,766,390,852 |
| Posisi Saat Ini | 77 |
Kepemilikan Terbaru, Kinerja, AUM (dari 13F, 13D)
Gendell Jeffrey L telah mengungkapkan total kepemilikan 77 dalam pengajuan SEC terbaru mereka. Nilai portofolio terbaru dihitung sebesar $ 3,766,390,852 USD. Aset yang Dikelola (AUM) sebenarnya adalah nilai ini ditambah kas (yang tidak diungkapkan). Aset-aset utama Gendell Jeffrey L adalah IES Holdings, Inc. (US:IESC) , Avadel Pharmaceuticals plc (US:AVDL) , BlueLinx Holdings Inc. (US:BXC) , iShares Trust - iShares Russell 2000 ETF (US:IWM) , and Alpha Metallurgical Resources, Inc. (US:AMR) . Posisi baru Gendell Jeffrey L meliputi: Apple Inc. (US:AAPL) , Flex Ltd. (US:FLEX) , Innovex International, Inc. (US:INVX) , Tecogen Inc. (US:TGEN) , and . Industri unggulan Gendell Jeffrey L adalah "Automotive Dealers And Gasoline Service Stations" (sic 55) , "Miscellaneous Retail " (sic 59) , and "Insurance Carriers" (sic 63) .
Peningkatan Tertinggi Kuartal Ini
Kami menggunakan perubahan dalam alokasi portofolio karena ini adalah metrik yang paling bermakna. Perubahan dapat disebabkan oleh perdagangan atau perubahan harga saham.
| Keamanan | Saham (MM) |
Nilai (Juta Dolar AS) |
Portfolio % | ΔPorsyento ng Portfolio |
|---|---|---|---|---|
| 10.68 | 3,162.65 | 83.9704 | 7.5675 | |
| 0.15 | 20.45 | 0.5431 | 0.5431 | |
| 0.17 | 36.68 | 0.5404 | 0.5404 | |
| 0.05 | 10.26 | 0.2724 | 0.2724 | |
| 0.17 | 10.67 | 0.1571 | 0.1571 | |
| 0.02 | 7.28 | 0.1073 | 0.1073 | |
| 0.05 | 7.18 | 0.1906 | 0.0993 | |
| 0.07 | 6.46 | 0.0951 | 0.0951 | |
| 0.05 | 2.50 | 0.0663 | 0.0663 | |
| 0.15 | 4.22 | 0.0622 | 0.0622 |
Penurunan Tertinggi Kuartal Ini
Kami menggunakan perubahan dalam alokasi portofolio karena ini adalah metrik yang paling bermakna. Perubahan dapat disebabkan oleh perdagangan atau perubahan harga saham.
| Keamanan | Saham (MM) |
Nilai (Juta Dolar AS) |
Portfolio % | ΔPorsyento ng Portfolio |
|---|---|---|---|---|
| 5.18 | 45.81 | 0.6749 | -1.3964 | |
| 0.56 | 41.93 | 0.6177 | -0.9453 | |
| 0.30 | 33.34 | 0.4911 | -0.7334 | |
| 0.35 | 4.64 | 0.0684 | -0.7209 | |
| 0.06 | 4.87 | 0.0717 | -0.6889 | |
| 0.14 | 31.13 | 0.4587 | -0.6766 | |
| 1.40 | 3.63 | 0.0534 | -0.5672 | |
| 0.12 | 12.06 | 0.1776 | -0.5493 | |
| 1.94 | 15.17 | 0.2234 | -0.5456 | |
| 0.29 | 8.26 | 0.1217 | -0.5170 |
Pengajuan 13D/G
Ini adalah daftar pengajuan 13D dan 13G yang dibuat dalam setahun terakhir (jika ada). Klik ikon tautan untuk melihat riwayat transaksi lengkap. Baris berwarna hijau menunjukkan posisi baru. Baris berwarna merah menunjukkan posisi yang sudah ditutup.
| Tanggal File | Formulir | Keamanan | Sebelumnya Saham |
Saat ini Saham |
ΔPersentase Saham | % Kepemilikan |
% ΔKepemilikan | |
|---|---|---|---|---|---|---|---|---|
| 2025-08-14 | FRD / Friedman Industries, Incorporated | 453,129 | 354,576 | -21.75 | 5.00 | -23.08 | ||
| 2025-08-14 | KLXE / KLX Energy Services Holdings, Inc. | 1,526,795 | 1,693,219 | 10.90 | 9.50 | 2.04 | ||
| 2025-02-14 | NINE / Nine Energy Service, Inc. | 3,313,322 | 4,184,044 | 26.28 | 9.90 | 5.54 | ||
| 2024-11-13 | ASRV / AmeriServ Financial, Inc. | 1,246,113 | 1,572,987 | 26.23 | 9.52 | 30.95 | ||
| 2024-11-13 | FUSB / First US Bancshares, Inc. | 291,981 | 361,084 | 23.67 | 6.32 | 24.17 | ||
| 2024-11-13 | IROQ / IF Bancorp, Inc. | 272,040 | 326,382 | 19.98 | 9.73 | 19.98 |
Pengajuan 13F dan Dana
Formulir ini diajukan pada 2025-08-14 untuk periode pelaporan 2025-06-30. Klik ikon tautan untuk melihat riwayat transaksi selengkapnya.
Tingkatkan ke versi premium untuk membuka data premium dan ekspor ke Excel. ![]() .
.
| Keamanan | Ketik | Harga Saham Rata-rata | Saham (MM) |
ΔSaham (%) |
ΔSaham (%) |
Nilai ($MM) |
Portpolyo (%) |
ΔPortofolio (%) |
|
|---|---|---|---|---|---|---|---|---|---|
| IESC / IES Holdings, Inc. | 10.68 | -0.39 | 3,162.65 | 78.72 | 83.9704 | 7.5675 | |||
| AVDL / Avadel Pharmaceuticals plc | 5.18 | -15.51 | 45.81 | -4.51 | 0.6749 | -1.3964 | |||
| BXC / BlueLinx Holdings Inc. | 0.56 | 16.76 | 41.93 | 15.82 | 0.6177 | -0.9453 | |||
| IWM / iShares Trust - iShares Russell 2000 ETF | 0.17 | 36.68 | 0.5404 | 0.5404 | |||||
| AMR / Alpha Metallurgical Resources, Inc. | 0.30 | 30.89 | 33.34 | 17.54 | 0.4911 | -0.7334 | |||
| OIH / VanEck ETF Trust - VanEck Oil Services ETF | 0.14 | 34.77 | 31.13 | 18.40 | 0.4587 | -0.6766 | |||
| MU / Micron Technology, Inc. | 0.17 | 116.88 | 20.58 | 207.65 | 0.3032 | 0.0144 | |||
| OC / Owens Corning | 0.15 | 20.45 | 0.5431 | 0.5431 | |||||
| SLB / Schlumberger Limited | 0.45 | 13.73 | 15.21 | -8.04 | 0.2241 | -0.4900 | |||
| LXU / LSB Industries, Inc. | 1.94 | -28.06 | 15.17 | -14.86 | 0.2234 | -0.5456 | |||
| INDV / Indivior PLC | 0.86 | 41.22 | 12.62 | 118.45 | 0.1860 | -0.0635 | |||
| TTI / TETRA Technologies, Inc. | 3.64 | -12.97 | 12.24 | -12.98 | 0.1803 | -0.4269 | |||
| MHK / Mohawk Industries, Inc. | 0.12 | -22.01 | 12.06 | -28.39 | 0.1776 | -0.5493 | |||
| SKY / Champion Homes, Inc. | 0.17 | 10.67 | 0.1571 | 0.1571 | |||||
| ATKR / Atkore Inc. | 0.15 | -24.76 | 10.59 | -11.52 | 0.1560 | -0.3607 | |||
| RBCAA / Republic Bancorp, Inc. | 0.14 | -2.59 | 10.45 | 11.60 | 0.1539 | -0.2503 | |||
| AAPL / Apple Inc. | 0.05 | 10.26 | 0.2724 | 0.2724 | |||||
| PATK / Patrick Industries, Inc. | 0.11 | 0.00 | 9.70 | 9.12 | 0.1428 | -0.2408 | |||
| OIS / Oil States International, Inc. | 1.61 | -4.11 | 8.62 | -0.20 | 0.1270 | -0.2458 | |||
| AMBC / Ambac Financial Group, Inc. | 1.20 | 98.98 | 8.51 | 61.44 | 0.1254 | -0.1022 | |||
| MTRX / Matrix Service Company | 0.61 | 2.90 | 8.30 | 11.83 | 0.1223 | -0.1982 | |||
| NBR / Nabors Industries Ltd. | 0.29 | -16.90 | 8.26 | -44.18 | 0.1217 | -0.5170 | |||
| IROQ / IF Bancorp, Inc. | 0.33 | -0.06 | 7.94 | 1.00 | 0.1170 | -0.2225 | |||
| XBI / SPDR Series Trust - SPDR S&P Biotech ETF | 0.09 | 137.55 | 7.65 | 142.92 | 0.1127 | -0.0233 | |||
| CNR / Core Natural Resources, Inc. | 0.11 | 87.71 | 7.50 | 69.81 | 0.1106 | -0.0803 | |||
| SNDK / Sandisk Corporation | 0.16 | 370.97 | 7.48 | 348.68 | 0.1101 | 0.0382 | |||
| CMI / Cummins Inc. | 0.02 | 7.28 | 0.1073 | 0.1073 | |||||
| AMD / Advanced Micro Devices, Inc. | 0.05 | 145.79 | 7.18 | 239.50 | 0.1906 | 0.0993 | |||
| LBRT / Liberty Energy Inc. | 0.59 | 23.47 | 6.76 | -10.47 | 0.0996 | -0.2263 | |||
| IOSP / Innospec Inc. | 0.08 | 3.28 | 6.71 | -8.35 | 0.0988 | -0.2172 | |||
| ODP / The ODP Corporation | 0.37 | -0.24 | 6.62 | 26.22 | 0.0975 | -0.1289 | |||
| CLB / Core Laboratories Inc. | 0.57 | 24.61 | 6.56 | -4.23 | 0.0966 | -0.1991 | |||
| UFPI / UFP Industries, Inc. | 0.07 | 6.46 | 0.0951 | 0.0951 | |||||
| GLW / Corning Incorporated | 0.12 | 500.00 | 6.31 | 589.62 | 0.0930 | 0.0534 | |||
| PEBK / Peoples Bancorp of North Carolina, Inc. | 0.22 | 0.00 | 6.28 | 5.92 | 0.0926 | -0.1635 | |||
| WDC / Western Digital Corporation | 0.10 | 111.11 | 6.08 | 234.19 | 0.0896 | 0.0110 | |||
| FRD / Friedman Industries, Incorporated | 0.35 | -17.80 | 5.87 | -8.59 | 0.0865 | -0.1908 | |||
| FUNC / First United Corporation | 0.18 | 0.00 | 5.53 | 3.29 | 0.0815 | -0.1497 | |||
| FMBH / First Mid Bancshares, Inc. | 0.14 | 0.00 | 5.15 | 7.42 | 0.0759 | -0.1312 | |||
| ALRS / Alerus Financial Corporation | 0.23 | -40.05 | 5.06 | -29.72 | 0.0745 | -0.2362 | |||
| ASRV / AmeriServ Financial, Inc. | 1.64 | 0.00 | 4.97 | 25.11 | 0.0733 | -0.0983 | |||
| FUSB / First US Bancshares, Inc. | 0.38 | 4.22 | 4.87 | 0.62 | 0.0718 | -0.1373 | |||
| MTRN / Materion Corporation | 0.06 | -58.91 | 4.87 | 5.71 | 0.0717 | -0.6889 | |||
| NOV / NOV Inc. | 0.39 | 49.66 | 4.82 | 22.24 | 0.0710 | -0.0993 | |||
| WTTR / Select Water Solutions, Inc. | 0.55 | -34.27 | 4.72 | -45.91 | 0.0695 | -0.3073 | |||
| BTU / Peabody Energy Corporation | 0.35 | -74.35 | 4.64 | -74.60 | 0.0684 | -0.7209 | |||
| COFS / ChoiceOne Financial Services, Inc. | 0.15 | -35.91 | 4.26 | -36.07 | 0.0628 | -0.2251 | |||
| WGO / Winnebago Industries, Inc. | 0.15 | 4.22 | 0.0622 | 0.0622 | |||||
| SND / Smart Sand, Inc. | 2.04 | 18.11 | 4.10 | -8.34 | 0.0604 | -0.1327 | |||
| TSEM / Tower Semiconductor Ltd. | 0.09 | 27.36 | 4.04 | 54.83 | 0.0595 | -0.0531 | |||
| DTI / Drilling Tools International Corporation | 1.41 | 20.87 | 4.03 | 45.35 | 0.0594 | -0.0603 | |||
| FCG / First Trust Exchange-Traded Fund - First Trust Natural Gas ETF | 0.16 | -57.83 | 3.70 | -60.78 | 0.0545 | -0.3526 | |||
| RIG / Transocean Ltd. | 1.40 | -69.13 | 3.63 | -74.77 | 0.0534 | -0.5672 | |||
| TILE / Interface, Inc. | 0.17 | 0.00 | 3.53 | 5.50 | 0.0520 | -0.0925 | |||
| CZWI / Citizens Community Bancorp, Inc. | 0.25 | -1.04 | 3.43 | -5.04 | 0.0505 | -0.1053 | |||
| NINE / Nine Energy Service, Inc. | 4.18 | -0.13 | 3.22 | -31.84 | 0.0475 | -0.1567 | |||
| KLXE / KLX Energy Services Holdings, Inc. | 1.69 | 1.20 | 3.17 | -45.94 | 0.0841 | -0.1688 | |||
| SLND / Southland Holdings, Inc. | 0.74 | 6.74 | 3.10 | 49.21 | 0.0457 | -0.0440 | |||
| PSCE / Invesco Exchange-Traded Fund Trust II - Invesco S&P SmallCap Energy ETF | 0.07 | -5.07 | 2.91 | -11.96 | 0.0429 | -0.0998 | |||
| COHR / Coherent Corp. | 0.03 | 0.00 | 2.80 | 37.40 | 0.0412 | -0.0467 | |||
| SXC / SunCoke Energy, Inc. | 0.29 | 7.02 | 2.51 | -0.04 | 0.0369 | -0.0714 | |||
| FLEX / Flex Ltd. | 0.05 | 2.50 | 0.0663 | 0.0663 | |||||
| CAC / Camden National Corporation | 0.06 | -49.41 | 2.49 | -49.28 | 0.0366 | -0.1750 | |||
| BW / Babcock & Wilcox Enterprises, Inc. | 2.57 | 49.25 | 2.48 | 113.53 | 0.0365 | -0.0136 | |||
| LUMN / Lumen Technologies, Inc. | 0.55 | 0.00 | 2.41 | 11.73 | 0.0355 | -0.0576 | |||
| BVFL / BV Financial, Inc. | 0.14 | 0.00 | 2.15 | -0.19 | 0.0317 | -0.0614 | |||
| SHBI / Shore Bancshares, Inc. | 0.14 | -51.72 | 2.15 | -43.94 | 0.0317 | -0.1340 | |||
| ORN / Orion Group Holdings, Inc. | 0.19 | -67.10 | 1.74 | -42.96 | 0.0256 | -0.1060 | |||
| FENC / Fennec Pharmaceuticals Inc. | 0.14 | -28.44 | 1.16 | -2.44 | 0.0171 | -0.0342 | |||
| BRBS / Blue Ridge Bankshares, Inc. | 0.31 | 11.12 | 1.12 | 22.40 | 0.0165 | -0.0230 | |||
| SBFG / SB Financial Group, Inc. | 0.05 | 0.00 | 0.88 | -8.20 | 0.0130 | -0.0286 | |||
| FRBA / First Bank | 0.05 | -15.21 | 0.76 | -11.36 | 0.0112 | -0.0257 | |||
| INVX / Innovex International, Inc. | 0.04 | 0.61 | 0.0163 | 0.0163 | |||||
| TGEN / Tecogen Inc. | 0.04 | 0.28 | 0.0075 | 0.0075 | |||||
| CIVB / Civista Bancshares, Inc. | 0.01 | 0.00 | 0.23 | 18.97 | 0.0034 | -0.0050 | |||
| OCC / Optical Cable Corporation | 0.07 | 51.00 | 0.20 | 57.60 | 0.0029 | -0.0025 | |||
| ASTL / Algoma Steel Group Inc. | 0.09 | 0.00 | 0.05 | 38.24 | 0.0007 | -0.0008 | |||
| EQT / EQT Corporation | 0.00 | -100.00 | 0.00 | 0.0000 | |||||
| XLE / The Select Sector SPDR Trust - The Energy Select Sector SPDR Fund | 0.00 | -100.00 | 0.00 | 0.0000 | |||||
| IWN / iShares Trust - iShares Russell 2000 Value ETF | 0.00 | -100.00 | 0.00 | 0.0000 | |||||
| HP / Helmerich & Payne, Inc. | 0.00 | -100.00 | 0.00 | 0.0000 | |||||
| HBT / HBT Financial, Inc. | 0.00 | -100.00 | 0.00 | 0.0000 | |||||
| KRE / SPDR Series Trust - SPDR S&P Regional Banking ETF | 0.00 | -100.00 | 0.00 | 0.0000 | |||||
| HAL / Halliburton Company | 0.00 | -100.00 | 0.00 | 0.0000 | |||||
| HWBK / Hawthorn Bancshares, Inc. | 0.00 | -100.00 | 0.00 | 0.0000 | |||||
| C / Citigroup Inc. | 0.00 | -100.00 | 0.00 | 0.0000 | |||||
| SDRL / Seadrill Limited | 0.00 | -100.00 | 0.00 | 0.0000 | |||||
| CMT / Core Molding Technologies, Inc. | 0.00 | -100.00 | 0.00 | 0.0000 | |||||
| BORR / Borr Drilling Limited | 0.00 | -100.00 | 0.00 | 0.0000 | |||||
| QXO / QXO, Inc. | 0.00 | -100.00 | 0.00 | 0.0000 |