Mga Batayang Estadistika
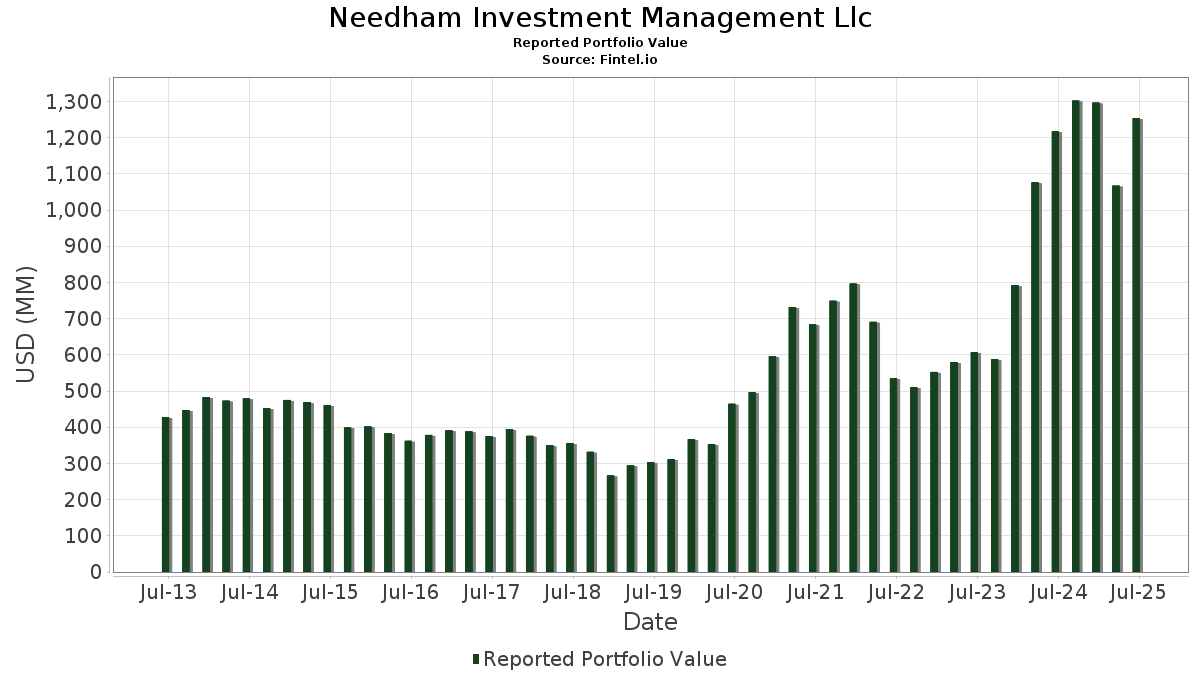
| Nilai Portofolio | $ 1,253,942,445 |
| Posisi Saat Ini | 150 |
Kepemilikan Terbaru, Kinerja, AUM (dari 13F, 13D)
Needham Investment Management Llc telah mengungkapkan total kepemilikan 150 dalam pengajuan SEC terbaru mereka. Nilai portofolio terbaru dihitung sebesar $ 1,253,942,445 USD. Aset yang Dikelola (AUM) sebenarnya adalah nilai ini ditambah kas (yang tidak diungkapkan). Aset-aset utama Needham Investment Management Llc adalah Super Micro Computer, Inc. (US:SMCI) , ThredUp Inc. (US:TDUP) , PDF Solutions, Inc. (US:PDFS) , Vertiv Holdings Co (US:VRT) , and nLIGHT, Inc. (US:LASR) . Posisi baru Needham Investment Management Llc meliputi: Circle Internet Group, Inc. (US:CRCL) , Sportradar Group AG (US:SRAD) , Select Water Solutions, Inc. (US:WTTR) , Evolv Technologies Holdings, Inc. (US:EVLV) , and . Industri unggulan Needham Investment Management Llc adalah "Printing, Publishing, And Allied Industries" (sic 27) , "Insurance Carriers" (sic 63) , and "Food And Kindred Products" (sic 20) .
Peningkatan Tertinggi Kuartal Ini
Kami menggunakan perubahan dalam alokasi portofolio karena ini adalah metrik yang paling bermakna. Perubahan dapat disebabkan oleh perdagangan atau perubahan harga saham.
| Keamanan | Saham (MM) |
Nilai (Juta Dolar AS) |
Portfolio % | ΔPorsyento ng Portfolio |
|---|---|---|---|---|
| 5.88 | 44.00 | 1.9803 | 0.5463 | |
| 0.01 | 1.81 | 0.1446 | 0.1446 | |
| 0.04 | 0.98 | 0.0784 | 0.0784 | |
| 0.10 | 0.86 | 0.0689 | 0.0689 | |
| 0.10 | 0.62 | 0.0498 | 0.0498 | |
| 0.04 | 0.79 | 0.0356 | 0.0356 | |
| 0.04 | 0.72 | 0.0323 | 0.0013 |
Penurunan Tertinggi Kuartal Ini
Kami menggunakan perubahan dalam alokasi portofolio karena ini adalah metrik yang paling bermakna. Perubahan dapat disebabkan oleh perdagangan atau perubahan harga saham.
| Keamanan | Saham (MM) |
Nilai (Juta Dolar AS) |
Portfolio % | ΔPorsyento ng Portfolio |
|---|---|---|---|---|
| 0.71 | 32.00 | 1.4402 | -1.9527 | |
| 1.91 | 40.91 | 1.8411 | -1.4986 | |
| 1.43 | 69.94 | 3.1474 | -1.4487 | |
| 5.53 | 25.05 | 1.1273 | -1.2640 | |
| 1.52 | 24.22 | 1.0899 | -1.0953 | |
| 2.35 | 24.49 | 1.1022 | -1.0880 | |
| 0.24 | 19.36 | 0.8711 | -1.0389 | |
| 0.82 | 35.94 | 1.6176 | -0.9876 | |
| 0.56 | 33.12 | 1.4907 | -0.9255 | |
| 0.62 | 17.51 | 0.7879 | -0.8888 |
Pengajuan 13D/G
Ini adalah daftar pengajuan 13D dan 13G yang dibuat dalam setahun terakhir (jika ada). Klik ikon tautan untuk melihat riwayat transaksi lengkap. Baris berwarna hijau menunjukkan posisi baru. Baris berwarna merah menunjukkan posisi yang sudah ditutup.
| Tanggal File | Formulir | Keamanan | Sebelumnya Saham |
Saat ini Saham |
ΔPersentase Saham | % Kepemilikan |
% ΔKepemilikan | |
|---|---|---|---|---|---|---|---|---|
| 2025-08-13 | KVHI / KVH Industries, Inc. | 1,366,500 | 814,100 | -40.42 | 4.20 | -39.13 | ||
| 2025-08-13 | LASR / nLIGHT, Inc. | 2,652,115 | 1,837,740 | -30.71 | 3.70 | -32.48 | ||
| 2025-08-13 | TDUP / ThredUp Inc. | 6,200,000 | 5,875,000 | -5.24 | 6.10 | -17.01 | ||
| 2025-05-14 | LGTY / Logility Supply Chain Solutions, Inc. | 1,675,000 | 460,000 | -72.54 | 1.40 | -73.68 | ||
| 2025-05-14 | POCI / Precision Optics Corporation, Inc. | 400,000 | 700,000 | 75.00 | 9.10 | 44.44 | ||
| 2025-05-14 | UIS / Unisys Corporation | 4,630,000 | 5,559,800 | 20.08 | 8.00 | 19.58 | ||
| 2025-05-14 | AE / Adams Resources & Energy, Inc. | 190,000 | 0 | -100.00 | 0.00 | -100.00 | ||
| 2025-02-13 | MTRX / Matrix Service Company | 1,375,000 | 1,420,000 | 3.27 | 5.15 | 3.21 | ||
| 2024-12-20 | CMTL / Comtech Telecommunications Corp. | 1,502,500 | 1,780,000 | 18.47 | 6.11 | 15.94 | ||
| 2024-11-13 | FARO / FARO Technologies, Inc. | 1,029,250 | 5.28 | |||||
| 2024-11-13 | EDUC / Educational Development Corporation | 560,000 | 805,000 | 43.75 | 9.38 | 43.64 | ||
| 2024-11-13 | RSSS / Research Solutions, Inc. | 1,700,000 | 2,875,000 | 69.12 | 8.83 | 69.48 | ||
| 2024-11-13 | ASUR / Asure Software, Inc. | 1,315,000 | 2,482,500 | 88.78 | 9.38 | 82.14 | ||
| 2024-11-13 | VPG / Vishay Precision Group, Inc. | 677,500 | 5.54 |
Pengajuan 13F dan Dana
Formulir ini diajukan pada 2025-08-14 untuk periode pelaporan 2025-06-30. Klik ikon tautan untuk melihat riwayat transaksi selengkapnya.
Tingkatkan ke versi premium untuk membuka data premium dan ekspor ke Excel. ![]() .
.
| Keamanan | Ketik | Harga Saham Rata-rata | Saham (MM) |
ΔSaham (%) |
ΔSaham (%) |
Nilai ($MM) |
Portpolyo (%) |
ΔPortofolio (%) |
|
|---|---|---|---|---|---|---|---|---|---|
| SMCI / Super Micro Computer, Inc. | 1.43 | -0.38 | 69.94 | 42.59 | 3.1474 | -1.4487 | |||
| TDUP / ThredUp Inc. | 5.88 | -7.48 | 44.00 | 187.54 | 1.9803 | 0.5463 | |||
| PDFS / PDF Solutions, Inc. | 1.91 | 2.60 | 40.91 | 14.79 | 1.8411 | -1.4986 | |||
| VRT / Vertiv Holdings Co | 0.28 | 0.00 | 36.56 | 77.86 | 1.6456 | -0.2809 | |||
| LASR / nLIGHT, Inc. | 1.84 | -28.23 | 36.17 | 81.78 | 1.6276 | -0.2366 | |||
| FARO / FARO Technologies, Inc. | 0.82 | -19.64 | 35.94 | 29.29 | 1.6176 | -0.9876 | |||
| NVMI / Nova Ltd. | 0.13 | -7.82 | 35.71 | 37.63 | 1.6070 | -0.8242 | |||
| ODC / Oil-Dri Corporation of America | 0.56 | 0.00 | 33.12 | 28.46 | 1.4907 | -0.9255 | |||
| VICR / Vicor Corporation | 0.71 | -8.85 | 32.00 | -11.62 | 1.4402 | -1.9527 | |||
| AIP / Arteris, Inc. | 2.96 | 5.07 | 28.16 | 44.91 | 1.2674 | -0.5538 | |||
| UIS / Unisys Corporation | 5.53 | -0.54 | 25.05 | -1.84 | 1.1273 | -1.2640 | |||
| GENI / Genius Sports Limited | 2.35 | 0.86 | 24.49 | 4.79 | 1.1022 | -1.0880 | |||
| ASUR / Asure Software, Inc. | 2.50 | 0.00 | 24.35 | 2.20 | 1.9420 | -0.2908 | |||
| VSH / Vishay Intertechnology, Inc. | 1.52 | 3.98 | 24.22 | 3.86 | 1.0899 | -1.0953 | |||
| FORM / FormFactor, Inc. | 0.66 | -1.50 | 22.54 | 19.81 | 1.0143 | -0.7486 | |||
| ARLO / Arlo Technologies, Inc. | 1.31 | 0.77 | 22.18 | 73.16 | 0.9980 | -0.2021 | |||
| PSN / Parsons Corporation | 0.29 | -1.11 | 20.74 | 19.86 | 0.9334 | -0.6880 | |||
| VITL / Vital Farms, Inc. | 0.51 | 0.50 | 19.55 | 27.04 | 0.8798 | -0.5621 | |||
| ENTG / Entegris, Inc. | 0.24 | 3.00 | 19.36 | -5.03 | 0.8711 | -1.0389 | |||
| MTRX / Matrix Service Company | 1.42 | 0.00 | 19.18 | 8.69 | 0.8634 | -0.7906 | |||
| VPG / Vishay Precision Group, Inc. | 0.66 | -4.04 | 18.48 | 11.93 | 0.8315 | -0.7153 | |||
| ASPN / Aspen Aerogels, Inc. | 3.01 | 10.12 | 17.84 | 2.02 | 0.8031 | -0.8359 | |||
| THR / Thermon Group Holdings, Inc. | 0.62 | -2.96 | 17.51 | -2.16 | 0.7879 | -0.8888 | |||
| CRAI / CRA International, Inc. | 0.08 | 1.80 | 15.88 | 10.13 | 0.7146 | -0.6365 | |||
| AKAM / Akamai Technologies, Inc. | 0.19 | -5.82 | 14.84 | -6.69 | 0.6676 | -0.8222 | |||
| COHR / Coherent Corp. | 0.17 | 0.00 | 14.81 | 37.37 | 0.6665 | -0.3437 | |||
| LH / Labcorp Holdings Inc. | 0.06 | -0.44 | 14.78 | 12.29 | 0.6653 | -0.5683 | |||
| VECO / Veeco Instruments Inc. | 0.72 | 0.00 | 14.65 | 1.19 | 0.6593 | -0.6973 | |||
| PLAB / Photronics, Inc. | 0.76 | 1.60 | 14.35 | -7.85 | 0.6457 | -0.8133 | |||
| CLH / Clean Harbors, Inc. | 0.06 | 0.00 | 14.08 | 17.29 | 0.6337 | -0.4912 | |||
| LINC / Lincoln Educational Services Corporation | 0.61 | 0.74 | 14.05 | 46.32 | 0.6323 | -0.2674 | |||
| BFAM / Bright Horizons Family Solutions Inc. | 0.11 | 0.00 | 13.29 | -2.72 | 0.5979 | -0.6818 | |||
| TTMI / TTM Technologies, Inc. | 0.32 | -32.04 | 13.23 | 35.25 | 0.5952 | -0.3211 | |||
| HII / Huntington Ingalls Industries, Inc. | 0.05 | 0.00 | 13.16 | 18.34 | 0.5922 | -0.4498 | |||
| KLAC / KLA Corporation | 0.01 | -9.38 | 12.99 | 19.42 | 0.5845 | -0.4347 | |||
| MKSI / MKS Inc. | 0.13 | 0.00 | 12.79 | 23.97 | 0.5757 | -0.3913 | |||
| WAB / Westinghouse Air Brake Technologies Corporation | 0.06 | -3.88 | 11.67 | 10.96 | 0.5253 | -0.4604 | |||
| NVT / nVent Electric plc | 0.16 | 0.00 | 11.54 | 39.73 | 0.5192 | -0.2544 | |||
| TMO / Thermo Fisher Scientific Inc. | 0.03 | 0.00 | 10.74 | -18.52 | 0.4836 | -0.7521 | |||
| UTI / Universal Technical Institute, Inc. | 0.31 | 1.63 | 10.54 | 34.12 | 0.4743 | -0.2620 | |||
| KVYO / Klaviyo, Inc. | 0.30 | -1.29 | 10.24 | 9.53 | 0.4609 | -0.4153 | |||
| ADTN / ADTRAN Holdings, Inc. | 1.12 | 0.00 | 10.05 | 2.87 | 0.4521 | -0.4630 | |||
| MKL / Markel Group Inc. | 0.00 | 0.00 | 9.89 | 6.83 | 0.4449 | -0.4223 | |||
| CTRI / Centuri Holdings, Inc. | 0.42 | -6.70 | 9.37 | 27.74 | 0.4218 | -0.2657 | |||
| BRKR / Bruker Corporation | 0.22 | -4.13 | 9.08 | -5.37 | 0.4088 | -0.4908 | |||
| ATRO / Astronics Corporation | 0.27 | 0.00 | 8.96 | 38.52 | 0.4030 | -0.2028 | |||
| KMX / CarMax, Inc. | 0.13 | -3.64 | 8.91 | -16.88 | 0.4008 | -0.6032 | |||
| RSSS / Research Solutions, Inc. | 2.93 | 0.00 | 8.41 | 10.38 | 0.3784 | -0.3354 | |||
| CMCSA / Comcast Corporation | 0.23 | -2.92 | 8.30 | -6.11 | 0.3734 | -0.4547 | |||
| ECVT / Ecovyst Inc. | 0.92 | 0.00 | 7.57 | 32.73 | 0.3408 | -0.1937 | |||
| SMID / Smith-Midland Corporation | 0.22 | 2.84 | 7.28 | 11.09 | 0.3277 | -0.2866 | |||
| EQIX / Equinix, Inc. | 0.01 | 16.88 | 7.16 | 14.03 | 0.3222 | -0.2661 | |||
| ECG / Everus Construction Group, Inc. | 0.10 | -13.93 | 6.67 | 47.44 | 0.3002 | -0.1238 | |||
| MDU / MDU Resources Group, Inc. | 0.39 | -14.16 | 6.57 | -15.38 | 0.2956 | -0.4317 | |||
| GILD / Gilead Sciences, Inc. | 0.06 | -3.91 | 6.13 | -4.92 | 0.2757 | -0.3281 | |||
| MTN / Vail Resorts, Inc. | 0.04 | 79.07 | 6.05 | 75.84 | 0.2723 | -0.0501 | |||
| TRNS / Transcat, Inc. | 0.07 | 2.31 | 5.72 | 18.12 | 0.2573 | -0.1962 | |||
| EHC / Encompass Health Corporation | 0.04 | -10.00 | 5.52 | 8.97 | 0.2483 | -0.2262 | |||
| MYRG / MYR Group Inc. | 0.03 | 0.00 | 5.44 | 60.47 | 0.2450 | -0.0729 | |||
| HLIT / Harmonic Inc. | 0.56 | 0.00 | 5.35 | -1.26 | 0.2408 | -0.2669 | |||
| HON / Honeywell International Inc. | 0.02 | 0.00 | 5.24 | 9.97 | 0.2358 | -0.2106 | |||
| VSAT / Viasat, Inc. | 0.36 | 0.00 | 5.18 | 40.11 | 0.2333 | -0.1134 | |||
| GRC / The Gorman-Rupp Company | 0.14 | 1.08 | 5.14 | 5.74 | 0.2314 | -0.2242 | |||
| CAMT / Camtek Ltd. | 0.06 | 26.32 | 5.07 | 82.22 | 0.2283 | -0.0326 | |||
| HQL / Abrdn Life Sciences Investors | 0.39 | 3.41 | 5.02 | 4.39 | 0.2257 | -0.2245 | |||
| CGNX / Cognex Corporation | 0.16 | 0.00 | 4.93 | 6.34 | 0.2220 | -0.2127 | |||
| BSY / Bentley Systems, Incorporated | 0.09 | -10.26 | 4.72 | 23.13 | 0.2125 | -0.1469 | |||
| BA / The Boeing Company | 0.02 | 0.00 | 4.71 | 22.86 | 0.2122 | -0.1474 | |||
| SITM / SiTime Corporation | 0.02 | -16.98 | 4.69 | 15.70 | 0.2110 | -0.1686 | |||
| ASML / ASML Holding N.V. - Depositary Receipt (Common Stock) | 0.01 | 4.55 | 4.61 | 26.43 | 0.2074 | -0.1341 | |||
| HQH / Abrdn Healthcare Investors | 0.28 | 7.07 | 4.39 | 2.12 | 0.1974 | -0.2051 | |||
| MDT / Medtronic plc | 0.05 | -1.96 | 4.36 | -4.88 | 0.1963 | -0.2335 | |||
| MRVL / Marvell Technology, Inc. | 0.06 | -2.63 | 4.30 | 22.40 | 0.1933 | -0.1355 | |||
| TER / Teradyne, Inc. | 0.05 | -21.49 | 4.27 | -14.53 | 0.1922 | -0.2761 | |||
| NVGS / Navigator Holdings Ltd. | 0.30 | -1.31 | 4.26 | 4.93 | 0.1917 | -0.1887 | |||
| CMT / Core Molding Technologies, Inc. | 0.26 | 0.00 | 4.23 | 9.13 | 0.1904 | -0.1728 | |||
| CMTL / Comtech Telecommunications Corp. | 1.69 | 0.00 | 4.14 | 53.13 | 0.1862 | -0.0670 | |||
| KVHI / KVH Industries, Inc. | 0.74 | -20.22 | 3.94 | -19.63 | 0.1773 | -0.2820 | |||
| TTD / The Trade Desk, Inc. | 0.05 | -25.34 | 3.92 | -1.78 | 0.1766 | -0.1977 | |||
| NTIC / Northern Technologies International Corporation | 0.52 | -1.90 | 3.82 | -30.18 | 0.1719 | -0.3407 | |||
| AAPL / Apple Inc. | 0.02 | -3.15 | 3.79 | -10.54 | 0.1704 | -0.2262 | |||
| ROG / Rogers Corporation | 0.06 | 0.00 | 3.77 | 1.40 | 0.1695 | -0.1785 | |||
| GTLS / Chart Industries, Inc. | 0.02 | -6.25 | 3.70 | 6.93 | 0.1667 | -0.1579 | |||
| RPD / Rapid7, Inc. | 0.16 | 100.00 | 3.70 | 74.53 | 0.1666 | -0.0322 | |||
| SSSS / SuRo Capital Corp. | 0.44 | 15.85 | 3.60 | 91.39 | 0.1621 | -0.0143 | |||
| POCI / Precision Optics Corporation, Inc. | 0.70 | 0.00 | 3.41 | 17.35 | 0.1534 | -0.1188 | |||
| LMAT / LeMaitre Vascular, Inc. | 0.04 | 3.90 | 3.32 | 2.85 | 0.1495 | -0.1532 | |||
| DD / DuPont de Nemours, Inc. | 0.05 | 46.15 | 3.26 | 34.24 | 0.1466 | -0.0808 | |||
| CRH / CRH plc | 0.03 | 0.00 | 3.03 | 4.34 | 0.1363 | -0.1357 | |||
| J / Jacobs Solutions Inc. | 0.02 | 2.33 | 2.89 | 11.24 | 0.1301 | -0.1134 | |||
| BDX / Becton, Dickinson and Company | 0.02 | -1.47 | 2.89 | -25.91 | 0.1298 | -0.2350 | |||
| APT / Alpha Pro Tech, Ltd. | 0.61 | 0.00 | 2.87 | -6.21 | 0.1293 | -0.1577 | |||
| BN / Brookfield Corporation | 0.05 | 0.00 | 2.86 | 18.21 | 0.1289 | -0.0982 | |||
| AL / Air Lease Corporation | 0.04 | -12.62 | 2.63 | 5.83 | 0.1185 | -0.1147 | |||
| CEVA / CEVA, Inc. | 0.12 | 25.00 | 2.53 | 7.26 | 0.1138 | -0.1070 | |||
| TTI / TETRA Technologies, Inc. | 0.75 | 61.29 | 2.52 | 61.33 | 0.1134 | -0.0330 | |||
| LRCX / Lam Research Corporation | 0.03 | 0.00 | 2.43 | 33.90 | 0.1095 | -0.0608 | |||
| ADI / Analog Devices, Inc. | 0.01 | 0.00 | 2.38 | 18.06 | 0.1071 | -0.0819 | |||
| PRO / PROS Holdings, Inc. | 0.15 | 87.50 | 2.35 | 54.34 | 0.1057 | -0.0369 | |||
| CRI / Carter's, Inc. | 0.08 | -35.98 | 2.30 | -52.85 | 0.1037 | -0.3543 | |||
| CYRX / Cryoport, Inc. | 0.31 | 10.81 | 2.29 | 35.92 | 0.1032 | -0.0549 | |||
| COHU / Cohu, Inc. | 0.12 | 0.00 | 2.27 | 30.84 | 0.1022 | -0.0605 | |||
| GLW / Corning Incorporated | 0.04 | -1.18 | 2.21 | 13.52 | 0.0994 | -0.0829 | |||
| MXL / MaxLinear, Inc. | 0.15 | 3.33 | 2.20 | 35.17 | 0.0991 | -0.0535 | |||
| CALX / Calix, Inc. | 0.04 | -81.13 | 2.13 | -71.69 | 0.0958 | -0.6083 | |||
| BIGC / Commerce.com, Inc. | 0.42 | -5.56 | 2.12 | -18.02 | 0.0956 | -0.1473 | |||
| SGH / SMART Global Holdings, Inc. | 0.10 | 5.00 | 2.08 | 19.75 | 0.0936 | -0.0692 | |||
| CRCL / Circle Internet Group, Inc. | 0.01 | 1.81 | 0.1446 | 0.1446 | |||||
| HPE / Hewlett Packard Enterprise Company | 0.08 | 0.00 | 1.72 | 32.48 | 0.0773 | -0.0441 | |||
| ALGM / Allegro MicroSystems, Inc. | 0.05 | 0.00 | 1.71 | 36.07 | 0.0769 | -0.0408 | |||
| GNRC / Generac Holdings Inc. | 0.01 | 0.00 | 1.58 | 13.07 | 0.0709 | -0.0597 | |||
| NSIT / Insight Enterprises, Inc. | 0.01 | 100.00 | 1.52 | 84.22 | 0.0684 | -0.0089 | |||
| AMAT / Applied Materials, Inc. | 0.01 | -8.33 | 1.51 | 15.62 | 0.0680 | -0.0544 | |||
| BMI / Badger Meter, Inc. | 0.01 | -58.62 | 1.47 | -46.74 | 0.0661 | -0.1924 | |||
| MATW / Matthews International Corporation | 0.06 | 26.32 | 1.43 | 35.80 | 0.0646 | -0.0344 | |||
| DGX / Quest Diagnostics Incorporated | 0.01 | -3.23 | 1.35 | 2.75 | 0.0606 | -0.0622 | |||
| ICHR / Ichor Holdings, Ltd. | 0.07 | 60.71 | 1.33 | 39.62 | 0.0597 | -0.0293 | |||
| ESOA / Energy Services of America Corporation | 0.12 | 25.00 | 1.24 | 31.43 | 0.0559 | -0.0326 | |||
| MBLY / Mobileye Global Inc. | 0.07 | -10.52 | 1.24 | 11.73 | 0.0558 | -0.0481 | |||
| CVX / Chevron Corporation | 0.01 | -5.71 | 1.18 | -19.28 | 0.0532 | -0.0840 | |||
| LUV / Southwest Airlines Co. | 0.04 | 0.00 | 1.14 | -3.38 | 0.0515 | -0.0595 | |||
| FEIM / Frequency Electronics, Inc. | 0.05 | -44.44 | 1.14 | -19.39 | 0.0511 | -0.0809 | |||
| RTX / RTX Corporation | 0.01 | 7.14 | 1.10 | 18.12 | 0.0493 | -0.0376 | |||
| MASS / 908 Devices Inc. | 0.15 | -25.00 | 1.07 | 19.31 | 0.0481 | -0.0358 | |||
| EDUC / Educational Development Corporation | 0.80 | -0.62 | 1.06 | -3.45 | 0.0479 | -0.0555 | |||
| SRAD / Sportradar Group AG | 0.04 | 0.98 | 0.0784 | 0.0784 | |||||
| VZ / Verizon Communications Inc. | 0.02 | 0.00 | 0.87 | -4.63 | 0.0389 | -0.0461 | |||
| WTTR / Select Water Solutions, Inc. | 0.10 | 0.86 | 0.0689 | 0.0689 | |||||
| AXTI / AXT, Inc. | 0.39 | -33.70 | 0.82 | -1.67 | 0.0370 | -0.0414 | |||
| QRHC / Quest Resource Holding Corporation | 0.41 | 0.00 | 0.82 | -22.27 | 0.0369 | -0.0620 | |||
| UCTT / Ultra Clean Holdings, Inc. | 0.04 | 0.79 | 0.0356 | 0.0356 | |||||
| CRWD / CrowdStrike Holdings, Inc. | 0.00 | 0.00 | 0.76 | 44.51 | 0.0344 | -0.0152 | |||
| EXTR / Extreme Networks, Inc. | 0.04 | 60.00 | 0.72 | 117.58 | 0.0323 | 0.0013 | |||
| GOOGL / Alphabet Inc. | 0.00 | 0.00 | 0.70 | 13.92 | 0.0317 | -0.0262 | |||
| BAM / Brookfield Asset Management Ltd. | 0.01 | 0.00 | 0.69 | 14.14 | 0.0313 | -0.0258 | |||
| TENB / Tenable Holdings, Inc. | 0.02 | 100.00 | 0.68 | 93.41 | 0.0304 | -0.0024 | |||
| EVLV / Evolv Technologies Holdings, Inc. | 0.10 | 0.62 | 0.0498 | 0.0498 | |||||
| LIND / Lindblad Expeditions Holdings, Inc. | 0.05 | 0.00 | 0.61 | 25.83 | 0.0274 | -0.0179 | |||
| PSTG / Pure Storage, Inc. | 0.01 | -50.00 | 0.58 | -35.03 | 0.0259 | -0.0571 | |||
| MRCY / Mercury Systems, Inc. | 0.01 | -63.64 | 0.54 | -54.56 | 0.0242 | -0.0868 | |||
| LAB / Standard BioTools Inc. | 0.43 | -18.71 | 0.52 | -9.71 | 0.0235 | -0.0306 | |||
| MATV / Mativ Holdings, Inc. | 0.07 | -53.23 | 0.49 | -48.81 | 0.0223 | -0.0682 | |||
| EHAB / Enhabit, Inc. | 0.05 | 0.00 | 0.48 | 9.79 | 0.0217 | -0.0195 | |||
| POWI / Power Integrations, Inc. | 0.01 | 50.00 | 0.42 | 66.27 | 0.0189 | -0.0048 | |||
| KLC / KinderCare Learning Companies, Inc. | 0.04 | -47.54 | 0.40 | -54.25 | 0.0182 | -0.0646 | |||
| UGI / UGI Corporation | 0.01 | 0.00 | 0.36 | 10.30 | 0.0164 | -0.0146 | |||
| KRP / Kimbell Royalty Partners, LP - Limited Partnership | 0.03 | 0.00 | 0.35 | -0.28 | 0.0160 | -0.0174 | |||
| CDNA / CareDx, Inc | 0.01 | 0.00 | 0.29 | 10.15 | 0.0132 | -0.0118 | |||
| YEXT / Yext, Inc. | 0.03 | -81.82 | 0.26 | -74.90 | 0.0115 | -0.0838 | |||
| FTRE / Fortrea Holdings Inc. | 0.04 | 0.00 | 0.19 | -34.74 | 0.0084 | -0.0183 | |||
| APLD / Applied Digital Corporation | 0.00 | -100.00 | 0.00 | 0.0000 | |||||
| MUR / Murphy Oil Corporation | 0.00 | -100.00 | 0.00 | 0.0000 | |||||
| LINE / Lineage, Inc. | 0.00 | -100.00 | 0.00 | 0.0000 | |||||
| LGTY / Logility Supply Chain Solutions, Inc. | 0.00 | -100.00 | 0.00 | 0.0000 | |||||
| BNT / Brookfield Wealth Solutions Ltd. | 0.00 | -100.00 | 0.00 | 0.0000 |