Mga Batayang Estadistika
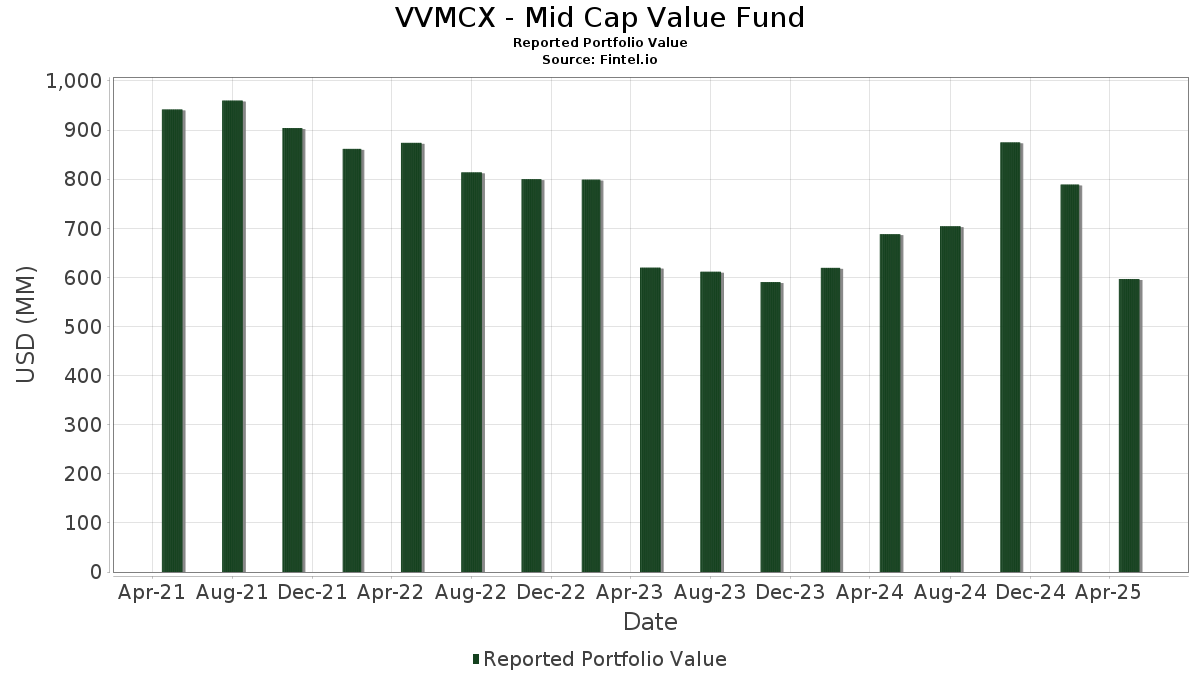
| Nilai Portofolio | $ 596,739,245 |
| Posisi Saat Ini | 206 |
Kepemilikan Terbaru, Kinerja, AUM (dari 13F, 13D)
VVMCX - Mid Cap Value Fund telah mengungkapkan total kepemilikan 206 dalam pengajuan SEC terbaru mereka. Nilai portofolio terbaru dihitung sebesar $ 596,739,245 USD. Aset yang Dikelola (AUM) sebenarnya adalah nilai ini ditambah kas (yang tidak diungkapkan). Aset-aset utama VVMCX - Mid Cap Value Fund adalah State Street Institutional Liquid Reserves Fund (US:US85749R4790) , US Foods Holding Corp. (US:USFD) , Reliance, Inc. (US:RS) , Howmet Aerospace Inc. (US:HWM) , and EQT Corporation (US:EQT) . Posisi baru VVMCX - Mid Cap Value Fund meliputi: Silgan Holdings Inc. (US:SLGN) , Tenet Healthcare Corporation (US:THC) , PTC Inc. (US:PTC) , TechnipFMC plc (US:FTI) , and Jabil Inc. (US:JBL) .
Peningkatan Tertinggi Kuartal Ini
Kami menggunakan perubahan dalam alokasi portofolio karena ini adalah metrik yang paling bermakna. Perubahan dapat disebabkan oleh perdagangan atau perubahan harga saham.
| Keamanan | Saham (MM) |
Nilai (Juta Dolar AS) |
Portfolio % | ΔPorsyento ng Portfolio |
|---|---|---|---|---|
| 0.08 | 4.35 | 0.7330 | 0.7330 | |
| 0.02 | 3.44 | 0.5792 | 0.5792 | |
| 0.02 | 3.33 | 0.5610 | 0.5610 | |
| 0.10 | 3.06 | 0.5143 | 0.5143 | |
| 0.02 | 2.92 | 0.4922 | 0.4922 | |
| 2.84 | 0.4774 | 0.4774 | ||
| 0.11 | 3.67 | 0.6186 | 0.4541 | |
| 0.07 | 2.55 | 0.4295 | 0.4295 | |
| 0.01 | 2.34 | 0.3946 | 0.3946 | |
| 0.02 | 2.33 | 0.3921 | 0.3921 |
Penurunan Tertinggi Kuartal Ini
Kami menggunakan perubahan dalam alokasi portofolio karena ini adalah metrik yang paling bermakna. Perubahan dapat disebabkan oleh perdagangan atau perubahan harga saham.
| Keamanan | Saham (MM) |
Nilai (Juta Dolar AS) |
Portfolio % | ΔPorsyento ng Portfolio |
|---|---|---|---|---|
| 0.01 | 0.90 | 0.1512 | -0.5328 | |
| 0.07 | 1.47 | 0.2478 | -0.5172 | |
| 0.01 | 1.37 | 0.2308 | -0.4892 | |
| 0.04 | 1.86 | 0.3125 | -0.4338 | |
| 0.08 | 3.22 | 0.5416 | -0.3717 | |
| 0.04 | 2.64 | 0.4450 | -0.3210 | |
| 0.02 | 4.04 | 0.6797 | -0.2238 | |
| 0.01 | 3.46 | 0.5827 | -0.2142 | |
| 0.01 | 3.96 | 0.6667 | -0.1948 | |
| 0.00 | 0.00 | -0.1884 |
Pengajuan 13F dan Dana
Formulir ini diajukan pada 2025-07-28 untuk periode pelaporan 2025-05-31. Klik ikon tautan untuk melihat riwayat transaksi selengkapnya.
Tingkatkan ke versi premium untuk membuka data premium dan ekspor ke Excel. ![]() .
.
| Keamanan | Ketik | Harga Saham Rata-rata | Saham (MM) |
ΔSaham (%) |
ΔSaham (%) |
Nilai ($MM) |
Portpolyo (%) |
ΔPortofolio (%) |
|
|---|---|---|---|---|---|---|---|---|---|
| US85749R4790 / State Street Institutional Liquid Reserves Fund | 10.34 | -19.59 | 10.34 | -19.61 | 1.7401 | 0.1088 | |||
| USFD / US Foods Holding Corp. | 0.12 | -22.64 | 9.59 | -14.61 | 1.6150 | 0.1898 | |||
| RS / Reliance, Inc. | 0.03 | -27.77 | 7.85 | -28.83 | 1.3211 | -0.0777 | |||
| HWM / Howmet Aerospace Inc. | 0.04 | -30.02 | 7.58 | -12.96 | 1.2754 | 0.1711 | |||
| EQT / EQT Corporation | 0.13 | -21.35 | 7.28 | -9.98 | 1.2248 | 0.1994 | |||
| LPLA / LPL Financial Holdings Inc. | 0.02 | -17.07 | 7.24 | -13.63 | 1.2195 | 0.1555 | |||
| AMP / Ameriprise Financial, Inc. | 0.01 | -17.51 | 7.06 | -21.81 | 1.1880 | 0.0429 | |||
| SGI / Somnigroup International Inc. | 0.10 | -12.61 | 6.66 | -11.00 | 1.1215 | 0.1719 | |||
| AZO / AutoZone, Inc. | 0.00 | -30.13 | 6.37 | -25.33 | 1.0727 | -0.0099 | |||
| FLEX / Flex Ltd. | 0.15 | -17.05 | 6.20 | -7.40 | 1.0445 | 0.1945 | |||
| SF / Stifel Financial Corp. | 0.06 | 5.63 | 6.02 | -6.29 | 1.0138 | 0.1986 | |||
| VOYA / Voya Financial, Inc. | 0.09 | -6.93 | 5.76 | -14.33 | 0.9691 | 0.1167 | |||
| WH / Wyndham Hotels & Resorts, Inc. | 0.07 | -8.49 | 5.55 | -30.08 | 0.9346 | -0.0727 | |||
| NSC / Norfolk Southern Corporation | 0.02 | -21.62 | 5.51 | -21.18 | 0.9277 | 0.0407 | |||
| CHKP / Check Point Software Technologies Ltd. | 0.02 | -36.20 | 4.98 | -33.71 | 0.8377 | -0.1146 | |||
| COR / Cencora, Inc. | 0.02 | -45.36 | 4.73 | -37.24 | 0.7970 | -0.1599 | |||
| BRX / Brixmor Property Group Inc. | 0.18 | -19.07 | 4.69 | -26.45 | 0.7897 | -0.0194 | |||
| SPG / Simon Property Group, Inc. | 0.03 | -21.62 | 4.60 | -31.31 | 0.7751 | -0.0753 | |||
| TXT / Textron Inc. | 0.06 | -21.61 | 4.40 | -22.36 | 0.7413 | 0.0219 | |||
| SLGN / Silgan Holdings Inc. | 0.08 | 4.35 | 0.7330 | 0.7330 | |||||
| ALLE / Allegion plc | 0.03 | -21.62 | 4.34 | -13.11 | 0.7312 | 0.0971 | |||
| MKL / Markel Group Inc. | 0.00 | -21.67 | 4.26 | -21.33 | 0.7171 | 0.0301 | |||
| CPT / Camden Property Trust | 0.04 | -36.12 | 4.26 | -39.50 | 0.7166 | -0.1761 | |||
| SNV / Synovus Financial Corp. | 0.09 | -7.47 | 4.24 | -14.69 | 0.7140 | 0.0833 | |||
| KMPR / Kemper Corporation | 0.06 | -29.97 | 4.13 | -33.97 | 0.6960 | -0.0983 | |||
| CADE / Cadence Bank | 0.14 | -23.55 | 4.10 | -30.15 | 0.6900 | -0.0543 | |||
| DTE / DTE Energy Company | 0.03 | -29.05 | 4.04 | -27.50 | 0.6801 | -0.0267 | |||
| EVR / Evercore Inc. | 0.02 | -40.78 | 4.04 | -43.30 | 0.6797 | -0.2238 | |||
| EBAY / eBay Inc. | 0.05 | -21.62 | 4.02 | -11.42 | 0.6763 | 0.1010 | |||
| EPRT / Essential Properties Realty Trust, Inc. | 0.12 | -21.64 | 3.96 | -22.18 | 0.6671 | 0.0212 | |||
| EG / Everest Group, Ltd. | 0.01 | -40.67 | 3.96 | -41.69 | 0.6667 | -0.1948 | |||
| SSB / SouthState Corporation | 0.04 | -26.06 | 3.93 | -35.60 | 0.6618 | -0.1126 | |||
| RBA / RB Global, Inc. | 0.04 | -21.61 | 3.93 | -19.38 | 0.6611 | 0.0432 | |||
| HBAN / Huntington Bancshares Incorporated | 0.25 | -28.21 | 3.91 | -31.88 | 0.6588 | -0.0699 | |||
| CF / CF Industries Holdings, Inc. | 0.04 | -21.62 | 3.80 | -12.25 | 0.6401 | 0.0904 | |||
| KEYS / Keysight Technologies, Inc. | 0.02 | -13.62 | 3.80 | -14.99 | 0.6390 | 0.0727 | |||
| MAS / Masco Corporation | 0.06 | -4.80 | 3.77 | -20.96 | 0.6344 | 0.0296 | |||
| IR / Ingersoll Rand Inc. | 0.05 | -16.70 | 3.75 | 26.02 | 0.6312 | 0.2588 | |||
| MPC / Marathon Petroleum Corporation | 0.02 | -12.25 | 3.74 | -6.07 | 0.6304 | 0.1246 | |||
| CHRD / Chord Energy Corporation | 0.04 | -16.12 | 3.74 | -33.96 | 0.6290 | -0.0887 | |||
| VVV / Valvoline Inc. | 0.11 | 202.28 | 3.67 | 183.49 | 0.6186 | 0.4541 | |||
| NVR / NVR, Inc. | 0.00 | -7.19 | 3.67 | -8.86 | 0.6181 | 0.1070 | |||
| JBTM / JBT Marel Corporation | 0.03 | 40.38 | 3.63 | 22.09 | 0.6104 | 0.2337 | |||
| CG / The Carlyle Group Inc. | 0.08 | -21.61 | 3.62 | -28.91 | 0.6101 | -0.0367 | |||
| DKS / DICK'S Sporting Goods, Inc. | 0.02 | 16.44 | 3.60 | -7.23 | 0.6052 | 0.1136 | |||
| TRU / TransUnion | 0.04 | -28.11 | 3.56 | -33.40 | 0.5999 | -0.0789 | |||
| AL / Air Lease Corporation | 0.06 | -39.15 | 3.48 | -26.86 | 0.5863 | -0.0177 | |||
| R / Ryder System, Inc. | 0.02 | -11.98 | 3.48 | -21.25 | 0.5853 | 0.0251 | |||
| WTY / Willis Towers Watson Public Limited Company | 0.01 | -40.88 | 3.46 | -44.91 | 0.5827 | -0.2142 | |||
| THC / Tenet Healthcare Corporation | 0.02 | 3.44 | 0.5792 | 0.5792 | |||||
| MIDD / The Middleby Corporation | 0.02 | -18.67 | 3.41 | -28.15 | 0.5742 | -0.0280 | |||
| EXPD / Expeditors International of Washington, Inc. | 0.03 | -37.14 | 3.38 | -39.62 | 0.5682 | -0.1410 | |||
| PTC / PTC Inc. | 0.02 | 3.33 | 0.5610 | 0.5610 | |||||
| IEX / IDEX Corporation | 0.02 | -29.91 | 3.31 | -34.75 | 0.5564 | -0.0862 | |||
| NGVT / Ingevity Corporation | 0.08 | -23.93 | 3.28 | -33.97 | 0.5520 | -0.0780 | |||
| CTRA / Coterra Energy Inc. | 0.13 | -15.16 | 3.28 | -23.58 | 0.5515 | 0.0076 | |||
| WCC / WESCO International, Inc. | 0.02 | -26.77 | 3.27 | -31.88 | 0.5508 | -0.0585 | |||
| CW / Curtiss-Wright Corporation | 0.01 | -32.98 | 3.26 | -8.31 | 0.5483 | 0.0977 | |||
| MOH / Molina Healthcare, Inc. | 0.01 | -28.93 | 3.24 | -28.01 | 0.5462 | -0.0255 | |||
| FFIV / F5, Inc. | 0.01 | -28.64 | 3.23 | -30.36 | 0.5434 | -0.0447 | |||
| FITB / Fifth Third Bancorp | 0.08 | -49.13 | 3.22 | -55.31 | 0.5416 | -0.3717 | |||
| LAMR / Lamar Advertising Company | 0.03 | -21.61 | 3.20 | -23.94 | 0.5381 | 0.0050 | |||
| UMBF / UMB Financial Corporation | 0.03 | -35.76 | 3.19 | -39.96 | 0.5375 | -0.1371 | |||
| ZBRA / Zebra Technologies Corporation | 0.01 | -21.61 | 3.17 | -27.90 | 0.5342 | -0.0242 | |||
| PH / Parker-Hannifin Corporation | 0.00 | -21.69 | 3.17 | -22.14 | 0.5328 | 0.0171 | |||
| BDC / Belden Inc. | 0.03 | -14.31 | 3.14 | -17.28 | 0.5279 | 0.0469 | |||
| EXE / Expand Energy Corporation | 0.03 | -19.15 | 3.09 | -5.04 | 0.5199 | 0.1073 | |||
| PRGO / Perrigo Company plc | 0.12 | 83.72 | 3.08 | 69.66 | 0.5187 | 0.2882 | |||
| PRGS / Progress Software Corporation | 0.05 | -37.68 | 3.08 | -29.79 | 0.5179 | -0.0380 | |||
| RRC / Range Resources Corporation | 0.08 | -21.61 | 3.08 | -19.69 | 0.5178 | 0.0320 | |||
| FTI / TechnipFMC plc | 0.10 | 3.06 | 0.5143 | 0.5143 | |||||
| SYF / Synchrony Financial | 0.05 | -30.78 | 3.04 | -34.24 | 0.5113 | -0.0746 | |||
| COLB / Columbia Banking System, Inc. | 0.13 | -28.73 | 3.03 | -37.67 | 0.5106 | -0.1067 | |||
| MCHP / Microchip Technology Incorporated | 0.05 | 29.15 | 3.03 | 27.39 | 0.5097 | 0.2081 | |||
| LHX / L3Harris Technologies, Inc. | 0.01 | -29.59 | 3.01 | -16.53 | 0.5067 | 0.0492 | |||
| WBS / Webster Financial Corporation | 0.06 | -30.99 | 3.01 | -36.91 | 0.5064 | -0.0986 | |||
| MOS / The Mosaic Company | 0.08 | -21.61 | 3.00 | 18.44 | 0.5050 | 0.1837 | |||
| DOX / Amdocs Limited | 0.03 | -57.96 | 2.99 | -50.61 | 0.5039 | -0.1402 | |||
| PKG / Packaging Corporation of America | 0.02 | -23.32 | 2.99 | -30.50 | 0.5026 | -0.0423 | |||
| EFX / Equifax Inc. | 0.01 | -21.62 | 2.99 | -15.53 | 0.5025 | 0.0541 | |||
| LRCX / Lam Research Corporation | 0.04 | 53.70 | 2.97 | 61.81 | 0.4993 | 0.2668 | |||
| OGE / OGE Energy Corp. | 0.07 | 3.71 | 2.96 | -0.34 | 0.4982 | 0.1215 | |||
| REG / Regency Centers Corporation | 0.04 | -29.38 | 2.93 | -33.58 | 0.4926 | -0.0662 | |||
| JBL / Jabil Inc. | 0.02 | 2.92 | 0.4922 | 0.4922 | |||||
| SYY / Sysco Corporation | 0.04 | -30.12 | 2.92 | -32.46 | 0.4910 | -0.0569 | |||
| FR / First Industrial Realty Trust, Inc. | 0.06 | -27.48 | 2.90 | -37.20 | 0.4889 | -0.0978 | |||
| US8575093013 / State Street Navigator Securities Lending Government Money Market Portfolio | 2.90 | 232.55 | 2.90 | 232.49 | 0.4876 | 0.3771 | |||
| EWBC / East West Bancorp, Inc. | 0.03 | 3.45 | 2.88 | -0.10 | 0.4852 | 0.1192 | |||
| ESS / Essex Property Trust, Inc. | 0.01 | 20.85 | 2.87 | 10.11 | 0.4824 | 0.1523 | |||
| AME / AMETEK, Inc. | 0.02 | -30.15 | 2.86 | -34.06 | 0.4819 | -0.0687 | |||
| ALGM / Allegro MicroSystems, Inc. | 0.11 | -35.24 | 2.86 | -26.38 | 0.4806 | -0.0114 | |||
| SLM / SLM Corporation | 0.09 | -21.61 | 2.84 | -15.95 | 0.4781 | 0.0494 | |||
| FIXED INC CLEARING CORP.REPO / RA (000000000) | 2.84 | 0.4774 | 0.4774 | ||||||
| BYD / Boyd Gaming Corporation | 0.04 | -21.61 | 2.83 | -22.95 | 0.4765 | 0.0105 | |||
| DCO / Ducommun Incorporated | 0.04 | -6.87 | 2.80 | 11.81 | 0.4717 | 0.1538 | |||
| FTDR / Frontdoor, Inc. | 0.05 | -21.61 | 2.79 | -5.21 | 0.4691 | 0.0962 | |||
| SOLV / Solventum Corporation | 0.04 | -21.62 | 2.77 | -28.17 | 0.4670 | -0.0229 | |||
| GEN / Gen Digital Inc. | 0.10 | -21.63 | 2.77 | -18.35 | 0.4661 | 0.0360 | |||
| ETR / Entergy Corporation | 0.03 | -30.31 | 2.73 | -33.52 | 0.4601 | -0.0615 | |||
| MKSI / MKS Inc. | 0.03 | -24.37 | 2.66 | -32.30 | 0.4470 | -0.0506 | |||
| BCC / Boise Cascade Company | 0.03 | -23.03 | 2.65 | -35.51 | 0.4466 | -0.0751 | |||
| OGS / ONE Gas, Inc. | 0.04 | -55.99 | 2.64 | -56.22 | 0.4450 | -0.3210 | |||
| NTAP / NetApp, Inc. | 0.03 | -18.06 | 2.64 | -18.62 | 0.4446 | 0.0330 | |||
| DELL / Dell Technologies Inc. | 0.02 | 4.79 | 2.63 | 13.51 | 0.4426 | 0.1486 | |||
| GNRC / Generac Holdings Inc. | 0.02 | -21.61 | 2.62 | -29.68 | 0.4416 | -0.0317 | |||
| CDW / CDW Corporation | 0.01 | 177.70 | 2.57 | 121.95 | 0.4324 | 0.2680 | |||
| SARO / StandardAero, Inc. | 0.09 | -11.91 | 2.56 | -8.48 | 0.4307 | 0.0761 | |||
| AVNT / Avient Corporation | 0.07 | 2.55 | 0.4295 | 0.4295 | |||||
| SSNC / SS&C Technologies Holdings, Inc. | 0.03 | -35.89 | 2.55 | -41.82 | 0.4284 | -0.1265 | |||
| WTS / Watts Water Technologies, Inc. | 0.01 | -6.97 | 2.54 | 4.96 | 0.4273 | 0.1206 | |||
| AHR / American Healthcare REIT, Inc. | 0.07 | -42.62 | 2.53 | -32.70 | 0.4258 | -0.0510 | |||
| FANG / Diamondback Energy, Inc. | 0.02 | -29.67 | 2.53 | -40.47 | 0.4253 | -0.1131 | |||
| PRMB / Primo Brands Corporation | 0.08 | 48.52 | 2.52 | 45.83 | 0.4243 | 0.2050 | |||
| COKE / Coca-Cola Consolidated, Inc. | 0.02 | 995.40 | 2.51 | -11.39 | 0.4232 | 0.0633 | |||
| ABCB / Ameris Bancorp | 0.04 | -27.52 | 2.51 | -31.02 | 0.4219 | -0.0390 | |||
| OSW / OneSpaWorld Holdings Limited | 0.13 | 20.90 | 2.47 | 19.53 | 0.4152 | 0.1534 | |||
| AEG / Aegon Ltd. - Depositary Receipt (Common Stock) | 0.34 | -45.76 | 2.46 | -37.90 | 0.4148 | -0.0886 | |||
| AON / Aon plc | 0.01 | -31.09 | 2.45 | -37.32 | 0.4116 | -0.0833 | |||
| VNOM / Viper Energy, Inc. | 0.06 | -20.44 | 2.37 | -32.21 | 0.3987 | -0.0444 | |||
| BALL / Ball Corporation | 0.04 | -21.62 | 2.37 | -20.28 | 0.3983 | 0.0217 | |||
| EGP / EastGroup Properties, Inc. | 0.01 | -21.62 | 2.36 | -27.34 | 0.3974 | -0.0147 | |||
| AMG / Affiliated Managers Group, Inc. | 0.01 | -21.61 | 2.36 | -19.27 | 0.3966 | 0.0265 | |||
| TE Connectivity PLC / EC (IE000IVNQZ81) | 0.01 | 15.24 | 2.35 | 19.77 | 0.3948 | 0.1463 | |||
| CACI / CACI International Inc | 0.01 | 2.34 | 0.3946 | 0.3946 | |||||
| CPK / Chesapeake Utilities Corporation | 0.02 | 2.33 | 0.3921 | 0.3921 | |||||
| LDOS / Leidos Holdings, Inc. | 0.02 | -7.00 | 2.33 | 6.26 | 0.3915 | 0.1139 | |||
| RL / Ralph Lauren Corporation | 0.01 | -41.46 | 2.29 | -40.23 | 0.3857 | -0.1006 | |||
| AR / Antero Resources Corporation | 0.06 | -0.81 | 2.28 | 1.24 | 0.3839 | 0.0981 | |||
| TRV / The Travelers Companies, Inc. | 0.01 | -32.49 | 2.24 | -27.99 | 0.3777 | -0.0176 | |||
| MAR / Marriott International, Inc. | 0.01 | 18.59 | 2.24 | 35.37 | 0.3777 | 0.1359 | |||
| ROST / Ross Stores, Inc. | 0.02 | -31.61 | 2.22 | -31.73 | 0.3744 | -0.0388 | |||
| RKT / Rocket Companies, Inc. | 0.17 | -6.06 | 2.19 | -14.44 | 0.3682 | 0.0439 | |||
| VICI / VICI Properties Inc. | 0.07 | -21.61 | 2.18 | -23.50 | 0.3673 | 0.0055 | |||
| SMPL / The Simply Good Foods Company | 0.06 | 2.18 | 0.3667 | 0.3667 | |||||
| QGEN / Qiagen N.V. | 0.05 | -50.33 | 2.17 | -41.64 | 0.3656 | -0.1064 | |||
| HRB / H&R Block, Inc. | 0.04 | -43.56 | 2.17 | -41.05 | 0.3656 | -0.1016 | |||
| FIVE / Five Below, Inc. | 0.02 | 13.98 | 2.16 | 52.97 | 0.3642 | 0.1847 | |||
| IDCC / InterDigital, Inc. | 0.01 | -21.62 | 2.14 | -20.31 | 0.3595 | 0.0196 | |||
| ELS / Equity LifeStyle Properties, Inc. | 0.03 | -21.61 | 2.13 | -27.33 | 0.3586 | -0.0133 | |||
| CARG / CarGurus, Inc. | 0.07 | 0.70 | 2.13 | -1.98 | 0.3582 | 0.0829 | |||
| VIAV / Viavi Solutions Inc. | 0.23 | 2.13 | 0.3580 | 0.3580 | |||||
| NRG / NRG Energy, Inc. | 0.01 | -32.98 | 2.12 | -1.12 | 0.3576 | 0.0850 | |||
| ADS / Bread Financial Holdings Inc | 0.04 | -14.04 | 2.12 | -18.43 | 0.3562 | 0.0271 | |||
| ATMU / Atmus Filtration Technologies Inc. | 0.06 | -13.45 | 2.11 | -21.66 | 0.3549 | 0.0135 | |||
| UFPI / UFP Industries, Inc. | 0.02 | 23.46 | 2.09 | 12.55 | 0.3520 | 0.1163 | |||
| MCK / McKesson Corporation | 0.00 | 2.07 | 0.3483 | 0.3483 | |||||
| FCX / Freeport-McMoRan Inc. | 0.05 | -21.61 | 2.06 | -18.29 | 0.3460 | 0.0269 | |||
| BXP / Boston Properties, Inc. | 0.03 | -21.61 | 2.03 | -25.59 | 0.3422 | -0.0044 | |||
| TPG / TPG Inc. | 0.04 | -36.77 | 2.03 | -44.85 | 0.3417 | -0.1250 | |||
| LIVN / LivaNova PLC | 0.05 | -9.38 | 2.01 | -5.85 | 0.3386 | 0.0676 | |||
| CNP / CenterPoint Energy, Inc. | 0.05 | -32.47 | 2.00 | -26.85 | 0.3362 | -0.0102 | |||
| CCEP / COCA COLA EUROPACIFIC COMPANY GUAR REGS 11/27 1.5 | 0.02 | -32.81 | 1.99 | -28.52 | 0.3356 | -0.0181 | |||
| EQR / Equity Residential | 0.03 | -21.61 | 1.97 | -25.89 | 0.3321 | -0.0055 | |||
| CROX / Crocs, Inc. | 0.02 | 1.97 | 0.3309 | 0.3309 | |||||
| DRI / Darden Restaurants, Inc. | 0.01 | -4.28 | 1.95 | 2.25 | 0.3284 | 0.0864 | |||
| DD / DuPont de Nemours, Inc. | 0.03 | -21.61 | 1.94 | -35.96 | 0.3268 | -0.0578 | |||
| CMC / Commercial Metals Company | 0.04 | -21.61 | 1.94 | -24.59 | 0.3257 | 0.0001 | |||
| GT / The Goodyear Tire & Rubber Company | 0.17 | -28.77 | 1.93 | -14.01 | 0.3245 | 0.0402 | |||
| FE / FirstEnergy Corp. | 0.05 | -53.99 | 1.92 | -50.23 | 0.3240 | -0.1665 | |||
| MBUU / Malibu Boats, Inc. | 0.06 | -19.70 | 1.92 | -27.49 | 0.3237 | -0.0128 | |||
| BLD / TopBuild Corp. | 0.01 | 1.91 | 0.3219 | 0.3219 | |||||
| SHOO / Steven Madden, Ltd. | 0.08 | -10.92 | 1.91 | -33.04 | 0.3208 | -0.0402 | |||
| MMM / 3M Company | 0.01 | 1.89 | 0.3186 | 0.3186 | |||||
| BOOT / Boot Barn Holdings, Inc. | 0.01 | 1.89 | 0.3178 | 0.3178 | |||||
| FBHS / Fortune Brands Home & Security Inc | 0.04 | -59.48 | 1.86 | -68.45 | 0.3125 | -0.4338 | |||
| FLS / Flowserve Corporation | 0.04 | -34.30 | 1.85 | -40.44 | 0.3122 | -0.0827 | |||
| FAF / First American Financial Corporation | 0.03 | -7.91 | 1.85 | -21.76 | 0.3111 | 0.0115 | |||
| EQH / Equitable Holdings, Inc. | 0.03 | 1.78 | 0.3003 | 0.3003 | |||||
| RNR / RenaissanceRe Holdings Ltd. | 0.01 | -43.07 | 1.78 | -40.25 | 0.2999 | -0.0783 | |||
| EXR / Extra Space Storage Inc. | 0.01 | -35.17 | 1.77 | -35.79 | 0.2976 | -0.0516 | |||
| LW / Lamb Weston Holdings, Inc. | 0.03 | -36.71 | 1.74 | -31.94 | 0.2935 | -0.0315 | |||
| DOV / Dover Corporation | 0.01 | -43.61 | 1.72 | -49.59 | 0.2893 | -0.1431 | |||
| AXTA / Axalta Coating Systems Ltd. | 0.06 | 1.70 | 0.2865 | 0.2865 | |||||
| FLR / Fluor Corporation | 0.04 | -14.46 | 1.70 | -6.49 | 0.2861 | 0.0556 | |||
| LSTR / Landstar System, Inc. | 0.01 | -3.04 | 1.67 | -16.22 | 0.2819 | 0.0283 | |||
| ICLR / ICON Public Limited Company | 0.01 | -26.88 | 1.66 | -49.86 | 0.2800 | -0.1409 | |||
| MSM / MSC Industrial Direct Co., Inc. | 0.02 | -21.61 | 1.66 | -20.80 | 0.2789 | 0.0135 | |||
| PRAA / PRA Group, Inc. | 0.12 | -11.09 | 1.65 | -39.72 | 0.2778 | -0.0695 | |||
| CTSH / Cognizant Technology Solutions Corporation | 0.02 | -21.61 | 1.61 | -23.80 | 0.2705 | 0.0029 | |||
| COF / Capital One Financial Corporation | 0.01 | -28.49 | 1.61 | -11.76 | 0.2703 | 0.0589 | |||
| FIS / Fidelity National Information Services, Inc. | 0.02 | -21.61 | 1.60 | -12.26 | 0.2687 | 0.0379 | |||
| LKQ / LKQ Corporation | 0.04 | 221.86 | 1.53 | 209.11 | 0.2572 | 0.1944 | |||
| DGX / Quest Diagnostics Incorporated | 0.01 | -21.61 | 1.52 | -21.41 | 0.2559 | 0.0105 | |||
| PSX / Phillips 66 | 0.01 | -21.60 | 1.51 | -31.42 | 0.2536 | -0.0250 | |||
| GNTX / Gentex Corporation | 0.07 | -72.47 | 1.47 | -75.59 | 0.2478 | -0.5172 | |||
| OKE / ONEOK, Inc. | 0.02 | 1.46 | 0.2464 | 0.2464 | |||||
| CCS / Century Communities, Inc. | 0.03 | -26.27 | 1.46 | -44.92 | 0.2464 | -0.0907 | |||
| SAIC / Science Applications International Corporation | 0.01 | -35.98 | 1.46 | -25.14 | 0.2452 | -0.0016 | |||
| REZI / Resideo Technologies, Inc. | 0.07 | -21.61 | 1.44 | -15.51 | 0.2421 | 0.0261 | |||
| CART / Maplebear Inc. | 0.03 | 3.04 | 1.40 | 14.55 | 0.2358 | 0.0807 | |||
| CHDN / Churchill Downs Incorporated | 0.01 | -42.88 | 1.39 | -53.99 | 0.2332 | -0.1487 | |||
| IWN / iShares Trust - iShares Russell 2000 Value ETF | 0.01 | -74.20 | 1.37 | -75.84 | 0.2308 | -0.4892 | |||
| ARW / Arrow Electronics, Inc. | 0.01 | -39.19 | 1.36 | -33.42 | 0.2285 | -0.0300 | |||
| DEI / Douglas Emmett, Inc. | 0.09 | -42.93 | 1.25 | -53.07 | 0.2101 | -0.1272 | |||
| IDA / IDACORP, Inc. | 0.01 | -63.51 | 1.22 | -63.37 | 0.2056 | -0.1752 | |||
| ITT / ITT Inc. | 0.01 | -21.61 | 1.21 | -16.48 | 0.2040 | 0.0200 | |||
| BLDR / Builders FirstSource, Inc. | 0.01 | 21.77 | 1.14 | -5.73 | 0.1914 | 0.0385 | |||
| HOG / Harley-Davidson, Inc. | 0.05 | -21.61 | 1.12 | -26.34 | 0.1893 | -0.0043 | |||
| RHI / Robert Half Inc. | 0.02 | -51.98 | 1.06 | -62.80 | 0.1789 | -0.1834 | |||
| PEGA / Pegasystems Inc. | 0.01 | -60.79 | 0.99 | -50.96 | 0.1668 | -0.0896 | |||
| ACHC / Acadia Healthcare Company, Inc. | 0.04 | 68.17 | 0.99 | 27.03 | 0.1663 | 0.0676 | |||
| BAH / Booz Allen Hamilton Holding Corporation | 0.01 | 0.98 | 0.1647 | 0.1647 | |||||
| SR / Spire Inc. | 0.01 | -82.99 | 0.90 | -83.36 | 0.1512 | -0.5328 | |||
| MBC / MasterBrand, Inc. | 0.08 | -21.61 | 0.81 | -42.85 | 0.1366 | -0.0435 | |||
| EVO / Evotec SE - Depositary Receipt (Common Stock) | 0.20 | -44.63 | 0.77 | -47.95 | 0.1304 | -0.0583 | |||
| BRSL / Brightstar Lottery PLC | 0.05 | -34.59 | 0.73 | -45.76 | 0.1228 | -0.0477 | |||
| MATX / Matson, Inc. | 0.00 | -100.00 | 0.00 | -100.00 | -0.1884 | ||||
| TBLA / Taboola.com Ltd. | 0.00 | -100.00 | 0.00 | -100.00 | -0.0449 |