Mga Batayang Estadistika
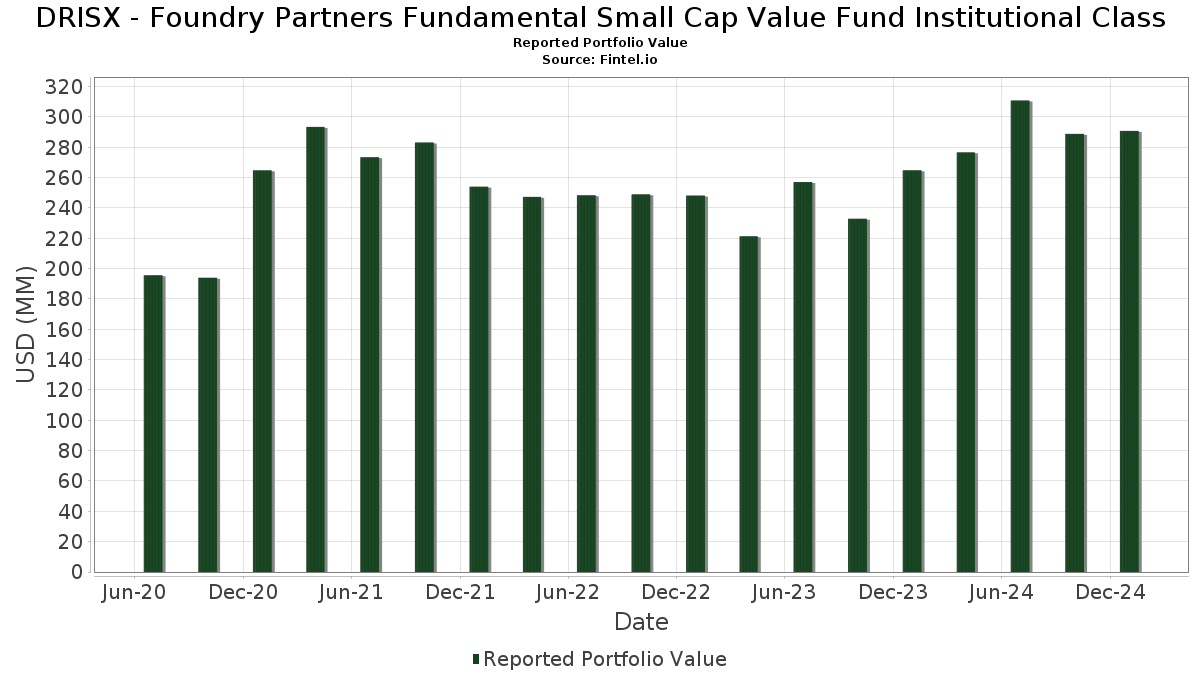
| Nilai Portofolio | $ 290,768,119 |
| Posisi Saat Ini | 75 |
Kepemilikan Terbaru, Kinerja, AUM (dari 13F, 13D)
DRISX - Foundry Partners Fundamental Small Cap Value Fund Institutional Class telah mengungkapkan total kepemilikan 75 dalam pengajuan SEC terbaru mereka. Nilai portofolio terbaru dihitung sebesar $ 290,768,119 USD. Aset yang Dikelola (AUM) sebenarnya adalah nilai ini ditambah kas (yang tidak diungkapkan). Aset-aset utama DRISX - Foundry Partners Fundamental Small Cap Value Fund Institutional Class adalah Federated Hermes Money Market Obligations Trust - Federated Hermes Gov Oblig Fd Inst Shs USD (US:GOIXX) , Hancock Whitney Corporation (US:HWC) , Pathward Financial, Inc. (US:CASH) , Avista Corporation (US:AVA) , and Enova International, Inc. (US:ENVA) . Posisi baru DRISX - Foundry Partners Fundamental Small Cap Value Fund Institutional Class meliputi: Federated Hermes Money Market Obligations Trust - Federated Hermes Gov Oblig Fd Inst Shs USD (US:GOIXX) , Kemper Corporation (US:KMPR) , G-III Apparel Group, Ltd. (US:GIII) , Euronet Worldwide, Inc. (US:EEFT) , and Ameris Bancorp (US:ABCB) .
Peningkatan Tertinggi Kuartal Ini
Kami menggunakan perubahan dalam alokasi portofolio karena ini adalah metrik yang paling bermakna. Perubahan dapat disebabkan oleh perdagangan atau perubahan harga saham.
| Keamanan | Saham (MM) |
Nilai (Juta Dolar AS) |
Portfolio % | ΔPorsyento ng Portfolio |
|---|---|---|---|---|
| 10.51 | 3.6144 | 2.1521 | ||
| 0.06 | 3.92 | 1.3498 | 1.3498 | |
| 0.14 | 8.53 | 2.9326 | 1.3491 | |
| 0.11 | 3.30 | 1.1361 | 1.1361 | |
| 0.03 | 3.14 | 1.0802 | 1.0802 | |
| 0.04 | 2.90 | 0.9960 | 0.9960 | |
| 0.14 | 6.19 | 2.1288 | 0.8856 | |
| 0.11 | 8.48 | 2.9180 | 0.7818 | |
| 0.30 | 5.00 | 1.7198 | 0.7693 | |
| 0.28 | 5.64 | 1.9388 | 0.7520 |
Penurunan Tertinggi Kuartal Ini
Kami menggunakan perubahan dalam alokasi portofolio karena ini adalah metrik yang paling bermakna. Perubahan dapat disebabkan oleh perdagangan atau perubahan harga saham.
| Keamanan | Saham (MM) |
Nilai (Juta Dolar AS) |
Portfolio % | ΔPorsyento ng Portfolio |
|---|---|---|---|---|
| 0.00 | 0.00 | -1.6828 | ||
| 0.04 | 4.63 | 1.5922 | -1.0455 | |
| 0.18 | 3.84 | 1.3202 | -0.9704 | |
| 0.03 | 2.78 | 0.9551 | -0.9340 | |
| 0.00 | 0.00 | -0.8569 | ||
| 0.11 | 1.17 | 0.4041 | -0.8304 | |
| 0.12 | 1.42 | 0.4897 | -0.6121 | |
| 0.15 | 2.99 | 1.0274 | -0.6030 | |
| 0.04 | 1.50 | 0.5164 | -0.5802 | |
| 0.13 | 1.37 | 0.4727 | -0.5551 |
Pengajuan 13F dan Dana
Formulir ini diajukan pada 2025-03-31 untuk periode pelaporan 2025-01-31. Klik ikon tautan untuk melihat riwayat transaksi selengkapnya.
Tingkatkan ke versi premium untuk membuka data premium dan ekspor ke Excel. ![]() .
.
| Keamanan | Ketik | Harga Saham Rata-rata | Saham (MM) |
ΔSaham (%) |
ΔSaham (%) |
Nilai ($MM) |
Portpolyo (%) |
ΔPortofolio (%) |
|
|---|---|---|---|---|---|---|---|---|---|
| GOIXX / Federated Hermes Money Market Obligations Trust - Federated Hermes Gov Oblig Fd Inst Shs USD | 10.51 | 149.04 | 3.6144 | 2.1521 | |||||
| HWC / Hancock Whitney Corporation | 0.14 | 62.66 | 8.53 | 86.58 | 2.9326 | 1.3491 | |||
| CASH / Pathward Financial, Inc. | 0.11 | 22.13 | 8.48 | 37.62 | 2.9180 | 0.7818 | |||
| AVA / Avista Corporation | 0.20 | 14.52 | 7.23 | 11.89 | 2.4856 | 0.2475 | |||
| ENVA / Enova International, Inc. | 0.06 | -17.40 | 7.03 | 6.75 | 2.4170 | 0.1359 | |||
| CUZ / Cousins Properties Incorporated | 0.23 | 14.52 | 6.98 | 14.15 | 2.3996 | 0.2816 | |||
| IBOC / International Bancshares Corporation | 0.10 | 5.05 | 6.86 | 13.00 | 2.3583 | 0.2555 | |||
| US71880K1016 / Phinia Inc | 0.13 | 14.52 | 6.64 | 25.11 | 2.2832 | 0.4447 | |||
| UGI / UGI Corporation | 0.21 | -17.75 | 6.43 | 5.71 | 2.2107 | 0.1038 | |||
| OFG / OFG Bancorp | 0.14 | 62.66 | 6.19 | 72.51 | 2.1288 | 0.8856 | |||
| EFSC / Enterprise Financial Services Corp | 0.10 | 22.13 | 5.96 | 38.63 | 2.0518 | 0.5607 | |||
| PENG / Penguin Solutions, Inc. | 0.28 | 22.14 | 5.64 | 64.60 | 1.9388 | 0.7520 | |||
| CATY / Cathay General Bancorp | 0.12 | 1.24 | 5.56 | 4.57 | 1.9120 | 0.0698 | |||
| RNG / RingCentral, Inc. | 0.16 | -16.49 | 5.41 | -19.25 | 1.8621 | -0.4611 | |||
| AHCO / AdaptHealth Corp. | 0.49 | 3.54 | 5.31 | 8.87 | 1.8275 | 0.1364 | |||
| HOV / Hovnanian Enterprises, Inc. | 0.04 | 14.51 | 5.31 | -13.89 | 1.8251 | -0.3101 | |||
| APLE / Apple Hospitality REIT, Inc. | 0.34 | 14.52 | 5.28 | 19.71 | 1.8157 | 0.2876 | |||
| SNEX / StoneX Group Inc. | 0.05 | 10.25 | 5.23 | 34.13 | 1.7980 | 0.4473 | |||
| PK / Park Hotels & Resorts Inc. | 0.39 | -11.23 | 5.20 | -13.80 | 1.7886 | -0.3014 | |||
| DAKT / Daktronics, Inc. | 0.30 | 44.74 | 5.00 | 82.31 | 1.7198 | 0.7693 | |||
| KN / Knowles Corporation | 0.26 | 32.56 | 4.84 | 44.89 | 1.6634 | 0.5067 | |||
| BDC / Belden Inc. | 0.04 | -40.54 | 4.63 | -39.19 | 1.5922 | -1.0455 | |||
| SM / SM Energy Company | 0.12 | 14.70 | 4.37 | 3.75 | 1.5029 | 0.0433 | |||
| NXRT / NexPoint Residential Trust, Inc. | 0.11 | 14.51 | 4.32 | 8.55 | 1.4849 | 0.1067 | |||
| POR / Portland General Electric Company | 0.10 | 14.52 | 4.28 | -0.60 | 1.4735 | -0.0201 | |||
| MTX / Minerals Technologies Inc. | 0.06 | 14.52 | 4.27 | 16.66 | 1.4692 | 0.2002 | |||
| AVT / Avnet, Inc. | 0.08 | -0.15 | 4.25 | 35.36 | 1.4616 | 0.3513 | |||
| PSFE / Paysafe Limited | 0.21 | 28.83 | 4.02 | 17.66 | 1.3844 | 0.1991 | |||
| VRN / Veren Inc. | 0.79 | 14.69 | 3.97 | 11.81 | 1.3644 | 0.1349 | |||
| WTTR / Select Water Solutions, Inc. | 0.32 | -12.32 | 3.95 | 3.38 | 1.3573 | 0.0348 | |||
| FIHL / Fidelis Insurance Holdings Limited | 0.24 | 28.35 | 3.94 | 22.70 | 1.3539 | 0.2422 | |||
| KMPR / Kemper Corporation | 0.06 | 3.92 | 1.3498 | 1.3498 | |||||
| OGN / Organon & Co. | 0.25 | -0.08 | 3.90 | -17.22 | 1.3417 | -0.2910 | |||
| AGI / Alamos Gold Inc. | 0.18 | -44.02 | 3.84 | -41.94 | 1.3202 | -0.9704 | |||
| MUR / Murphy Oil Corporation | 0.14 | 14.70 | 3.70 | -2.99 | 1.2737 | -0.0489 | |||
| NWN / Northwest Natural Holding Company | 0.09 | 14.52 | 3.67 | 17.54 | 1.2632 | 0.1806 | |||
| PAAS / Pan American Silver Corp. | 0.15 | -28.70 | 3.51 | -29.31 | 1.2089 | -0.5140 | |||
| VMI / Valmont Industries, Inc. | 0.01 | 14.69 | 3.43 | 22.10 | 1.1786 | 0.2060 | |||
| US57638P1049 / MasterBrand, Inc. | 0.19 | 14.70 | 3.33 | 10.62 | 1.1461 | 0.1022 | |||
| GIII / G-III Apparel Group, Ltd. | 0.11 | 3.30 | 1.1361 | 1.1361 | |||||
| MRC / MRC Global Inc. | 0.22 | 3.54 | 3.18 | 24.00 | 1.0929 | 0.2048 | |||
| DNOW / DNOW Inc. | 0.21 | 3.54 | 3.14 | 30.27 | 1.0808 | 0.2447 | |||
| EEFT / Euronet Worldwide, Inc. | 0.03 | 3.14 | 1.0802 | 1.0802 | |||||
| REVG / REV Group, Inc. | 0.09 | 3.54 | 3.09 | 35.60 | 1.0612 | 0.2726 | |||
| SEM / Select Medical Holdings Corporation | 0.15 | 3.54 | 2.99 | -36.52 | 1.0274 | -0.6030 | |||
| HRI / Herc Holdings Inc. | 0.01 | -25.18 | 2.94 | -27.04 | 1.0108 | -0.3849 | |||
| ABM / ABM Industries Incorporated | 0.05 | 14.69 | 2.91 | 15.33 | 1.0014 | 0.1267 | |||
| ABCB / Ameris Bancorp | 0.04 | 2.90 | 0.9960 | 0.9960 | |||||
| CVLG / Covenant Logistics Group, Inc. | 0.10 | 107.08 | 2.83 | 13.41 | 0.9752 | 0.1088 | |||
| PEGA / Pegasystems Inc. | 0.03 | -62.63 | 2.78 | -49.07 | 0.9551 | -0.9340 | |||
| CPA / Copa Holdings, S.A. | 0.03 | 3.54 | 2.76 | -0.83 | 0.9503 | -0.0148 | |||
| OEC / Orion S.A. | 0.20 | 14.52 | 2.75 | 6.56 | 0.9448 | 0.0516 | |||
| ENS / EnerSys | 0.03 | 4.42 | 2.59 | 4.65 | 0.8912 | 0.0332 | |||
| TKR / The Timken Company | 0.03 | 3.54 | 2.58 | 0.16 | 0.8889 | -0.0055 | |||
| TEX / Terex Corporation | 0.05 | 14.70 | 2.54 | 6.68 | 0.8740 | 0.0485 | |||
| MAN / ManpowerGroup Inc. | 0.04 | 14.69 | 2.50 | 9.88 | 0.8613 | 0.0717 | |||
| YOU / Clear Secure, Inc. | 0.10 | 22.13 | 2.46 | -21.41 | 0.8465 | -0.2385 | |||
| HY / Hyster-Yale, Inc. | 0.04 | 3.54 | 2.39 | -12.87 | 0.8220 | -0.1283 | |||
| GTES / Gates Industrial Corporation plc | 0.11 | -25.54 | 2.34 | -20.41 | 0.8052 | -0.2138 | |||
| TILE / Interface, Inc. | 0.09 | -33.78 | 2.34 | -6.14 | 0.8042 | -0.0591 | |||
| GSL / Global Ship Lease, Inc. | 0.11 | 14.69 | 2.32 | 3.75 | 0.7997 | 0.0233 | |||
| PRIM / Primoris Services Corporation | 0.03 | -37.54 | 2.30 | -23.42 | 0.7909 | -0.2497 | |||
| AMWD / American Woodmark Corporation | 0.03 | 14.70 | 2.25 | -1.53 | 0.7734 | -0.0180 | |||
| HCSG / Healthcare Services Group, Inc. | 0.20 | 3.54 | 2.21 | 4.70 | 0.7588 | 0.0285 | |||
| EGY / VAALCO Energy, Inc. | 0.52 | 14.70 | 2.15 | -11.96 | 0.7398 | -0.1066 | |||
| REZI / Resideo Technologies, Inc. | 0.09 | -33.16 | 2.08 | -23.47 | 0.7145 | -0.2262 | |||
| CMRE / Costamare Inc. | 0.17 | 3.54 | 1.94 | -11.31 | 0.6689 | -0.0908 | |||
| WS / Worthington Steel, Inc. | 0.06 | 67.58 | 1.85 | 27.34 | 0.6361 | 0.1327 | |||
| APOG / Apogee Enterprises, Inc. | 0.03 | -15.34 | 1.62 | -42.29 | 0.5573 | -0.4156 | |||
| NX / Quanex Building Products Corporation | 0.08 | 3.54 | 1.62 | -25.20 | 0.5569 | -0.1930 | |||
| SIGA / SIGA Technologies, Inc. | 0.27 | 3.54 | 1.61 | -14.25 | 0.5549 | -0.0970 | |||
| TNK / Teekay Tankers Ltd. | 0.04 | -46.04 | 1.50 | -52.56 | 0.5164 | -0.5802 | |||
| ASC / Ardmore Shipping Corporation | 0.12 | -46.77 | 1.42 | -55.24 | 0.4897 | -0.6121 | |||
| EVH / Evolent Health, Inc. | 0.13 | 3.54 | 1.37 | -53.66 | 0.4727 | -0.5551 | |||
| EURN / Euronav NV | 0.11 | -57.49 | 1.17 | -67.04 | 0.4041 | -0.8304 | |||
| WU / The Western Union Company | 0.00 | -100.00 | 0.00 | -100.00 | -1.6828 | ||||
| OSK / Oshkosh Corporation | 0.00 | -100.00 | 0.00 | -100.00 | -0.8569 |