Mga Batayang Estadistika
| Manajer | Andreas Halvorsen, David Ott |
| Profil Orang Dalam | VIKING GLOBAL INVESTORS LP |
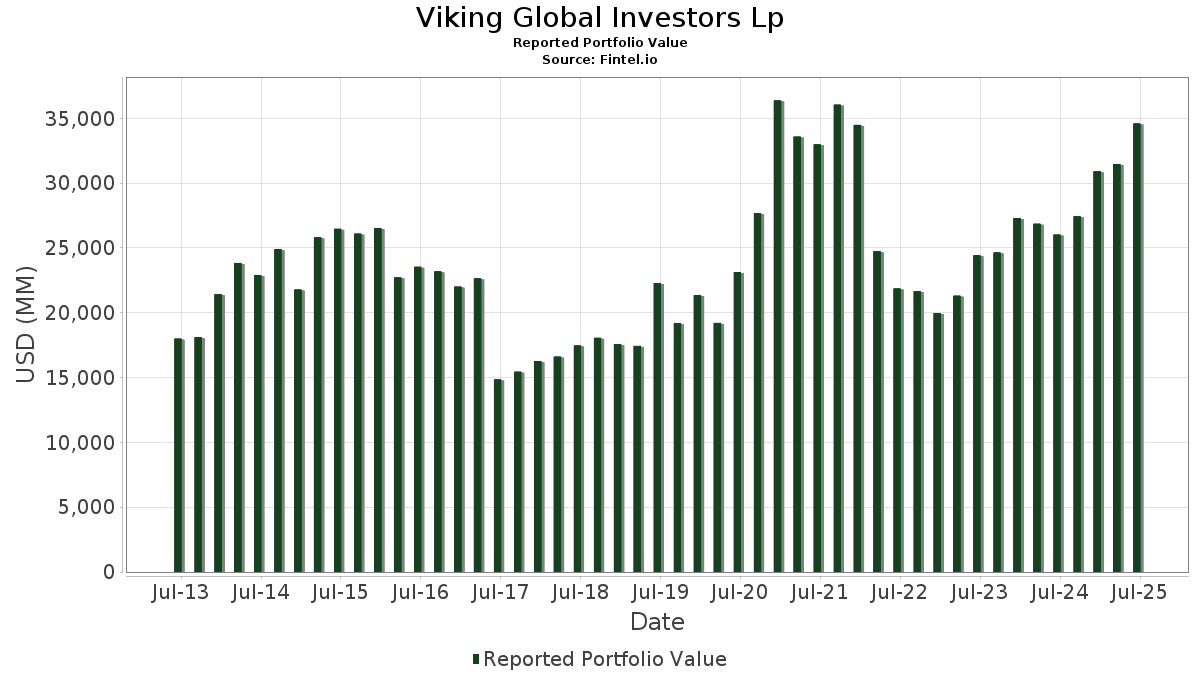
| Nilai Portofolio | $ 34,589,864,590 |
| Posisi Saat Ini | 83 |
Kepemilikan Terbaru, Kinerja, AUM (dari 13F, 13D)
Viking Global Investors Lp telah mengungkapkan total kepemilikan 83 dalam pengajuan SEC terbaru mereka. Manajer portofolio tercantum sebagai Andreas Halvorsen, David Ott. Nilai portofolio terbaru dihitung sebesar $ 34,589,864,590 USD. Aset yang Dikelola (AUM) sebenarnya adalah nilai ini ditambah kas (yang tidak diungkapkan). Aset-aset utama Viking Global Investors Lp adalah Bank of America Corporation (US:BAC) , The Charles Schwab Corporation (US:SCHW) , Capital One Financial Corporation (US:COF) , JPMorgan Chase & Co. (US:JPM) , and U.S. Bancorp (US:USB) . Posisi baru Viking Global Investors Lp meliputi: The PNC Financial Services Group, Inc. (US:PNC) , Ralliant Corporation (US:RAL) , Saia, Inc. (US:SAIA) , BlackRock, Inc. (US:BLK) , and The Trade Desk, Inc. (US:TTD) . Industri unggulan Viking Global Investors Lp adalah "Agricultural Services" (sic 07) , "Coal Mining" (sic 12) , and "Food And Kindred Products" (sic 20) .
Peningkatan Tertinggi Kuartal Ini
Kami menggunakan perubahan dalam alokasi portofolio karena ini adalah metrik yang paling bermakna. Perubahan dapat disebabkan oleh perdagangan atau perubahan harga saham.
| Keamanan | Saham (MM) |
Nilai (Juta Dolar AS) |
Portfolio % | ΔPorsyento ng Portfolio |
|---|---|---|---|---|
| 5.85 | 725.22 | 2.0966 | 2.0966 | |
| 2.15 | 607.60 | 1.7566 | 1.7566 | |
| 4.04 | 1,171.83 | 3.3878 | 1.6954 | |
| 3.13 | 913.16 | 2.6400 | 1.4983 | |
| 2.91 | 574.35 | 1.6605 | 1.3664 | |
| 2.38 | 442.87 | 1.2803 | 1.2803 | |
| 2.80 | 618.22 | 1.7873 | 1.2074 | |
| 19.60 | 580.61 | 1.6786 | 1.1122 | |
| 5.42 | 368.21 | 1.0645 | 1.0645 | |
| 0.42 | 325.00 | 0.9396 | 0.9396 |
Penurunan Tertinggi Kuartal Ini
Kami menggunakan perubahan dalam alokasi portofolio karena ini adalah metrik yang paling bermakna. Perubahan dapat disebabkan oleh perdagangan atau perubahan harga saham.
| Keamanan | Saham (MM) |
Nilai (Juta Dolar AS) |
Portfolio % | ΔPorsyento ng Portfolio |
|---|---|---|---|---|
| 0.27 | 195.96 | 0.5665 | -2.1184 | |
| 24.09 | 1,090.05 | 3.1513 | -1.5250 | |
| 2.60 | 93.59 | 0.2706 | -0.7742 | |
| 11.54 | 588.99 | 1.7028 | -0.7441 | |
| 1.62 | 575.44 | 1.6636 | -0.7025 | |
| 1.08 | 363.23 | 1.0501 | -0.6463 | |
| 15.91 | 829.53 | 2.3982 | -0.6127 | |
| 3.68 | 581.71 | 1.6817 | -0.5712 | |
| 12.29 | 675.50 | 1.9529 | -0.4726 | |
| 34.24 | 385.86 | 1.1155 | -0.3595 |
Pengajuan 13D/G
Ini adalah daftar pengajuan 13D dan 13G yang dibuat dalam setahun terakhir (jika ada). Klik ikon tautan untuk melihat riwayat transaksi lengkap. Baris berwarna hijau menunjukkan posisi baru. Baris berwarna merah menunjukkan posisi yang sudah ditutup.
| Tanggal File | Formulir | Keamanan | Sebelumnya Saham |
Saat ini Saham |
ΔPersentase Saham | % Kepemilikan |
% ΔKepemilikan | |
|---|---|---|---|---|---|---|---|---|
| 2025-08-14 | APG / APi Group Corporation | 21,537,518 | 11,537,518 | -46.43 | 2.80 | -64.10 | ||
| 2025-08-14 | RRX / Regal Rexnord Corporation | 3,546,112 | 3,430,128 | -3.27 | 5.20 | -1.89 | ||
| 2025-08-14 | ROIV / Roivant Sciences Ltd. | 46,013,752 | 34,237,779 | -25.59 | 5.02 | -21.56 | ||
| 2025-08-14 | BMRN / BioMarin Pharmaceutical Inc. | 9,753,293 | 12,288,611 | 25.99 | 6.40 | 25.49 | ||
| 2025-08-14 | ORIC / ORIC Pharmaceuticals, Inc. | 6,572,700 | 8,729,345 | 32.81 | 9.99 | 8.59 | ||
| 2025-08-14 | TRVI / Trevi Therapeutics, Inc. | 9,190,486 | 7,505,694 | -18.33 | 5.90 | -32.18 | ||
| 2025-08-14 | BBIO / BridgeBio Pharma, Inc. | 18,602,920 | 18,602,920 | 0.00 | 9.70 | -1.02 | ||
| 2025-07-24 | FTV / Fortive Corporation | 17,049,178 | 5.02 | |||||
| 2025-06-18 | PRMB / Primo Brands Corporation | 19,602,116 | 5.30 | |||||
| 2025-05-15 | / (G0093S109) | 34,360,000 | 28.30 | |||||
| 2025-03-12 | CZOOF / Cazoo Group Ltd | 2,142,728 | 2,142,728 | 0.00 | 43.80 | 0.00 | ||
| 2025-02-14 | NAMS / NewAmsterdam Pharma Company N.V. | 8,024,565 | 6,978,534 | -13.04 | 6.50 | -32.99 | ||
| 2025-02-14 | LBPH / Longboard Pharmaceuticals, Inc. | 1,752,656 | 0 | -100.00 | 0.00 | -100.00 | ||
| 2025-02-14 | SION / Sionna Therapeutics, Inc. | 2,952,754 | 6.70 | |||||
| 2024-11-14 | DNA / Ginkgo Bioworks Holdings, Inc. | 143,085,126 | 3,577,128 | -97.50 | 8.30 | -5.68 | ||
| 2024-11-14 | EWTX / Edgewise Therapeutics, Inc. | 6,159,146 | 1,481,146 | -75.95 | 1.60 | -83.51 | ||
| 2024-11-14 | VKTX / Viking Therapeutics, Inc. | 5,145,112 | 721,926 | -85.97 | 0.60 | -88.24 | ||
| 2024-11-14 | FDMT / 4D Molecular Therapeutics, Inc. | 4,247,914 | 0 | -100.00 | 0.00 | -100.00 | ||
| 2024-11-14 | VSTM / Verastem, Inc. | 2,531,829 | 0 | -100.00 | 0.00 | -100.00 | ||
| 2024-11-14 | PEPG / PepGen Inc. | 1,482,434 | 1,482,434 | 0.00 | 4.50 | -27.42 | ||
| 2024-11-14 | TRML / Tourmaline Bio, Inc. | 0 | 0.00 |
Pengajuan 13F dan Dana
Formulir ini diajukan pada 2025-08-14 untuk periode pelaporan 2025-06-30. Klik ikon tautan untuk melihat riwayat transaksi selengkapnya.
Tingkatkan ke versi premium untuk membuka data premium dan ekspor ke Excel. ![]() .
.
| Keamanan | Ketik | Harga Saham Rata-rata | Saham (MM) |
ΔSaham (%) |
ΔSaham (%) |
Nilai ($MM) |
Portpolyo (%) |
ΔPortofolio (%) |
|
|---|---|---|---|---|---|---|---|---|---|
| BAC / Bank of America Corporation | 31.25 | -2.96 | 1,478.61 | 10.04 | 4.2747 | 0.0058 | |||
| SCHW / The Charles Schwab Corporation | 15.77 | -10.97 | 1,439.15 | 3.77 | 4.1606 | -0.2455 | |||
| COF / Capital One Financial Corporation | 5.67 | 23.53 | 1,206.64 | 46.58 | 3.4884 | 0.8731 | |||
| JPM / JPMorgan Chase & Co. | 4.04 | 86.13 | 1,171.83 | 119.98 | 3.3878 | 1.6954 | |||
| USB / U.S. Bancorp | 24.09 | -30.90 | 1,090.05 | -25.94 | 3.1513 | -1.5250 | |||
| TSM / Taiwan Semiconductor Manufacturing Company Limited - Depositary Receipt (Common Stock) | 4.33 | -11.45 | 980.54 | 20.81 | 2.8348 | 0.2562 | |||
| MCD / McDonald's Corporation | 3.13 | 171.67 | 913.16 | 154.11 | 2.6400 | 1.4983 | |||
| AMZN / Amazon.com, Inc. | 3.90 | 43.19 | 854.98 | 65.11 | 2.4718 | 0.8266 | |||
| FTV / Fortive Corporation | 15.91 | 22.88 | 829.53 | -12.47 | 2.3982 | -0.6127 | |||
| BBIO / BridgeBio Pharma, Inc. | 18.56 | -15.87 | 801.22 | 5.08 | 2.3163 | -0.1060 | |||
| DIS / The Walt Disney Company | 5.85 | 725.22 | 2.0966 | 2.0966 | |||||
| HCA / HCA Healthcare, Inc. | 1.87 | 58.47 | 717.21 | 75.69 | 2.0735 | 0.7766 | |||
| TMUS / T-Mobile US, Inc. | 2.85 | 81.71 | 677.92 | 62.32 | 1.9599 | 0.6330 | |||
| BMRN / BioMarin Pharmaceutical Inc. | 12.29 | 13.78 | 675.50 | -11.52 | 1.9529 | -0.4726 | |||
| SHW / The Sherwin-Williams Company | 1.96 | 101.37 | 672.21 | 98.01 | 1.9434 | 0.8648 | |||
| FLUT / Flutter Entertainment plc | 2.28 | -10.54 | 652.93 | 15.38 | 1.8876 | 0.0898 | |||
| GM / General Motors Company | 13.02 | 81.10 | 640.66 | 89.49 | 1.8522 | 0.7780 | |||
| PM / Philip Morris International Inc. | 3.45 | 7.49 | 629.11 | 23.34 | 1.8188 | 0.1983 | |||
| COR / Cencora, Inc. | 2.08 | 94.95 | 624.21 | 110.21 | 1.8046 | 0.8612 | |||
| AMT / American Tower Corporation | 2.80 | 233.47 | 618.22 | 238.71 | 1.7873 | 1.2074 | |||
| CSX / CSX Corporation | 18.87 | 10.56 | 615.79 | 22.59 | 1.7803 | 0.1843 | |||
| APD / Air Products and Chemicals, Inc. | 2.15 | 607.60 | 1.7566 | 1.7566 | |||||
| ROST / Ross Stores, Inc. | 4.75 | 9.87 | 605.70 | 9.69 | 1.7511 | -0.0033 | |||
| BA / The Boeing Company | 2.84 | -12.26 | 594.03 | 7.79 | 1.7174 | -0.0335 | |||
| APG / APi Group Corporation | 11.54 | -46.43 | 588.99 | -23.53 | 1.7028 | -0.7441 | |||
| NVDA / NVIDIA Corporation | 3.68 | -43.73 | 581.71 | -17.97 | 1.6817 | -0.5712 | |||
| PRMB / Primo Brands Corporation | 19.60 | 290.21 | 580.61 | 225.67 | 1.6786 | 1.1122 | |||
| V / Visa Inc. | 1.62 | -23.73 | 575.44 | -22.74 | 1.6636 | -0.7025 | |||
| DHR / Danaher Corporation | 2.91 | 543.94 | 574.35 | 520.51 | 1.6605 | 1.3664 | |||
| SE / Sea Limited - Depositary Receipt (Common Stock) | 3.54 | -14.98 | 565.71 | 4.21 | 1.6355 | -0.0892 | |||
| QCOM / QUALCOMM Incorporated | 3.15 | 120.12 | 502.13 | 128.22 | 1.4517 | 0.7526 | |||
| RRX / Regal Rexnord Corporation | 3.43 | 25.69 | 497.23 | 60.04 | 1.4375 | 0.4504 | |||
| NKE / NIKE, Inc. | 6.97 | 25.61 | 494.95 | 40.57 | 1.4309 | 0.3123 | |||
| PNC / The PNC Financial Services Group, Inc. | 2.38 | 442.87 | 1.2803 | 1.2803 | |||||
| ROIV / Roivant Sciences Ltd. | 34.24 | -25.59 | 385.86 | -16.89 | 1.1155 | -0.3595 | |||
| TIC / Acuren Corporation | 34.36 | 0.00 | 379.33 | -0.72 | 1.0967 | -0.1172 | |||
| FSLR / First Solar, Inc. | 2.27 | 60.58 | 375.12 | 110.26 | 1.0845 | 0.5177 | |||
| CCL / Carnival Corporation & plc | 13.21 | 6.43 | 371.39 | 53.25 | 1.0737 | 0.3038 | |||
| XYZ / Block, Inc. | 5.42 | 368.21 | 1.0645 | 1.0645 | |||||
| DHI / D.R. Horton, Inc. | 2.83 | 108.32 | 364.46 | 111.25 | 1.0537 | 0.5056 | |||
| CVNA / Carvana Co. | 1.08 | -57.79 | 363.23 | -31.97 | 1.0501 | -0.6463 | |||
| RACE / Ferrari N.V. | 0.72 | 432.71 | 353.53 | 515.70 | 1.0221 | 0.8396 | |||
| TSLA / Tesla, Inc. | 1.10 | 214.30 | 349.53 | 285.26 | 1.0105 | 0.7223 | |||
| ADPT / Adaptive Biotechnologies Corporation | 29.99 | 0.00 | 349.43 | 56.80 | 1.0102 | 0.3022 | |||
| BSX / Boston Scientific Corporation | 3.05 | 28.15 | 327.15 | 36.44 | 0.9458 | 0.1840 | |||
| LLY / Eli Lilly and Company | 0.42 | 325.00 | 0.9396 | 0.9396 | |||||
| CMG / Chipotle Mexican Grill, Inc. | 5.69 | -5.30 | 319.41 | 5.91 | 0.9234 | -0.0347 | |||
| CPT / Camden Property Trust | 2.72 | -2.61 | 306.07 | -10.26 | 0.8849 | -0.1987 | |||
| LEN / Lennar Corporation | 2.52 | 86.72 | 279.13 | 79.94 | 0.8070 | 0.3141 | |||
| AMD / Advanced Micro Devices, Inc. | 1.91 | 271.11 | 0.7838 | 0.7838 | |||||
| CSGP / CoStar Group, Inc. | 3.22 | 258.77 | 0.7481 | 0.7481 | |||||
| RAL / Ralliant Corporation | 5.30 | 257.20 | 0.7436 | 0.7436 | |||||
| AJG / Arthur J. Gallagher & Co. | 0.73 | 8.89 | 232.34 | 0.97 | 0.6717 | -0.0594 | |||
| SAIA / Saia, Inc. | 0.83 | 226.77 | 0.6556 | 0.6556 | |||||
| BLK / BlackRock, Inc. | 0.20 | 204.71 | 0.5918 | 0.5918 | |||||
| META / Meta Platforms, Inc. | 0.27 | -81.89 | 195.96 | -76.81 | 0.5665 | -2.1184 | |||
| TEVA / Teva Pharmaceutical Industries Limited - Depositary Receipt (Common Stock) | 11.68 | 15.37 | 195.78 | 25.80 | 0.5660 | 0.0716 | |||
| TTD / The Trade Desk, Inc. | 2.67 | 192.52 | 0.5566 | 0.5566 | |||||
| CART / Maplebear Inc. | 3.75 | 169.78 | 0.4908 | 0.4908 | |||||
| CME / CME Group Inc. | 0.60 | 164.65 | 0.4760 | 0.4760 | |||||
| ITGR / Integer Holdings Corporation | 1.28 | 9.06 | 157.89 | 13.65 | 0.4565 | 0.0151 | |||
| AIG / American International Group, Inc. | 1.82 | 155.41 | 0.4493 | 0.4493 | |||||
| JCI / Johnson Controls International plc | 1.45 | 153.23 | 0.4430 | 0.4430 | |||||
| AS / Amer Sports, Inc. | 3.88 | 64.83 | 150.41 | 139.01 | 0.4348 | 0.2349 | |||
| APP / AppLovin Corporation | 0.37 | 172.06 | 130.57 | 259.45 | 0.3775 | 0.2621 | |||
| MASI / Masimo Corporation | 0.77 | 129.10 | 0.3732 | 0.3732 | |||||
| NAMS / NewAmsterdam Pharma Company N.V. | 6.98 | 0.00 | 126.38 | -11.53 | 0.3654 | -0.0885 | |||
| RYAN / Ryan Specialty Holdings, Inc. | 1.41 | 47.80 | 96.05 | 36.03 | 0.2777 | 0.0534 | |||
| RPRX / Royalty Pharma plc | 2.60 | -75.41 | 93.59 | -71.54 | 0.2706 | -0.7742 | |||
| UBS / UBS Group AG | 2.58 | 87.32 | 0.2524 | 0.2524 | |||||
| MOH / Molina Healthcare, Inc. | 0.27 | 79.66 | 0.2303 | 0.2303 | |||||
| LAB / Standard BioTools Inc. | 58.65 | 0.00 | 70.38 | 11.11 | 0.2035 | 0.0022 | |||
| ORIC / ORIC Pharmaceuticals, Inc. | 6.57 | 0.00 | 66.71 | 81.90 | 0.1929 | 0.0763 | |||
| PHVS / Pharvaris N.V. | 3.65 | 0.00 | 64.30 | 12.10 | 0.1859 | 0.0037 | |||
| SION / Sionna Therapeutics, Inc. | 3.20 | 8.21 | 55.44 | 79.49 | 0.1603 | 0.0621 | |||
| MTSR / Metsera, Inc. | 1.62 | 0.00 | 45.99 | 4.52 | 0.1330 | -0.0068 | |||
| DNA / Ginkgo Bioworks Holdings, Inc. | 3.58 | 0.00 | 40.24 | 97.37 | 0.1163 | 0.0516 | |||
| INBX / Inhibrx Biosciences, Inc. | 1.79 | 0.00 | 25.51 | 2.00 | 0.0738 | -0.0057 | |||
| HQY / HealthEquity, Inc. | 0.22 | 23.02 | 0.0666 | 0.0666 | |||||
| ESTA / Establishment Labs Holdings Inc. | 0.34 | 14.67 | 0.0424 | 0.0424 | |||||
| TRVI / Trevi Therapeutics, Inc. | 1.54 | -52.20 | 8.44 | -58.43 | 0.0244 | -0.0401 | |||
| PEPG / PepGen Inc. | 1.48 | 0.00 | 1.65 | -20.99 | 0.0048 | -0.0019 | |||
| RLYB / Rallybio Corporation | 4.19 | 0.00 | 1.42 | -48.38 | 0.0041 | -0.0046 | |||
| MNST / Monster Beverage Corporation | 0.00 | -100.00 | 0.00 | 0.0000 | |||||
| ADSK / Autodesk, Inc. | 0.00 | -100.00 | 0.00 | 0.0000 | |||||
| LI / Li Auto Inc. - Depositary Receipt (Common Stock) | 0.00 | -100.00 | 0.00 | 0.0000 | |||||
| SAIL / SailPoint, Inc. | 0.00 | -100.00 | 0.00 | 0.0000 | |||||
| NFLX / Netflix, Inc. | 0.00 | -100.00 | 0.00 | 0.0000 | |||||
| SNPS / Synopsys, Inc. | 0.00 | -100.00 | 0.00 | 0.0000 | |||||
| ICE / Intercontinental Exchange, Inc. | 0.00 | -100.00 | 0.00 | 0.0000 | |||||
| SPOT / Spotify Technology S.A. | 0.00 | -100.00 | 0.00 | 0.0000 | |||||
| DB / Deutsche Bank Aktiengesellschaft | 0.00 | -100.00 | 0.00 | 0.0000 | |||||
| SKX / Skechers U.S.A., Inc. | 0.00 | -100.00 | 0.00 | 0.0000 | |||||
| EQH / Equitable Holdings, Inc. | 0.00 | -100.00 | 0.00 | 0.0000 | |||||
| IMVT / Immunovant, Inc. | 0.00 | -100.00 | 0.00 | 0.0000 | |||||
| MAA / Mid-America Apartment Communities, Inc. | 0.00 | -100.00 | 0.00 | 0.0000 | |||||
| MTB / M&T Bank Corporation | 0.00 | -100.00 | 0.00 | 0.0000 | |||||
| DASH / DoorDash, Inc. | 0.00 | -100.00 | 0.00 | 0.0000 | |||||
| MET / MetLife, Inc. | 0.00 | -100.00 | 0.00 | 0.0000 | |||||
| EWTX / Edgewise Therapeutics, Inc. | 0.00 | -100.00 | 0.00 | 0.0000 | |||||
| INTU / Intuit Inc. | 0.00 | -100.00 | 0.00 | 0.0000 | |||||
| TWLO / Twilio Inc. | 0.00 | -100.00 | 0.00 | 0.0000 | |||||
| BNTX / BioNTech SE - Depositary Receipt (Common Stock) | 0.00 | -100.00 | 0.00 | 0.0000 | |||||
| TVTX / Travere Therapeutics, Inc. | 0.00 | -100.00 | 0.00 | -100.00 | -0.1481 | ||||
| ALL / The Allstate Corporation | 0.00 | -100.00 | 0.00 | 0.0000 | |||||
| PGR / The Progressive Corporation | 0.00 | -100.00 | 0.00 | 0.0000 | |||||
| TRU / TransUnion | 0.00 | -100.00 | 0.00 | 0.0000 | |||||
| REGN / Regeneron Pharmaceuticals, Inc. | 0.00 | -100.00 | 0.00 | 0.0000 | |||||
| UNH / UnitedHealth Group Incorporated | 0.00 | -100.00 | 0.00 | 0.0000 | |||||
| CB / Chubb Limited | 0.00 | -100.00 | 0.00 | 0.0000 | |||||
| MSFT / Microsoft Corporation | 0.00 | -100.00 | 0.00 | 0.0000 |