Mga Batayang Estadistika
| Pemilik Institusional | 75 total, 75 long only, 0 short only, 0 long/short - change of 47.06% MRQ |
| Alokasi Portofolio Rata-rata | 0.1204 % - change of -17.67% MRQ |
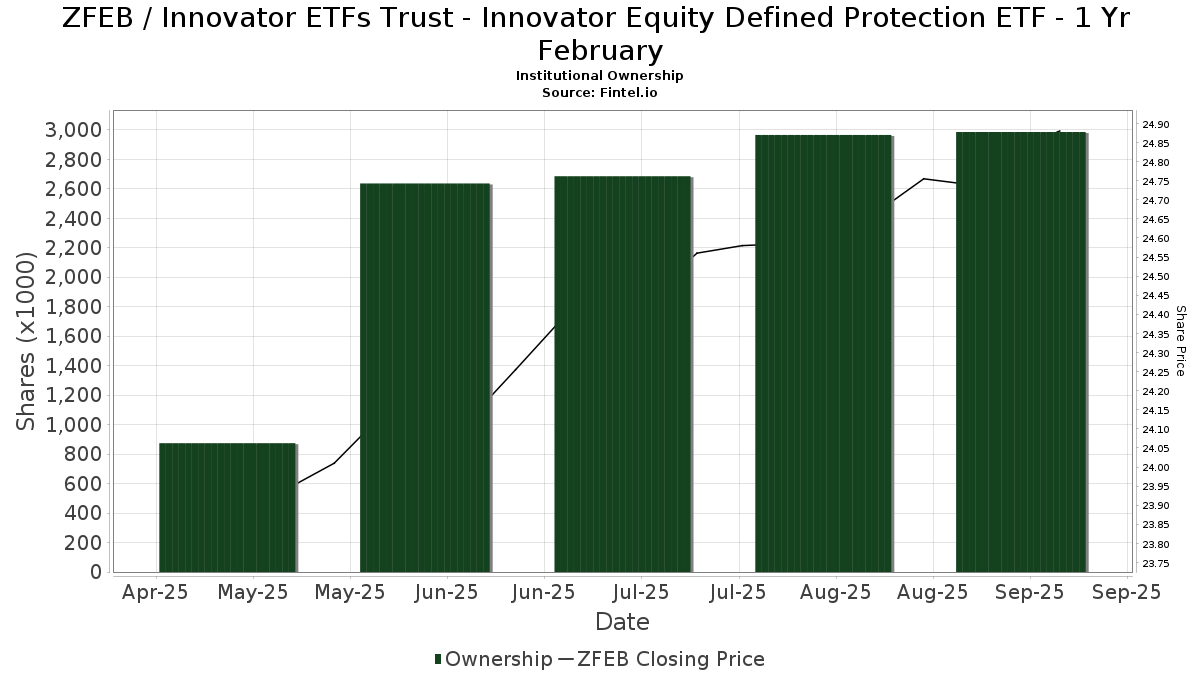
| Saham Institusional (Jangka Panjang) | 2,985,766 (ex 13D/G) - change of 0.35MM shares 13.25% MRQ |
| Nilai Institusional (Jangka Panjang) | $ 63,930 USD ($1000) |
Kepemilikan Institusional dan Pemegang Saham
Innovator ETFs Trust - Innovator Equity Defined Protection ETF - 1 Yr February (US:ZFEB) memiliki 75 pemilik institusional dan pemegang saham yang telah mengajukan formulir 13D/G atau 13F kepada Komisi Bursa Efek (Securities Exchange Commission/SEC). Lembaga-lembaga ini memegang total 2,985,766 saham. Pemegang saham terbesar meliputi BCJ Capital Management, LLC, Commonwealth Equity Services, Llc, NovaPoint Capital, LLC, AE Wealth Management LLC, Raymond James Financial Inc, Harbour Investments, Inc., Prostatis Group LLC, Envestnet Asset Management Inc, Kestra Advisory Services, LLC, and Cambridge Investment Research Advisors, Inc. .
Struktur kepemilikan institusional Innovator ETFs Trust - Innovator Equity Defined Protection ETF - 1 Yr February (BATS:ZFEB) menunjukkan posisi terkini di perusahaan oleh institusi dan dana, serta perubahan terbaru dalam ukuran posisi. Pemegang saham utama dapat mencakup investor individu, reksa dana, dana lindung nilai, atau institusi. Jadwal 13D menunjukkan bahwa investor memegang (atau pernah memegang) lebih dari 5% saham perusahaan dan bermaksud (atau pernah bermaksud) untuk secara aktif mengejar perubahan strategi bisnis. Jadwal 13G menunjukkan investasi pasif lebih dari 5%.
The share price as of September 2, 2025 is 24.70 / share. Previously, on February 3, 2025, the share price was 23.92 / share. This represents an increase of 3.26% over that period.
Skor Sentimen Dana
Skor Sentimen Dana (sebelumnya dikenal sebagai Skor Akumulasi Kepemilikan) menemukan saham-saham yang paling banyak dibeli oleh dana. Ini adalah hasil dari model kuantitatif multi-faktor yang canggih yang mengidentifikasi perusahaan dengan tingkat akumulasi institusional tertinggi. Model penilaian menggunakan kombinasi dari total peningkatan pemilik yang diungkapkan, perubahan dalam alokasi portofolio pada pemilik tersebut, dan metrik lainnya. Angka berkisar dari 0 hingga 100, dengan angka yang lebih tinggi menunjukkan tingkat akumulasi yang lebih tinggi dibandingkan dengan perusahaan sejenisnya, dan 50 adalah rata-ratanya.
Frekuensi Pembaruan: Setiap Hari
Lihat Ownership Explorer, yang menyediakan daftar perusahaan dengan peringkat tertinggi.
Rasio Put/Call Institusional
Selain melaporkan isu ekuitas dan utang standar, institusi dengan aset di bawah manajemen lebih dari 100 juta dolar AS juga harus mengungkapkan kepemilikan opsi put dan call mereka. Karena opsi put umumnya menunjukkan sentimen negatif, dan opsi call menunjukkan sentimen positif, kita dapat mengetahui sentimen institusional secara keseluruhan dengan memplot rasio put terhadap call. Grafik di sebelah kanan memplot rasio put/call historis untuk instrumen ini.
Menggunakan Rasio Put/Call sebagai indikator sentimen investor mengatasi salah satu kekurangan utama dari penggunaan total kepemilikan institusional, yaitu sejumlah besar aset yang dikelola diinvestasikan secara pasif untuk melacak indeks. Dana yang dikelola secara pasif biasanya tidak membeli opsi, sehingga indikator rasio put/call lebih akurat dalam melacak sentimen dana yang dikelola secara aktif.
Pengajuan 13F dan NPORT
Detail pada pengajuan 13F tersedia gratis. Detail pada pengajuan NP memerlukan keanggotaan premium. Baris berwarna hijau menunjukkan posisi baru. Baris berwarna merah menunjukkan posisi yang sudah ditutup. Klik tautan ini ikon untuk melihat riwayat transaksi selengkapnya.
Tingkatkan
untuk membuka data premium dan mengekspor ke Excel ![]() .
.
| Tanggal File | Sumber | Investor | Ketik | Presyo ng Avg (Silangan) |
Saham | Δ Saham (%) |
Dilaporkan Nilai ($1000) |
Nilai Δ (%) |
Alokasi Port (%) |
|
|---|---|---|---|---|---|---|---|---|---|---|
| 2025-08-11 | 13F | WPWealth LLP | 26,407 | 0.00 | 644 | 3.04 | ||||
| 2025-08-14 | 13F | Apriem Advisors | 9,500 | 11.76 | 232 | 14.93 | ||||
| 2025-07-17 | 13F | Alpine Bank Wealth Management | 18,750 | 457 | ||||||
| 2025-08-08 | 13F | Cetera Investment Advisers | 58,571 | 18.67 | 1,428 | 22.37 | ||||
| 2025-08-13 | 13F | Continuum Advisory, LLC | 18,698 | 144.80 | 456 | 152.78 | ||||
| 2025-08-06 | 13F | Wedbush Securities Inc | 11,168 | 0 | ||||||
| 2025-07-22 | 13F | DAVENPORT & Co LLC | 17,734 | 432 | ||||||
| 2025-07-30 | 13F | Evermay Wealth Management Llc | 1,130 | 0.00 | 28 | 3.85 | ||||
| 2025-08-08 | 13F | Kingsview Wealth Management, LLC | 42,485 | 0.00 | 1,036 | 2.99 | ||||
| 2025-08-06 | 13F | Founders Financial Securities Llc | 0 | -100.00 | 0 | |||||
| 2025-07-25 | 13F | Cwm, Llc | 587 | 0.00 | 0 | |||||
| 2025-07-14 | 13F | Kfg Wealth Management, Llc | 18,837 | 6.11 | 459 | 9.29 | ||||
| 2025-08-01 | 13F | FSA Advisors, Inc. | 11,819 | 288 | ||||||
| 2025-07-23 | 13F | Clear Creek Financial Management, LLC | 19,401 | 473 | ||||||
| 2025-08-12 | 13F | Jpmorgan Chase & Co | 0 | -100.00 | 0 | |||||
| 2025-08-13 | 13F | BCJ Capital Management, LLC | 334,516 | -1.02 | 8,156 | 2.01 | ||||
| 2025-08-14 | 13F/A | Barclays Plc | 8,212 | 0 | ||||||
| 2025-07-14 | 13F | Chris Bulman Inc | 35,043 | 53.88 | 854 | 58.74 | ||||
| 2025-08-14 | 13F | Jane Street Group, Llc | 0 | -100.00 | 0 | |||||
| 2025-07-28 | 13F | Cypress Wealth Services, LLC | 13,574 | 331 | ||||||
| 2025-07-24 | 13F | IFP Advisors, Inc | 5,742 | 0.00 | 140 | 2.96 | ||||
| 2025-08-11 | 13F | Atlantic Private Wealth, LLC | 29,899 | 8.06 | 729 | 11.31 | ||||
| 2025-07-02 | 13F | HBW Advisory Services LLC | 70,902 | 1,729 | ||||||
| 2025-08-11 | 13F | Principal Securities, Inc. | 6,087 | 148 | ||||||
| 2025-07-30 | 13F | Brookstone Capital Management | 42,574 | 39.01 | 1,038 | 43.37 | ||||
| 2025-08-11 | 13F | Summit Wealth Partners, LLC | 23,813 | 0.00 | 581 | 3.02 | ||||
| 2025-07-30 | 13F | IMG Wealth Management, Inc. | 24,260 | 2.81 | 591 | 5.91 | ||||
| 2025-07-14 | 13F | AdvisorNet Financial, Inc | 2,088 | 51 | ||||||
| 2025-07-29 | 13F | Chicago Partners Investment Group LLC | 9,094 | -41.78 | 223 | -39.89 | ||||
| 2025-08-13 | 13F | Capital Analysts, Inc. | 1,045 | 0.00 | 0 | |||||
| 2025-08-11 | 13F | Brass Tax Wealth Management, Inc | 14,336 | 32.30 | 350 | 36.33 | ||||
| 2025-08-13 | 13F | Truvestments Capital Llc | 14,589 | 0.00 | 356 | 2.90 | ||||
| 2025-08-14 | 13F | Raymond James Financial Inc | 141,881 | 37.49 | 3,459 | 41.70 | ||||
| 2025-07-28 | 13F | Harbour Investments, Inc. | 138,582 | 27.47 | 3,379 | 31.34 | ||||
| 2025-07-25 | 13F | Prostatis Group LLC | 106,258 | 871.99 | 2,591 | 903.88 | ||||
| 2025-08-06 | 13F | AE Wealth Management LLC | 165,967 | -25.27 | 4,047 | -22.99 | ||||
| 2025-07-11 | 13F | Farther Finance Advisors, LLC | 1,045 | 25 | ||||||
| 2025-07-31 | 13F | Cambridge Investment Research Advisors, Inc. | 73,323 | 52.48 | 2 | 0.00 | ||||
| 2025-08-06 | 13F | Vantage Financial Partners, LLC | 19,382 | 60.25 | 473 | 65.03 | ||||
| 2025-07-25 | 13F | Atria Wealth Solutions, Inc. | 0 | -100.00 | 0 | |||||
| 2025-08-12 | 13F | LPL Financial LLC | 24,324 | 593 | ||||||
| 2025-08-14 | 13F | Citadel Advisors Llc | 14,152 | 345 | ||||||
| 2025-07-15 | 13F | Garrett Investment Advisors LLC | 8,831 | 0.00 | 215 | 3.37 | ||||
| 2025-07-29 | 13F | AssuredPartners Investment Advisors, LLC | 13,220 | 322 | ||||||
| 2025-08-14 | 13F | Old Mission Capital Llc | 64,929 | 1,583 | ||||||
| 2025-08-13 | 13F | Advisor Group Holdings, Inc. | 21,424 | 25.37 | 522 | 29.21 | ||||
| 2025-08-14 | 13F | UBS Group AG | 2,994 | 73 | ||||||
| 2025-08-05 | 13F | WorthPointe, LLC | 10,048 | 0.00 | 245 | 2.95 | ||||
| 2025-07-15 | 13F | Optima Capital Llc | 40,258 | -10.94 | 982 | -8.23 | ||||
| 2025-08-13 | 13F | Summit Wealth Group Llc / Co | 14,123 | 344 | ||||||
| 2025-07-08 | 13F | Ptm Wealth Management, Llc | 10,000 | 0.00 | 244 | 4.72 | ||||
| 2025-07-18 | 13F | Truist Financial Corp | 12,526 | 0.00 | 305 | 3.04 | ||||
| 2025-07-16 | 13F | NovaPoint Capital, LLC | 184,796 | 0.45 | 4,506 | 3.52 | ||||
| 2025-08-06 | 13F | Commonwealth Equity Services, Llc | 187,165 | -39.28 | 5 | -42.86 | ||||
| 2025-08-12 | 13F | Reliant Wealth Planning | 39,381 | 960 | ||||||
| 2025-08-14 | 13F | Hrt Financial Lp | 12,889 | 0 | ||||||
| 2025-08-14 | 13F | Glen Eagle Advisors, LLC | 11,126 | -26.08 | 271 | -23.88 | ||||
| 2025-08-14 | 13F | Mml Investors Services, Llc | 68,268 | 73.38 | 2 | |||||
| 2025-08-12 | 13F | Archer Investment Corp | 55,793 | -52.70 | 1,360 | -51.25 | ||||
| 2025-07-09 | 13F | Central Valley Advisors, Llc | 19,892 | 485 | ||||||
| 2025-07-09 | 13F | Triumph Capital Management | 0 | -100.00 | 0 | |||||
| 2025-08-11 | 13F | HighTower Advisors, LLC | 46,940 | 0.00 | 1,144 | 3.06 | ||||
| 2025-07-29 | 13F | Stratos Wealth Advisors, LLC | 11,396 | 278 | ||||||
| 2025-08-12 | 13F | Proequities, Inc. | 0 | 0 | ||||||
| 2025-08-01 | 13F | Ashton Thomas Private Wealth, LLC | 60,774 | 0.00 | 1,482 | 3.06 | ||||
| 2025-08-14 | 13F | GWM Advisors LLC | 43,787 | -0.41 | 1,068 | 2.60 | ||||
| 2025-07-28 | 13F | Sagespring Wealth Partners, Llc | 14,924 | 364 | ||||||
| 2025-07-09 | 13F | Lineweaver Wealth Advisors, LLC | 40,928 | 0.00 | 998 | 3.00 | ||||
| 2025-07-30 | 13F | Strategic Blueprint, LLC | 39,863 | 45.28 | 972 | 49.61 | ||||
| 2025-08-13 | 13F | Crosspoint Financial, Llc | 13,127 | 0.00 | 320 | 3.23 | ||||
| 2025-07-10 | 13F | Wealth Enhancement Advisory Services, Llc | 10,477 | 0.00 | 256 | 3.24 | ||||
| 2025-07-08 | 13F | Canandaigua National Bank & Trust Co | 41,543 | 33.86 | 1,013 | 37.87 | ||||
| 2025-08-12 | 13F | Steward Partners Investment Advisory, Llc | 4,671 | 1,020.14 | 114 | 1,155.56 | ||||
| 2025-08-12 | 13F | Tradition Wealth Management, LLC | 12,604 | 307 | ||||||
| 2025-08-15 | 13F | Kestra Advisory Services, LLC | 94,594 | 4.32 | 2,306 | 7.51 | ||||
| 2025-08-14 | 13F | Ausdal Financial Partners, Inc. | 10,723 | 0.00 | 261 | 3.16 | ||||
| 2025-08-19 | 13F | Advisory Services Network, LLC | 9,744 | 239 | ||||||
| 2025-07-01 | 13F | Harbor Investment Advisory, Llc | 4,190 | 102 | ||||||
| 2025-08-29 | 13F | Evolution Wealth Management Inc. | 14,519 | 354 | ||||||
| 2025-08-01 | 13F | Envestnet Asset Management Inc | 98,759 | -2.31 | 2,408 | 0.63 | ||||
| 2025-08-14 | 13F | Susquehanna International Group, Llp | 58,765 | 1,433 |