Mga Batayang Estadistika
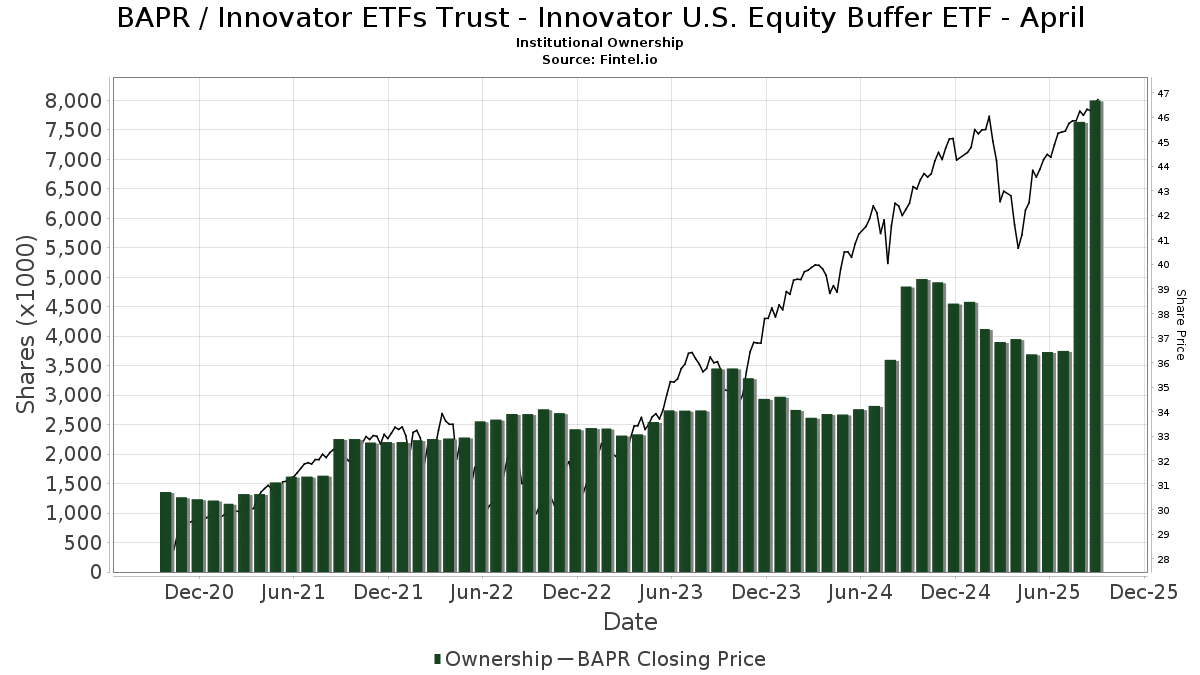
| Pemilik Institusional | 103 total, 103 long only, 0 short only, 0 long/short - change of 10.75% MRQ |
| Alokasi Portofolio Rata-rata | 0.4806 % - change of 77.93% MRQ |
| Saham Institusional (Jangka Panjang) | 7,997,300 (ex 13D/G) - change of 4.26MM shares 114.23% MRQ |
| Nilai Institusional (Jangka Panjang) | $ 315,387 USD ($1000) |
Kepemilikan Institusional dan Pemegang Saham
Innovator ETFs Trust - Innovator U.S. Equity Buffer ETF - April (US:BAPR) memiliki 103 pemilik institusional dan pemegang saham yang telah mengajukan formulir 13D/G atau 13F kepada Komisi Bursa Efek (Securities Exchange Commission/SEC). Lembaga-lembaga ini memegang total 7,997,300 saham. Pemegang saham terbesar meliputi Stuart Chaussee & Associates, Inc., Gradient Investments LLC, Brookstone Capital Management, Commonwealth Equity Services, Llc, Innovator ETFs Trust - Innovator Laddered Allocation Buffer ETF, Penserra Capital Management LLC, Cerity Partners LLC, Integral Investment Advisors, Inc., Raymond James Financial Inc, and HighTower Advisors, LLC .
Struktur kepemilikan institusional Innovator ETFs Trust - Innovator U.S. Equity Buffer ETF - April (BATS:BAPR) menunjukkan posisi terkini di perusahaan oleh institusi dan dana, serta perubahan terbaru dalam ukuran posisi. Pemegang saham utama dapat mencakup investor individu, reksa dana, dana lindung nilai, atau institusi. Jadwal 13D menunjukkan bahwa investor memegang (atau pernah memegang) lebih dari 5% saham perusahaan dan bermaksud (atau pernah bermaksud) untuk secara aktif mengejar perubahan strategi bisnis. Jadwal 13G menunjukkan investasi pasif lebih dari 5%.
The share price as of September 5, 2025 is 46.43 / share. Previously, on September 9, 2024, the share price was 41.68 / share. This represents an increase of 11.38% over that period.
Skor Sentimen Dana
Skor Sentimen Dana (sebelumnya dikenal sebagai Skor Akumulasi Kepemilikan) menemukan saham-saham yang paling banyak dibeli oleh dana. Ini adalah hasil dari model kuantitatif multi-faktor yang canggih yang mengidentifikasi perusahaan dengan tingkat akumulasi institusional tertinggi. Model penilaian menggunakan kombinasi dari total peningkatan pemilik yang diungkapkan, perubahan dalam alokasi portofolio pada pemilik tersebut, dan metrik lainnya. Angka berkisar dari 0 hingga 100, dengan angka yang lebih tinggi menunjukkan tingkat akumulasi yang lebih tinggi dibandingkan dengan perusahaan sejenisnya, dan 50 adalah rata-ratanya.
Frekuensi Pembaruan: Setiap Hari
Lihat Ownership Explorer, yang menyediakan daftar perusahaan dengan peringkat tertinggi.
Rasio Put/Call Institusional
Selain melaporkan isu ekuitas dan utang standar, institusi dengan aset di bawah manajemen lebih dari 100 juta dolar AS juga harus mengungkapkan kepemilikan opsi put dan call mereka. Karena opsi put umumnya menunjukkan sentimen negatif, dan opsi call menunjukkan sentimen positif, kita dapat mengetahui sentimen institusional secara keseluruhan dengan memplot rasio put terhadap call. Grafik di sebelah kanan memplot rasio put/call historis untuk instrumen ini.
Menggunakan Rasio Put/Call sebagai indikator sentimen investor mengatasi salah satu kekurangan utama dari penggunaan total kepemilikan institusional, yaitu sejumlah besar aset yang dikelola diinvestasikan secara pasif untuk melacak indeks. Dana yang dikelola secara pasif biasanya tidak membeli opsi, sehingga indikator rasio put/call lebih akurat dalam melacak sentimen dana yang dikelola secara aktif.
Pengajuan 13F dan NPORT
Detail pada pengajuan 13F tersedia gratis. Detail pada pengajuan NP memerlukan keanggotaan premium. Baris berwarna hijau menunjukkan posisi baru. Baris berwarna merah menunjukkan posisi yang sudah ditutup. Klik tautan ini ikon untuk melihat riwayat transaksi selengkapnya.
Tingkatkan
untuk membuka data premium dan mengekspor ke Excel ![]() .
.
| Tanggal File | Sumber | Investor | Ketik | Presyo ng Avg (Silangan) |
Saham | Δ Saham (%) |
Dilaporkan Nilai ($1000) |
Nilai Δ (%) |
Alokasi Port (%) |
|
|---|---|---|---|---|---|---|---|---|---|---|
| 2025-05-15 | 13F | Hrt Financial Lp | 0 | -100.00 | 0 | |||||
| 2025-08-11 | 13F | WPWealth LLP | 12,861 | 0.00 | 581 | 6.41 | ||||
| 2025-08-15 | 13F | Morgan Stanley | 1,763 | 0.00 | 80 | 6.76 | ||||
| 2025-07-23 | 13F | Motiv8 Investments LLC | 56,247 | 4.77 | 2,542 | 11.45 | ||||
| 2025-07-22 | 13F | Belpointe Asset Management LLC | 51,231 | 4.07 | 2,315 | 10.77 | ||||
| 2025-08-14 | 13F | Sunbelt Securities, Inc. | 48,645 | 2,238.70 | 2,155 | 2,348.86 | ||||
| 2025-08-14 | 13F | CoreCap Advisors, LLC | 6,808 | -0.04 | 308 | 6.23 | ||||
| 2025-08-14 | 13F | Beck Capital Management, Llc | 6,723 | -0.16 | 304 | 6.32 | ||||
| 2025-07-22 | 13F | Berkshire Money Management, Inc. | 21,374 | 0.00 | 966 | 6.39 | ||||
| 2025-05-15 | 13F | CAPROCK Group, Inc. | 0 | -100.00 | 0 | |||||
| 2025-08-14 | 13F | Colony Group, LLC | 8,600 | 0.00 | 389 | 6.30 | ||||
| 2025-08-01 | 13F | FSA Advisors, Inc. | 17,036 | 16.67 | 770 | 8.62 | ||||
| 2025-04-29 | 13F | Pensionmark Financial Group, Llc | 0 | -100.00 | 0 | |||||
| 2025-08-04 | 13F | Arkadios Wealth Advisors | 21,595 | 976 | ||||||
| 2025-08-07 | 13F | Runnymede Capital Advisors, Inc. | 0 | -100.00 | 0 | |||||
| 2025-08-12 | 13F | LPL Financial LLC | 155,282 | 11.08 | 7,017 | 18.19 | ||||
| 2025-07-30 | 13F | Brookstone Capital Management | 553,510 | 3,197.06 | 25,012 | 3,412.78 | ||||
| 2025-08-07 | 13F | Allworth Financial LP | 1,356 | 0.00 | 61 | 8.93 | ||||
| 2025-08-01 | 13F | Integral Investment Advisors, Inc. | 270,738 | 3.20 | 12,234 | 9.81 | ||||
| 2025-08-01 | 13F | Corrado Advisors, Llc | 4,653 | 210 | ||||||
| 2025-05-19 | 13F/A | Jane Street Group, Llc | 0 | -100.00 | 0 | -100.00 | ||||
| 2025-07-15 | 13F | Armis Advisers, LLC | 28,834 | 2.77 | 1,303 | 9.32 | ||||
| 2025-07-22 | 13F | Siligmueller & Norvid Wealth Advisors LLC | 5,600 | -26.32 | 254 | -21.12 | ||||
| 2025-05-05 | 13F | PCA Investment Advisory Services Inc. | 0 | -100.00 | 0 | |||||
| 2025-07-09 | 13F | Fragasso Group Inc. | 15,416 | 55.17 | 697 | 65.32 | ||||
| 2025-07-29 | 13F | Mattson Financial Services, LLC | 10,012 | 452 | ||||||
| 2025-08-11 | 13F | Blue Bell Private Wealth Management, Llc | 52,719 | 20.25 | 2,382 | 28.00 | ||||
| 2025-08-12 | 13F | Change Path, LLC | 7,387 | -0.34 | 334 | 6.05 | ||||
| 2025-07-17 | 13F | XML Financial, LLC | 15,643 | -0.20 | 707 | 6.17 | ||||
| 2025-08-08 | 13F | Emerald Investment Partners, Llc | 150 | 0.00 | 7 | 0.00 | ||||
| 2025-08-11 | 13F | Annis Gardner Whiting Capital Advisors, LLC | 7,700 | 348 | ||||||
| 2025-04-22 | 13F | Castleview Partners, Llc | 0 | -100.00 | 0 | |||||
| 2025-07-17 | 13F | Clear Point Advisors Inc. | 24,503 | -1.83 | 1,107 | 4.43 | ||||
| 2025-08-04 | 13F | Spire Wealth Management | 29,904 | 5.30 | 1,351 | 12.02 | ||||
| 2025-08-06 | 13F | AE Wealth Management LLC | 7,145 | 4.78 | 323 | 11.42 | ||||
| 2025-07-28 | 13F | Harbour Investments, Inc. | 13,558 | 1.22 | 613 | 7.75 | ||||
| 2025-08-08 | 13F | Cetera Investment Advisers | 74,885 | 7.76 | 3,384 | 14.64 | ||||
| 2025-08-11 | 13F | Outlook Wealth Advisors, LLC | 46,882 | -60.22 | 2,118 | -57.68 | ||||
| 2025-08-15 | 13F | Kestra Advisory Services, LLC | 52,848 | -1.16 | 2,388 | 5.20 | ||||
| 2025-08-06 | 13F | Souders Financial Advisors | 5,857 | 0.00 | 265 | 6.45 | ||||
| 2025-08-11 | 13F | Bellwether Advisors, LLC | 5,352 | 0.00 | 242 | 6.17 | ||||
| 2025-07-16 | 13F | Signaturefd, Llc | 28,341 | 1,281 | ||||||
| 2025-08-06 | 13F | Valtinson Bruner Financial Planning LLC | 23,387 | -4.46 | 1,057 | 1.64 | ||||
| 2025-08-14 | 13F | Mml Investors Services, Llc | 39,546 | 67.53 | 2 | 0.00 | ||||
| 2025-08-11 | 13F | Nations Financial Group Inc, /ia/ /adv | 7,470 | 22.46 | 338 | 30.12 | ||||
| 2025-05-15 | 13F | Old Mission Capital Llc | 0 | -100.00 | 0 | |||||
| 2025-08-08 | 13F | Comprehensive Financial Planning, Inc./PA | 39 | 0.00 | 2 | 0.00 | ||||
| 2025-07-03 | 13F | City Center Advisors, LLC | 11,597 | -4.69 | 524 | 1.55 | ||||
| 2025-08-06 | 13F | Penserra Capital Management LLC | 380,937 | -5.51 | 17 | 0.00 | ||||
| 2025-08-14 | 13F | Snowden Capital Advisors LLC | 35,079 | 0.00 | 1,585 | 6.45 | ||||
| 2025-08-12 | 13F | Proequities, Inc. | 0 | 0 | ||||||
| 2025-05-16 | 13F | Ashton Thomas Private Wealth, LLC | 0 | -100.00 | 0 | -100.00 | ||||
| 2025-07-10 | 13F | Signal Advisors Wealth, LLC | 15,290 | 691 | ||||||
| 2025-07-09 | 13F | Keystone Wealth Services, LLC | 12,704 | -3.87 | 574 | 2.32 | ||||
| 2025-08-05 | 13F | Sigma Planning Corp | 23,863 | -9.72 | 1,078 | -3.92 | ||||
| 2025-08-14 | 13F | Fmr Llc | 110 | -97.85 | 5 | -98.16 | ||||
| 2025-07-14 | 13F | AdvisorNet Financial, Inc | 170 | 8 | ||||||
| 2025-04-18 | 13F | Capital Wealth Management, Llc | 0 | -100.00 | 0 | |||||
| 2025-08-15 | 13F | Brown Financial Advisors | 11,886 | 537 | ||||||
| 2025-07-22 | 13F | My Personal CFO, LLC | 91,870 | 13.60 | 4,151 | 20.88 | ||||
| 2025-08-14 | 13F | UBS Group AG | 6,424 | 290 | ||||||
| 2025-08-13 | 13F | Townsquare Capital Llc | 0 | -100.00 | 0 | |||||
| 2025-08-12 | 13F | Tradition Wealth Management, LLC | 10,504 | 7.21 | 475 | 13.94 | ||||
| 2025-07-14 | 13F | Chris Bulman Inc | 13,156 | 131.13 | 594 | 146.47 | ||||
| 2025-08-13 | 13F | Continuum Advisory, LLC | 0 | -100.00 | 0 | -100.00 | ||||
| 2025-08-14 | 13F/A | Barclays Plc | 2,102 | 210,100.00 | 0 | |||||
| 2025-07-21 | 13F | DHJJ Financial Advisors, Ltd. | 22,240 | 8.83 | 1,005 | 15.80 | ||||
| 2025-08-05 | 13F | Integrity Financial Corp /WA | 3,922 | 0.00 | 177 | 6.63 | ||||
| 2025-08-13 | 13F | Beacon Pointe Advisors, LLC | 17,888 | 18.43 | 808 | 26.05 | ||||
| 2025-08-14 | 13F | First Commonwealth Financial Corp /pa/ | 57,112 | -0.43 | 2,581 | 5.91 | ||||
| 2025-08-12 | 13F | Steward Partners Investment Advisory, Llc | 2,540 | 0.00 | 115 | 6.54 | ||||
| 2025-07-08 | 13F | Paladin Wealth, LLC | 9,775 | 442 | ||||||
| 2025-07-24 | 13F | IFP Advisors, Inc | 1,944 | 118.67 | 88 | 135.14 | ||||
| 2025-07-11 | 13F | Lantz Financial LLC | 18,539 | 94.51 | 838 | 107.18 | ||||
| 2025-07-25 | 13F | Cwm, Llc | 167 | 0.00 | 0 | |||||
| 2025-08-19 | 13F | Cape Investment Advisory, Inc. | 100 | 0.00 | 5 | 0.00 | ||||
| 2025-07-17 | 13F | Janney Montgomery Scott LLC | 23,046 | -6.21 | 1 | 0.00 | ||||
| 2025-08-06 | 13F | Commonwealth Equity Services, Llc | 482,018 | 9.74 | 22 | 16.67 | ||||
| 2025-08-13 | 13F | Cerity Partners LLC | 378,934 | 98.44 | 17,123 | 111.16 | ||||
| 2025-07-31 | 13F | Orion Capital Management LLC | 2,670 | 0.00 | 121 | 6.19 | ||||
| 2025-08-14 | 13F | Financial Network Wealth Advisors LLC | 499 | 0.00 | 23 | 4.76 | ||||
| 2025-08-29 | 13F | Centaurus Financial, Inc. | 4,439 | 14.79 | 0 | |||||
| 2025-07-14 | 13F | Kfg Wealth Management, Llc | 4,514 | -7.00 | 204 | -1.46 | ||||
| 2025-08-12 | 13F/A | Castellan Group, LLC | 7,160 | 0.00 | 324 | 6.25 | ||||
| 2025-08-12 | 13F | SRS Capital Advisors, Inc. | 11,247 | -10.17 | 508 | -4.33 | ||||
| 2025-06-24 | NP | Innovator ETFs Trust - Innovator Laddered Allocation Buffer ETF | 405,497 | 4.51 | 17,116 | -2.58 | ||||
| 2025-04-09 | 13F | RFG Advisory, LLC | 0 | -100.00 | 0 | |||||
| 2025-07-25 | 13F | Lion Street Advisors, LLC | 6,514 | 294 | ||||||
| 2025-08-12 | 13F | Wood Tarver Financial Group, LLC | 118 | 38.82 | 0 | -100.00 | ||||
| 2025-08-11 | 13F | HighTower Advisors, LLC | 179,339 | 2.05 | 8,104 | 8.58 | ||||
| 2025-05-14 | 13F | Susquehanna International Group, Llp | 0 | -100.00 | 0 | |||||
| 2025-07-11 | 13F | Farther Finance Advisors, LLC | 6,170 | -3.29 | 279 | 2.58 | ||||
| 2025-08-13 | 13F | BCJ Capital Management, LLC | 6,803 | 6.35 | 307 | 13.28 | ||||
| 2025-07-30 | 13F | Strategic Blueprint, LLC | 30,027 | -3.00 | 1,357 | 3.20 | ||||
| 2025-08-11 | 13F | Principal Securities, Inc. | 8,724 | 3.27 | 394 | 5.35 | ||||
| 2025-07-22 | 13F | Diligent Investors, LLC | 5,733 | 0.00 | 259 | 6.58 | ||||
| 2025-07-28 | 13F | WealthPLAN Partners, LLC | 9,458 | 0.00 | 427 | 6.48 | ||||
| 2025-07-10 | 13F | Secure Asset Management, LLC | 9,022 | -0.91 | 408 | 5.44 | ||||
| 2025-07-22 | 13F | Beacon Financial Advisory LLC | 4,905 | -35.08 | 222 | -30.94 | ||||
| 2025-07-30 | 13F | IMG Wealth Management, Inc. | 3,604 | 17.28 | 163 | 24.62 | ||||
| 2025-08-01 | 13F | Envestnet Asset Management Inc | 100,317 | 59.22 | 4,533 | 69.46 | ||||
| 2025-08-08 | 13F | Capital Investment Advisory Services, LLC | 2,762 | 0.00 | 125 | 5.98 | ||||
| 2025-07-14 | 13F | Southland Equity Partners LLC | 34,707 | -0.32 | 1,568 | 6.09 | ||||
| 2025-04-16 | 13F | CRA Financial Services, LLC | 0 | -100.00 | 0 | |||||
| 2025-07-31 | 13F | Cambridge Investment Research Advisors, Inc. | 42,048 | 6.44 | 2 | 0.00 | ||||
| 2025-08-06 | 13F | Maltin Wealth Management, Inc. | 41,978 | 0.00 | 1,897 | 6.40 | ||||
| 2025-08-13 | 13F | M Holdings Securities, Inc. | 15,740 | -16.37 | 1 | |||||
| 2025-05-15 | 13F | Citadel Advisors Llc | 0 | -100.00 | 0 | |||||
| 2025-04-18 | 13F | Global Trust Asset Management, LLC | 0 | -100.00 | 0 | |||||
| 2025-08-15 | 13F | Chapman Financial Group, Llc | 19,700 | -2.42 | 890 | -0.45 | ||||
| 2025-07-29 | 13F | Stratos Wealth Advisors, LLC | 8,744 | 0.00 | 395 | 6.47 | ||||
| 2025-08-14 | 13F | Royal Bank Of Canada | 0 | -100.00 | 0 | |||||
| 2025-08-19 | 13F | Advisory Services Network, LLC | 9,708 | 0.00 | 444 | 7.77 | ||||
| 2025-09-04 | 13F/A | Advisor Group Holdings, Inc. | 158,034 | 19.61 | 7,140 | 27.25 | ||||
| 2025-08-01 | 13F | Stuart Chaussee & Associates, Inc. | 2,218,802 | 100,263 | ||||||
| 2025-08-12 | 13F | Jpmorgan Chase & Co | 4,454 | 345.40 | 201 | 378.57 | ||||
| 2025-07-08 | 13F | Gradient Investments LLC | 1,035,285 | 46,782 | ||||||
| 2025-04-14 | 13F | BCS Wealth Management | 0 | -100.00 | 0 | |||||
| 2025-08-14 | 13F | Benjamin Edwards Inc | 9,941 | 0.00 | 449 | 6.40 | ||||
| 2025-08-14 | 13F | Raymond James Financial Inc | 180,133 | 31.31 | 8,140 | 39.70 | ||||
| 2025-08-04 | 13F | Creative Financial Designs Inc /adv | 1,250 | 0.00 | 56 | 5.66 | ||||
| 2025-08-15 | 13F | Captrust Financial Advisors | 8,888 | 402 | ||||||
| 2025-08-01 | 13F | Gwn Securities Inc. | 22,849 | -67.98 | 1,035 | -66.74 |