Mga Batayang Estadistika
| Pemilik Institusional | 107 total, 107 long only, 0 short only, 0 long/short - change of 9.09% MRQ |
| Alokasi Portofolio Rata-rata | 0.5780 % - change of -14.33% MRQ |
| Saham Institusional (Jangka Panjang) | 3,973,340 (ex 13D/G) - change of -0.02MM shares -0.47% MRQ |
| Nilai Institusional (Jangka Panjang) | $ 242,759 USD ($1000) |
Kepemilikan Institusional dan Pemegang Saham
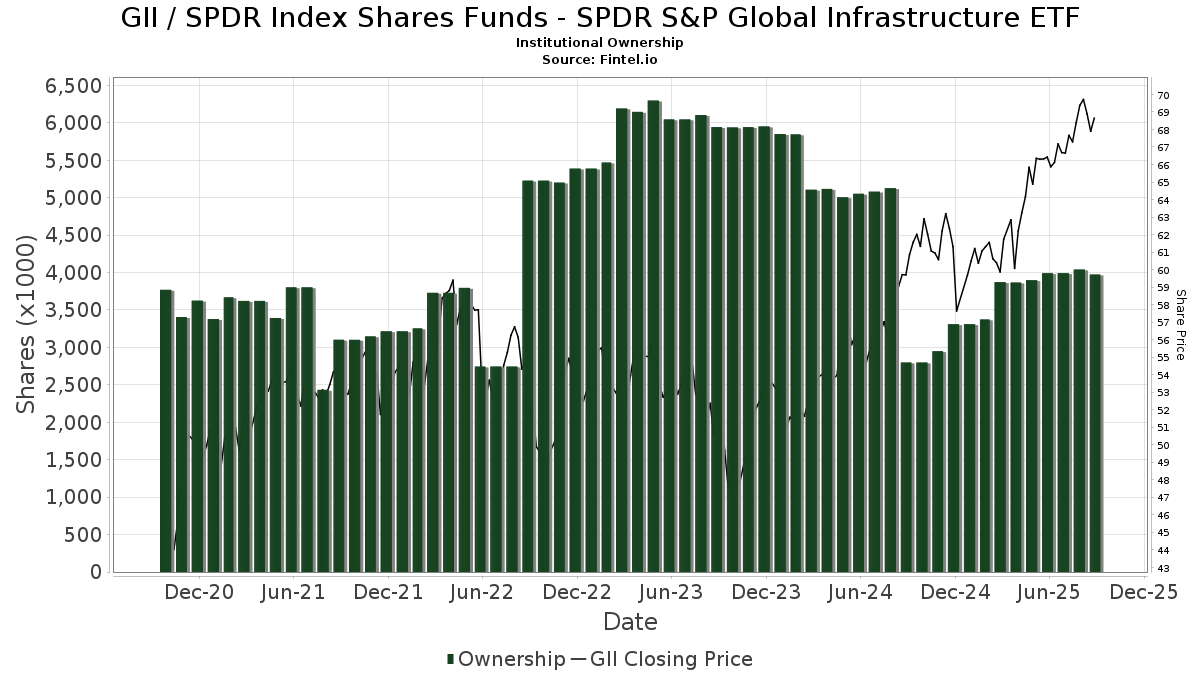
SPDR Index Shares Funds - SPDR S&P Global Infrastructure ETF (US:GII) memiliki 107 pemilik institusional dan pemegang saham yang telah mengajukan formulir 13D/G atau 13F kepada Komisi Bursa Efek (Securities Exchange Commission/SEC). Lembaga-lembaga ini memegang total 3,973,340 saham. Pemegang saham terbesar meliputi RLY - SPDR SSGA Multi-Asset Real Return ETF, Wealth Architects, LLC, LPL Financial LLC, Mariner, LLC, Hills Bank & Trust Co, Wharton Business Group, LLC, Warren Street Wealth Advisors, LLC, Baker Avenue Asset Management, LP, TOWER TRUST & INVESTMENT Co, and INKM - SPDR SSGA Income Allocation ETF .
Struktur kepemilikan institusional SPDR Index Shares Funds - SPDR S&P Global Infrastructure ETF (ARCA:GII) menunjukkan posisi terkini di perusahaan oleh institusi dan dana, serta perubahan terbaru dalam ukuran posisi. Pemegang saham utama dapat mencakup investor individu, reksa dana, dana lindung nilai, atau institusi. Jadwal 13D menunjukkan bahwa investor memegang (atau pernah memegang) lebih dari 5% saham perusahaan dan bermaksud (atau pernah bermaksud) untuk secara aktif mengejar perubahan strategi bisnis. Jadwal 13G menunjukkan investasi pasif lebih dari 5%.
The share price as of September 5, 2025 is 68.08 / share. Previously, on September 9, 2024, the share price was 59.56 / share. This represents an increase of 14.30% over that period.
Skor Sentimen Dana
Skor Sentimen Dana (sebelumnya dikenal sebagai Skor Akumulasi Kepemilikan) menemukan saham-saham yang paling banyak dibeli oleh dana. Ini adalah hasil dari model kuantitatif multi-faktor yang canggih yang mengidentifikasi perusahaan dengan tingkat akumulasi institusional tertinggi. Model penilaian menggunakan kombinasi dari total peningkatan pemilik yang diungkapkan, perubahan dalam alokasi portofolio pada pemilik tersebut, dan metrik lainnya. Angka berkisar dari 0 hingga 100, dengan angka yang lebih tinggi menunjukkan tingkat akumulasi yang lebih tinggi dibandingkan dengan perusahaan sejenisnya, dan 50 adalah rata-ratanya.
Frekuensi Pembaruan: Setiap Hari
Lihat Ownership Explorer, yang menyediakan daftar perusahaan dengan peringkat tertinggi.
Rasio Put/Call Institusional
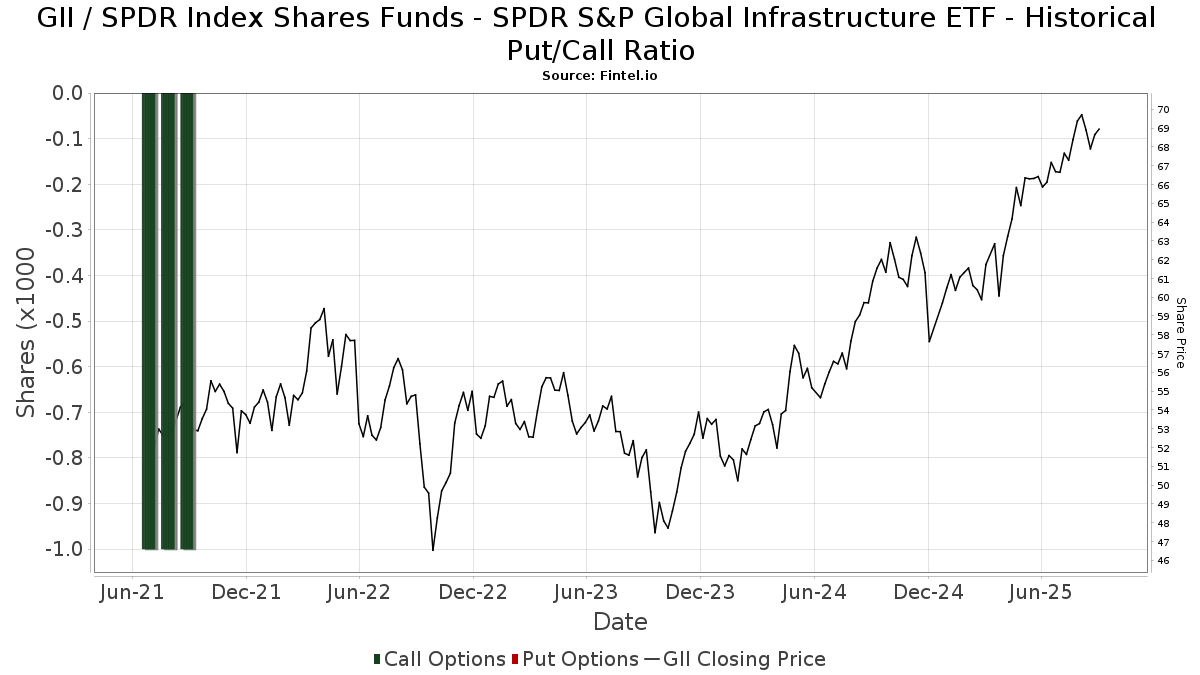
Selain melaporkan isu ekuitas dan utang standar, institusi dengan aset di bawah manajemen lebih dari 100 juta dolar AS juga harus mengungkapkan kepemilikan opsi put dan call mereka. Karena opsi put umumnya menunjukkan sentimen negatif, dan opsi call menunjukkan sentimen positif, kita dapat mengetahui sentimen institusional secara keseluruhan dengan memplot rasio put terhadap call. Grafik di sebelah kanan memplot rasio put/call historis untuk instrumen ini.
Menggunakan Rasio Put/Call sebagai indikator sentimen investor mengatasi salah satu kekurangan utama dari penggunaan total kepemilikan institusional, yaitu sejumlah besar aset yang dikelola diinvestasikan secara pasif untuk melacak indeks. Dana yang dikelola secara pasif biasanya tidak membeli opsi, sehingga indikator rasio put/call lebih akurat dalam melacak sentimen dana yang dikelola secara aktif.
Pengajuan 13F dan NPORT
Detail pada pengajuan 13F tersedia gratis. Detail pada pengajuan NP memerlukan keanggotaan premium. Baris berwarna hijau menunjukkan posisi baru. Baris berwarna merah menunjukkan posisi yang sudah ditutup. Klik tautan ini ikon untuk melihat riwayat transaksi selengkapnya.
Tingkatkan
untuk membuka data premium dan mengekspor ke Excel ![]() .
.
| Tanggal File | Sumber | Investor | Ketik | Presyo ng Avg (Silangan) |
Saham | Δ Saham (%) |
Dilaporkan Nilai ($1000) |
Nilai Δ (%) |
Alokasi Port (%) |
|
|---|---|---|---|---|---|---|---|---|---|---|
| 2025-08-14 | 13F | Royal Bank Of Canada | 9,072 | 58.80 | 611 | 72.60 | ||||
| 2025-07-16 | 13F | Paragon Capital Management Ltd | 5,142 | 0.67 | 346 | 9.49 | ||||
| 2025-08-15 | 13F | Morgan Stanley | 62,602 | 45.17 | 4,215 | 57.69 | ||||
| 2025-08-08 | 13F | Altfest L J & Co Inc | 3,340 | 0.81 | 225 | 9.27 | ||||
| 2025-08-13 | 13F | Marshall Wace, Llp | 16,171 | 1,089 | ||||||
| 2025-07-18 | 13F | Naples Global Advisors, Llc | 40,890 | 3.61 | 2,753 | 12.55 | ||||
| 2025-08-08 | 13F | Austin Wealth Management, LLC | 3,821 | 0.00 | 257 | 4.92 | ||||
| 2025-08-14 | 13F | Kovitz Investment Group Partners, LLC | 7,521 | 506 | ||||||
| 2025-08-13 | 13F | Northwestern Mutual Wealth Management Co | 7,482 | -2.12 | 504 | 6.34 | ||||
| 2025-07-24 | 13F | Comprehensive Money Management Services LLC | 15,854 | -2.93 | 1,067 | 5.43 | ||||
| 2025-08-07 | 13F | Prime Buchholz LLC | 30,509 | 0.10 | 2,054 | 8.73 | ||||
| 2025-08-05 | 13F | Advisors Preferred, LLC | 684 | 46 | ||||||
| 2025-07-28 | 13F | Harbour Investments, Inc. | 104 | 0.97 | 7 | 0.00 | ||||
| 2025-08-12 | 13F | EFG Asset Management (Americas) Corp. | 11,599 | 1.11 | 781 | 9.85 | ||||
| 2025-08-14 | 13F | CoreCap Advisors, LLC | 2 | 0.00 | 0 | |||||
| 2025-08-01 | 13F | Liberty Wealth Management Llc | 3,225 | 217 | ||||||
| 2025-08-04 | 13F | Keybank National Association/oh | 11,598 | 5.21 | 781 | 14.20 | ||||
| 2025-05-01 | 13F | Key FInancial Inc | 0 | -100.00 | 0 | |||||
| 2025-08-08 | 13F | Emerald Investment Partners, Llc | 39 | 3 | ||||||
| 2025-08-14 | 13F | Hilltop Holdings Inc. | 5,243 | 5.05 | 353 | 14.24 | ||||
| 2025-08-14 | 13F | Raymond James Financial Inc | 33,533 | -4.66 | 2,258 | 3.53 | ||||
| 2025-08-12 | 13F | Global Retirement Partners, LLC | 38,146 | 12.25 | 2,568 | 27.76 | ||||
| 2025-08-12 | 13F | Steward Partners Investment Advisory, Llc | 5,345 | 5.95 | 360 | 15.06 | ||||
| 2025-07-31 | 13F | Richards, Merrill & Peterson, Inc. | 0 | -100.00 | 0 | |||||
| 2025-08-13 | 13F | Townsquare Capital Llc | 0 | -100.00 | 0 | |||||
| 2025-07-25 | 13F | Sequoia Financial Advisors, LLC | 47,743 | 1.04 | 3,215 | 9.73 | ||||
| 2025-07-21 | 13F | Ameritas Advisory Services, LLC | 15,091 | -4.86 | 1,016 | 3.46 | ||||
| 2025-07-08 | 13F | Boltwood Capital Management | 3,520 | 1.44 | 237 | 10.23 | ||||
| 2025-08-14 | 13F | Wharton Business Group, LLC | 252,220 | 1.39 | 17 | 6.67 | ||||
| 2025-07-24 | 13F | IFP Advisors, Inc | 0 | -100.00 | 0 | -100.00 | ||||
| 2025-05-14 | 13F | Vertex Planning Partners, LLC | 0 | -100.00 | 0 | |||||
| 2025-08-08 | 13F | Citizens Financial Group Inc/ri | 67,197 | 2.41 | 4,524 | 11.21 | ||||
| 2025-08-14 | 13F | Mml Investors Services, Llc | 8,110 | 1 | ||||||
| 2025-08-01 | 13F | Austin Private Wealth, LLC | 5,560 | 5.38 | 374 | 14.37 | ||||
| 2025-08-15 | 13F | Provenance Wealth Advisors, LLC | 15,375 | 1,035 | ||||||
| 2025-08-14 | 13F | CIBC World Markets Inc. | 27,691 | 1.51 | 1,864 | 10.23 | ||||
| 2025-07-16 | 13F | Signature Resources Capital Management, LLC | 212 | 0.00 | 14 | 7.69 | ||||
| 2025-08-04 | 13F | Assetmark, Inc | 24 | -7.69 | 2 | 0.00 | ||||
| 2025-08-01 | 13F | Brookwood Investment Group LLC | 16,193 | 9.13 | 1,090 | 18.61 | ||||
| 2025-08-14 | 13F | UBS Group AG | 36,692 | -3.48 | 2,471 | 4.84 | ||||
| 2025-07-16 | 13F | TOWER TRUST & INVESTMENT Co | 122,596 | -1.66 | 8,254 | 3.18 | ||||
| 2025-08-14 | 13F | D. E. Shaw & Co., Inc. | 4,363 | -28.19 | 294 | -22.07 | ||||
| 2025-05-15 | 13F/A | Orion Portfolio Solutions, LLC | 10,729 | 129.99 | 665 | 140.94 | ||||
| 2025-08-18 | 13F/A | National Bank Of Canada /fi/ | 1,125 | 0.00 | 76 | 8.70 | ||||
| 2025-08-12 | 13F | Jpmorgan Chase & Co | 1,148 | 0.26 | 77 | 10.00 | ||||
| 2025-07-25 | 13F | Cwm, Llc | 1,124 | 253.46 | 0 | |||||
| 2025-07-09 | 13F | Breakwater Investment Management | 31,649 | 0.47 | 2,131 | 9.06 | ||||
| 2025-07-16 | 13F | Twelve Points Wealth Management LLC | 5,862 | 5.56 | 395 | 14.53 | ||||
| 2025-08-12 | 13F | Wayfinding Financial, LLC | 0 | -100.00 | 0 | |||||
| 2025-05-12 | 13F | C2P Capital Advisory Group, LLC d.b.a. Prosperity Capital Advisors | 0 | -100.00 | 0 | |||||
| 2025-05-14 | 13F | Jane Street Group, Llc | 0 | -100.00 | 0 | |||||
| 2025-08-08 | 13F | Hedeker Wealth, LLC | 24,968 | 3.22 | 1,681 | 12.14 | ||||
| 2025-07-16 | 13F/A | CX Institutional | 67,511 | -25.26 | 5 | -20.00 | ||||
| 2025-07-18 | 13F | Warren Street Wealth Advisors, LLC | 170,913 | 5.28 | 11,508 | 14.33 | ||||
| 2025-08-11 | 13F | Principal Securities, Inc. | 4,921 | 428.57 | 331 | 501.82 | ||||
| 2025-04-01 | 13F | Hobart Private Capital, LLC | 0 | -100.00 | 0 | |||||
| 2025-08-11 | 13F | HighTower Advisors, LLC | 35,656 | -30.74 | 2,401 | -24.81 | ||||
| 2025-08-11 | 13F | TD Waterhouse Canada Inc. | 592 | 0.00 | 40 | 8.33 | ||||
| 2025-05-15 | 13F | Gts Securities Llc | 0 | -100.00 | 0 | |||||
| 2025-07-30 | 13F | Whittier Trust Co | 939 | 0.00 | 63 | 8.62 | ||||
| 2025-08-08 | 13F | Avantax Advisory Services, Inc. | 11,253 | 4.62 | 758 | 13.66 | ||||
| 2025-08-14 | 13F | Wells Fargo & Company/mn | 48,701 | 3.29 | 3,279 | 12.18 | ||||
| 2025-08-14 | 13F | Citadel Advisors Llc | 0 | -100.00 | 0 | |||||
| 2025-08-06 | 13F | First Horizon Advisors, Inc. | 118 | 8 | ||||||
| 2025-08-28 | NP | INKM - SPDR SSGA Income Allocation ETF This fund is a listed as child fund of State Street Corp and if that institution has disclosed ownership in this security, then these positions will not be double counted when calculating total shares and total value | 91,914 | -15.33 | 6,189 | -8.05 | ||||
| 2025-08-11 | 13F | Private Advisor Group, LLC | 3,112 | 210 | ||||||
| 2025-05-05 | 13F | Eagle Bay Advisors LLC | 0 | -100.00 | 0 | -100.00 | ||||
| 2025-08-18 | 13F | N.E.W. Advisory Services LLC | 319 | 0.00 | 21 | 10.53 | ||||
| 2025-08-12 | 13F | Pathstone Holdings, LLC | 28,902 | 8.16 | 1,946 | 17.52 | ||||
| 2025-09-04 | 13F/A | Advisor Group Holdings, Inc. | 6,018 | -4.51 | 405 | 3.85 | ||||
| 2025-04-28 | NP | MPAY - Akros Monthly Payout ETF | 1,881 | 911.29 | 114 | 927.27 | ||||
| 2025-08-27 | 13F/A | Brinker Capital Investments, LLC | 11,683 | 8.89 | 787 | 18.20 | ||||
| 2025-07-22 | 13F | Sage Financial Group Inc | 5,458 | -38.38 | 367 | -33.15 | ||||
| 2025-07-16 | 13F | Ascent Capital Management, LLC | 10,849 | 1.46 | 730 | 10.27 | ||||
| 2025-07-25 | 13F | NorthRock Partners, LLC | 1,125 | 0.00 | 76 | 8.70 | ||||
| 2025-08-14 | 13F | Bank Of America Corp /de/ | 20,358 | 11.50 | 1,371 | 21.02 | ||||
| 2025-08-11 | 13F | Ironsides Asset Advisors, LLC | 84,740 | -1.50 | 5,706 | 6.98 | ||||
| 2025-08-13 | 13F | Beacon Pointe Advisors, LLC | 71,598 | -0.79 | 4,821 | 7.73 | ||||
| 2025-08-13 | 13F | Consultiva Wealth Management, Corp. | 290 | 20 | ||||||
| 2025-08-14 | 13F | GWM Advisors LLC | 10 | 0.00 | 1 | |||||
| 2025-08-14 | 13F | State Street Corp | 51,700 | 53.87 | 3,481 | 67.11 | ||||
| 2025-08-08 | 13F | Pnc Financial Services Group, Inc. | 585 | 0.00 | 39 | 8.33 | ||||
| 2025-08-14 | 13F | Oxford Financial Group Ltd | 56,516 | -0.38 | 3,805 | 8.19 | ||||
| 2025-08-14 | 13F | Newport Capital Group, LLC | 31,363 | 1.22 | 2,112 | 9.89 | ||||
| 2025-08-12 | 13F | Park Square Financial Group, LLC | 10 | 1 | ||||||
| 2025-07-25 | 13F | Wealth Architects, LLC | 628,942 | 0.03 | 42,348 | 8.63 | ||||
| 2025-08-14 | 13F | Colony Group, LLC | 4,335 | 292 | ||||||
| 2025-08-08 | 13F | Cetera Investment Advisers | 15,355 | 98.18 | 1,034 | 115.21 | ||||
| 2025-08-12 | 13F | LPL Financial LLC | 483,305 | 44.13 | 32,542 | 56.53 | ||||
| 2025-08-13 | 13F | Nicolet Advisory Services, Llc | 14,203 | -16.01 | 958 | -5.34 | ||||
| 2025-08-07 | 13F | Rathbone Brothers plc | 48,439 | -1.68 | 3,261 | 6.78 | ||||
| 2025-07-23 | 13F | Nbt Bank N A /ny | 1 | 0.00 | 0 | |||||
| 2025-07-11 | 13F | Farther Finance Advisors, LLC | 157 | -0.63 | 11 | 11.11 | ||||
| 2025-08-12 | 13F | Proequities, Inc. | 0 | 0 | ||||||
| 2025-08-13 | 13F | Scotia Capital Inc. | 43,559 | -2.03 | 2,933 | 6.39 | ||||
| 2025-08-06 | 13F | Commonwealth Equity Services, Llc | 27,834 | 0.03 | 2 | 0.00 | ||||
| 2025-07-08 | 13F | Parallel Advisors, LLC | 300 | 0.00 | 20 | 11.11 | ||||
| 2025-07-23 | 13F | Castle Rock Wealth Management, LLC | 3,860 | -1.78 | 260 | 7.00 | ||||
| 2025-08-14 | 13F | Fmr Llc | 19,318 | -26.10 | 1,301 | -19.75 | ||||
| 2025-08-13 | 13F | Flow Traders U.s. Llc | 0 | -100.00 | 0 | |||||
| 2025-04-23 | 13F | Creative Financial Designs Inc /adv | 0 | -100.00 | 0 | -100.00 | ||||
| 2025-07-28 | 13F | Copia Wealth Management | 728 | 49 | ||||||
| 2025-08-19 | 13F | Advisory Services Network, LLC | 3,807 | 0.69 | 256 | 8.97 | ||||
| 2025-07-08 | 13F | Lowe Wealth Advisors, LLC | 28,112 | 56.92 | 1,893 | 70.45 | ||||
| 2025-08-07 | 13F | Allworth Financial LP | 0 | -100.00 | 0 | |||||
| 2025-08-14 | 13F | Mariner, LLC | 314,035 | 2.21 | 21,145 | 11.00 | ||||
| 2025-08-12 | 13F | Virtu Financial LLC | 0 | -100.00 | 0 | |||||
| 2025-08-05 | 13F | Hills Bank & Trust Co | 257,006 | 6.00 | 17,305 | 15.11 | ||||
| 2025-08-14 | 13F | Federation des caisses Desjardins du Quebec | 657 | 0.00 | 44 | 10.00 | ||||
| 2025-07-31 | 13F | Waldron Private Wealth LLC | 15,770 | 0.00 | 1,062 | 8.60 | ||||
| 2025-08-27 | NP | RLY - SPDR SSGA Multi-Asset Real Return ETF This fund is a listed as child fund of State Street Corp and if that institution has disclosed ownership in this security, then these positions will not be double counted when calculating total shares and total value | 1,731,681 | -2.45 | 116,598 | 5.94 | ||||
| 2025-07-14 | 13F | Park Avenue Securities Llc | 5,981 | 0 | ||||||
| 2025-08-08 | NP | QALTX - Quantified Alternative Investment Fund Investor Class Shares | 684 | -93.79 | 46 | -93.23 | ||||
| 2025-08-14 | 13F | Susquehanna International Group, Llp | 0 | -100.00 | 0 | |||||
| 2025-08-05 | 13F | Bank Of Montreal /can/ | 13,555 | -83.67 | 913 | -82.27 | ||||
| 2025-08-14 | 13F | Clark Capital Management Group, Inc. | 79,627 | 5,361 | ||||||
| 2025-08-13 | 13F | Jones Financial Companies Lllp | 3,725 | 3.67 | 249 | 12.22 | ||||
| 2025-08-12 | 13F | AlphaCore Capital LLC | 256 | 0.00 | 17 | 13.33 | ||||
| 2025-07-31 | 13F | Cambridge Investment Research Advisors, Inc. | 3,292 | 0 | ||||||
| 2025-07-30 | 13F | D.a. Davidson & Co. | 25,468 | 521.17 | 1,715 | 574.80 | ||||
| 2025-08-13 | 13F | Capital Analysts, Inc. | 350 | 0.00 | 0 | |||||
| 2025-08-13 | 13F | Baker Avenue Asset Management, LP | 123,269 | -5.40 | 8,300 | 2.72 | ||||
| 2025-07-29 | 13F | Private Trust Co Na | 138 | -12.66 | 9 | 0.00 | ||||
| 2025-07-29 | 13F | Sincerus Advisory, LLC | 7,276 | 13.05 | 491 | 22.81 | ||||
| 2025-08-01 | 13F | Envestnet Asset Management Inc | 61,761 | 210.09 | 4,159 | 236.95 |