HPP.PRC - Hudson Pacific Properties, Inc. - Preferred Stock Saham - Harga Saham, Kepemilikan Institusional, Pemegang Saham (NYSE)

Hudson Pacific Properties, Inc. - Preferred Stock
US ˙ NYSE

Mga Batayang Estadistika
Pemilik Institusional 20 total, 20 long only, 0 short only, 0 long/short - change of 0.00% MRQ
Alokasi Portofolio Rata-rata 0.4632 % - change of 9.52% MRQ
Saham Institusional (Jangka Panjang) 5,780,522 (ex 13D/G) - change of 0.01MM shares 0.20% MRQ
Nilai Institusional (Jangka Panjang) $ 79,466 USD ($1000)
Kepemilikan Institusional dan Pemegang Saham

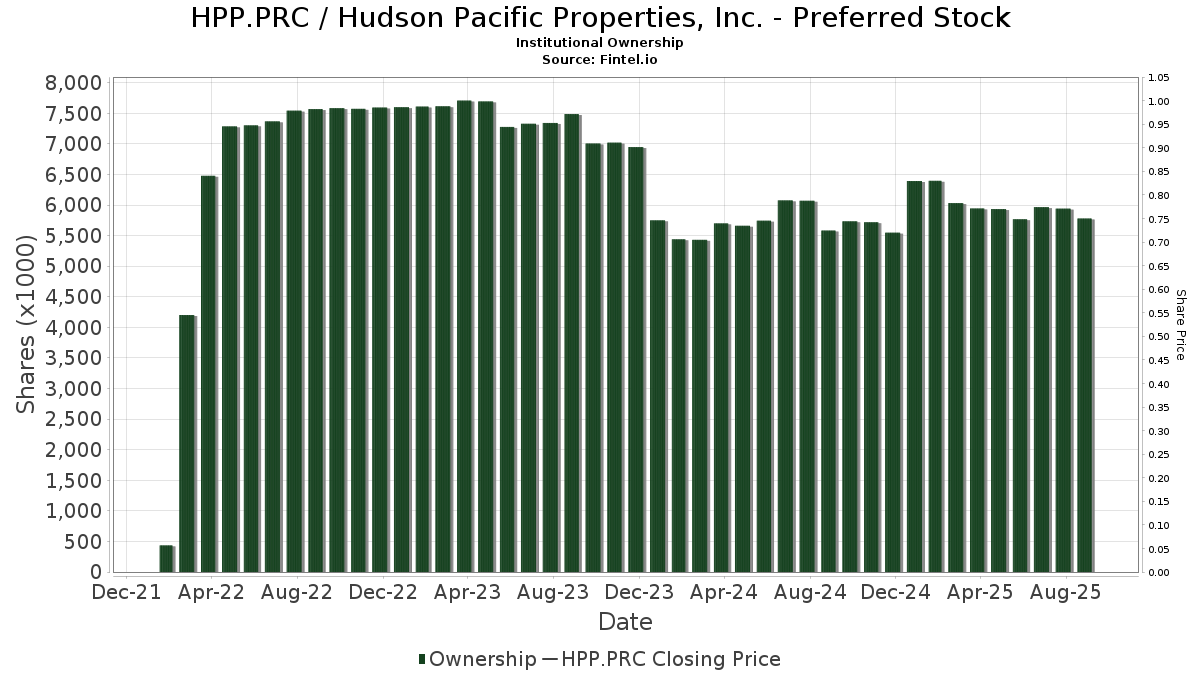
Hudson Pacific Properties, Inc. - Preferred Stock (US:HPP.PRC) memiliki 20 pemilik institusional dan pemegang saham yang telah mengajukan formulir 13D/G atau 13F kepada Komisi Bursa Efek (Securities Exchange Commission/SEC). Lembaga-lembaga ini memegang total 5,780,522 saham. Pemegang saham terbesar meliputi PFF - iShares Preferred and Income Securities ETF, PFFA - Virtus InfraCap U.S. Preferred Stock ETF, FRIFX - Fidelity Real Estate Income Fund, PGX - Invesco Preferred ETF, PFXF - VanEck Vectors Preferred Securities ex Financials ETF, KIFYX - Westwood Salient Select Income Fund Institutional Shares, PFFD - Global X U.S. Preferred ETF, Neuberger Berman Real Estate Securities Income Fund Inc, PFFR - InfraCap REIT Preferred ETF, and John Hancock Financial Opportunities Fund .

Struktur kepemilikan institusional Hudson Pacific Properties, Inc. - Preferred Stock (NYSE:HPP.PRC) menunjukkan posisi terkini di perusahaan oleh institusi dan dana, serta perubahan terbaru dalam ukuran posisi. Pemegang saham utama dapat mencakup investor individu, reksa dana, dana lindung nilai, atau institusi. Jadwal 13D menunjukkan bahwa investor memegang (atau pernah memegang) lebih dari 5% saham perusahaan dan bermaksud (atau pernah bermaksud) untuk secara aktif mengejar perubahan strategi bisnis. Jadwal 13G menunjukkan investasi pasif lebih dari 5%.

HPP.PRC / Hudson Pacific Properties, Inc. - Preferred Stock Institutional Ownership
Skor Sentimen Dana

Skor Sentimen Dana (sebelumnya dikenal sebagai Skor Akumulasi Kepemilikan) menemukan saham-saham yang paling banyak dibeli oleh dana. Ini adalah hasil dari model kuantitatif multi-faktor yang canggih yang mengidentifikasi perusahaan dengan tingkat akumulasi institusional tertinggi. Model penilaian menggunakan kombinasi dari total peningkatan pemilik yang diungkapkan, perubahan dalam alokasi portofolio pada pemilik tersebut, dan metrik lainnya. Angka berkisar dari 0 hingga 100, dengan angka yang lebih tinggi menunjukkan tingkat akumulasi yang lebih tinggi dibandingkan dengan perusahaan sejenisnya, dan 50 adalah rata-ratanya.

Frekuensi Pembaruan: Setiap Hari

Lihat Ownership Explorer, yang menyediakan daftar perusahaan dengan peringkat tertinggi.

Rasio Put/Call Institusional

Selain melaporkan isu ekuitas dan utang standar, institusi dengan aset di bawah manajemen lebih dari 100 juta dolar AS juga harus mengungkapkan kepemilikan opsi put dan call mereka. Karena opsi put umumnya menunjukkan sentimen negatif, dan opsi call menunjukkan sentimen positif, kita dapat mengetahui sentimen institusional secara keseluruhan dengan memplot rasio put terhadap call. Grafik di sebelah kanan memplot rasio put/call historis untuk instrumen ini.

Menggunakan Rasio Put/Call sebagai indikator sentimen investor mengatasi salah satu kekurangan utama dari penggunaan total kepemilikan institusional, yaitu sejumlah besar aset yang dikelola diinvestasikan secara pasif untuk melacak indeks. Dana yang dikelola secara pasif biasanya tidak membeli opsi, sehingga indikator rasio put/call lebih akurat dalam melacak sentimen dana yang dikelola secara aktif.

HPP.PRC / Hudson Pacific Properties, Inc. - Preferred Stock Historical Put/Call Ratio
Pengajuan 13F dan NPORT

Detail pada pengajuan 13F tersedia gratis. Detail pada pengajuan NP memerlukan keanggotaan premium. Baris berwarna hijau menunjukkan posisi baru. Baris berwarna merah menunjukkan posisi yang sudah ditutup. Klik tautan ini ikon untuk melihat riwayat transaksi selengkapnya.

Tingkatkan untuk membuka data premium dan mengekspor ke Excel .

Tanggal File Sumber Investor Ketik Presyo ng Avg
(Silangan)
Saham Δ Saham
(%)
Dilaporkan
Nilai
($1000)
Nilai Δ
(%)
Alokasi Port
(%)
2025-06-25 NP PFFR - InfraCap REIT Preferred ETF 149,098 -8.39 1,983 -12.64
2025-07-22 NP GPRF - Goldman Sachs Access U.S. Preferred Stock and Hybrid Securities ETF 6,814 29.45 84 20.00
2025-07-30 NP RIET - Hoya Capital High Dividend Yield ETF 23,786 28.99 294 18.15
2025-06-25 NP PFFA - Virtus InfraCap U.S. Preferred Stock ETF 1,143,274 0.91 15,206 -3.79
2025-08-26 NP Griffin Institutional Access Real Estate Fund 28,000 -34.50 416 -25.98
2025-08-29 NP SOAAX - Spirit Of America Real Estate Income And Growth Fund Class A 4,000 0.00 59 13.46
2025-08-21 NP PFXF - VanEck Vectors Preferred Securities ex Financials ETF 520,419 -10.82 7,733 0.70
2025-06-26 NP FRIFX - Fidelity Real Estate Income Fund This fund is a listed as child fund of Fmr Llc and if that institution has disclosed ownership in this security, then these positions will not be double counted when calculating total shares and total value 686,200 0.00 9,126 -3.91
2025-08-22 NP FSRRX - Fidelity Strategic Real Return Fund This fund is a listed as child fund of Fmr Llc and if that institution has disclosed ownership in this security, then these positions will not be double counted when calculating total shares and total value 18,100 0.00 269 12.55
2025-06-24 NP Neuberger Berman Real Estate Securities Income Fund Inc 186,404 27.32 2,479 21.40
2025-06-26 NP FSREX - Fidelity Series Real Estate Income Fund This fund is a listed as child fund of Fmr Llc and if that institution has disclosed ownership in this security, then these positions will not be double counted when calculating total shares and total value 22,900 0.00 305 -3.80
2025-04-29 NP PFFD - Global X U.S. Preferred ETF This fund is a listed as child fund of Mirae Asset Global Investments Co., Ltd. and if that institution has disclosed ownership in this security, then these positions will not be double counted when calculating total shares and total value 335,387 -0.98 4,518 -6.27
2025-08-28 NP Cohen & Steers Total Return Realty Fund Inc 4,697 0.00 70 13.11
2025-05-29 NP John Hancock Financial Opportunities Fund 118,838 0.00 1,564 -6.24
2025-07-29 NP PGX - Invesco Preferred ETF This fund is a listed as child fund of Invesco Ltd. and if that institution has disclosed ownership in this security, then these positions will not be double counted when calculating total shares and total value 652,303 -4.63 8,049 -12.62
2025-06-25 NP KIFYX - Westwood Salient Select Income Fund Institutional Shares 406,228 65.47 5,403 57.77
2025-08-26 NP PFF - iShares Preferred and Income Securities ETF This fund is a listed as child fund of BlackRock Inc. and if that institution has disclosed ownership in this security, then these positions will not be double counted when calculating total shares and total value 1,375,123 -5.71 20,434 6.48
2025-08-28 NP Cohen & Steers Quality Income Realty Fund Inc 40,939 0.00 608 13.01
2025-08-28 NP IPPP - Preferred-Plus ETF 3,012 0.00 45 12.82
2025-08-04 13F Iat Reinsurance Co Ltd. 55,000 0.00 829 12.79
Fintel data has been cited in the following publications:
Daily Mail Fox Business Business Insider Wall Street Journal The Washington Post Bloomberg Financial Times Globe and Mail
NASDAQ.com Reuters The Guardian Associated Press FactCheck.org Snopes Politifact
Federal Register The Intercept Forbes Fortune Magazine TheStreet Time Magazine Canadian Broadcasting Corporation International Business Times
Cambridge University Press Investopedia MarketWatch NY Daily News Entrepreneur Newsweek Barron's El Economista