Mga Batayang Estadistika
| Pemilik Institusional | 133 total, 133 long only, 0 short only, 0 long/short - change of 0.00% MRQ |
| Alokasi Portofolio Rata-rata | 0.1753 % - change of 16.90% MRQ |
| Saham Institusional (Jangka Panjang) | 2,121,175 (ex 13D/G) - change of 0.16MM shares 8.05% MRQ |
| Nilai Institusional (Jangka Panjang) | $ 217,438 USD ($1000) |
Kepemilikan Institusional dan Pemegang Saham
iShares Trust - iShares Global Financials ETF (US:IXG) memiliki 133 pemilik institusional dan pemegang saham yang telah mengajukan formulir 13D/G atau 13F kepada Komisi Bursa Efek (Securities Exchange Commission/SEC). Lembaga-lembaga ini memegang total 2,121,175 saham. Pemegang saham terbesar meliputi Morgan Stanley, Bank Of America Corp /de/, Pictet Asset Management Holding SA, Johnson Bixby & Associates, LLC, EWG Elevate Inc., Flow Traders U.s. Llc, Cambria Investment Management, L.P., Ameriprise Financial Inc, GMOM - Cambria Global Momentum ETF, and Banco Santander, S.A. .
Struktur kepemilikan institusional iShares Trust - iShares Global Financials ETF (ARCA:IXG) menunjukkan posisi terkini di perusahaan oleh institusi dan dana, serta perubahan terbaru dalam ukuran posisi. Pemegang saham utama dapat mencakup investor individu, reksa dana, dana lindung nilai, atau institusi. Jadwal 13D menunjukkan bahwa investor memegang (atau pernah memegang) lebih dari 5% saham perusahaan dan bermaksud (atau pernah bermaksud) untuk secara aktif mengejar perubahan strategi bisnis. Jadwal 13G menunjukkan investasi pasif lebih dari 5%.
The share price as of September 5, 2025 is 114.22 / share. Previously, on September 9, 2024, the share price was 92.23 / share. This represents an increase of 23.84% over that period.

Skor Sentimen Dana
Skor Sentimen Dana (sebelumnya dikenal sebagai Skor Akumulasi Kepemilikan) menemukan saham-saham yang paling banyak dibeli oleh dana. Ini adalah hasil dari model kuantitatif multi-faktor yang canggih yang mengidentifikasi perusahaan dengan tingkat akumulasi institusional tertinggi. Model penilaian menggunakan kombinasi dari total peningkatan pemilik yang diungkapkan, perubahan dalam alokasi portofolio pada pemilik tersebut, dan metrik lainnya. Angka berkisar dari 0 hingga 100, dengan angka yang lebih tinggi menunjukkan tingkat akumulasi yang lebih tinggi dibandingkan dengan perusahaan sejenisnya, dan 50 adalah rata-ratanya.
Frekuensi Pembaruan: Setiap Hari
Lihat Ownership Explorer, yang menyediakan daftar perusahaan dengan peringkat tertinggi.
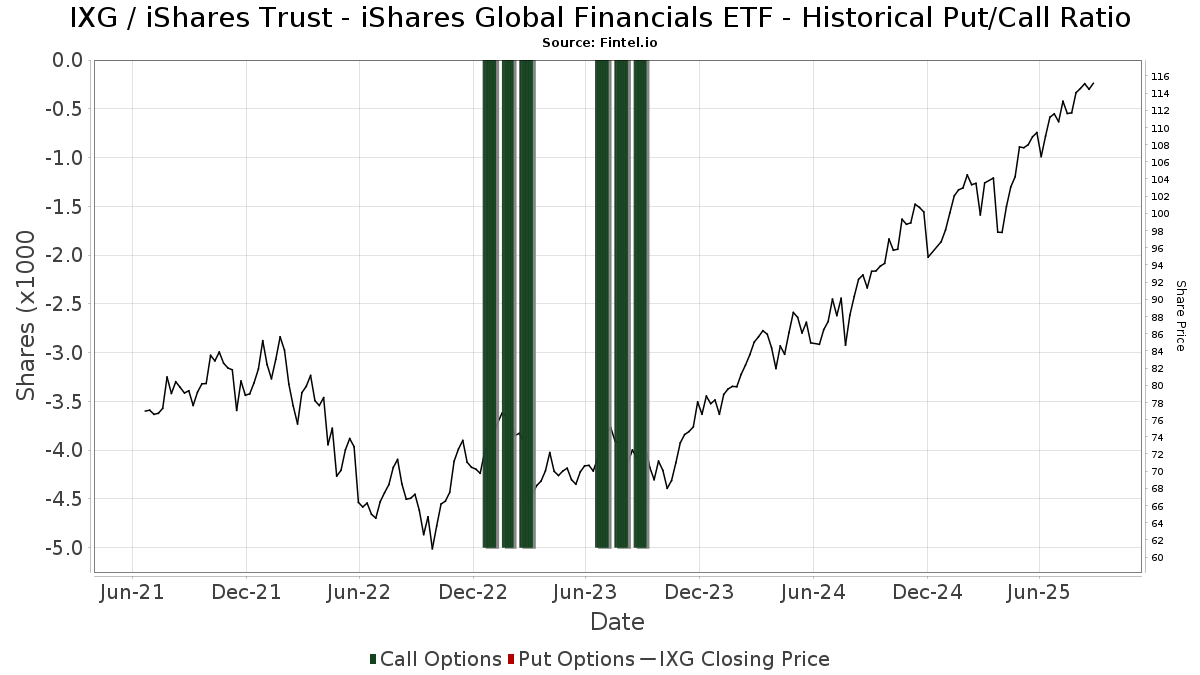
Rasio Put/Call Institusional
Selain melaporkan isu ekuitas dan utang standar, institusi dengan aset di bawah manajemen lebih dari 100 juta dolar AS juga harus mengungkapkan kepemilikan opsi put dan call mereka. Karena opsi put umumnya menunjukkan sentimen negatif, dan opsi call menunjukkan sentimen positif, kita dapat mengetahui sentimen institusional secara keseluruhan dengan memplot rasio put terhadap call. Grafik di sebelah kanan memplot rasio put/call historis untuk instrumen ini.
Menggunakan Rasio Put/Call sebagai indikator sentimen investor mengatasi salah satu kekurangan utama dari penggunaan total kepemilikan institusional, yaitu sejumlah besar aset yang dikelola diinvestasikan secara pasif untuk melacak indeks. Dana yang dikelola secara pasif biasanya tidak membeli opsi, sehingga indikator rasio put/call lebih akurat dalam melacak sentimen dana yang dikelola secara aktif.
Pengajuan 13F dan NPORT
Detail pada pengajuan 13F tersedia gratis. Detail pada pengajuan NP memerlukan keanggotaan premium. Baris berwarna hijau menunjukkan posisi baru. Baris berwarna merah menunjukkan posisi yang sudah ditutup. Klik tautan ini ikon untuk melihat riwayat transaksi selengkapnya.
Tingkatkan
untuk membuka data premium dan mengekspor ke Excel ![]() .
.
| Tanggal File | Sumber | Investor | Ketik | Presyo ng Avg (Silangan) |
Saham | Δ Saham (%) |
Dilaporkan Nilai ($1000) |
Nilai Δ (%) |
Alokasi Port (%) |
|
|---|---|---|---|---|---|---|---|---|---|---|
| 2025-08-14 | 13F | Integrated Wealth Concepts LLC | 2,755 | 11.40 | 305 | 20.08 | ||||
| 2025-07-14 | 13F | UMA Financial Services, Inc. | 88 | 46.67 | 10 | 50.00 | ||||
| 2025-07-10 | 13F | Wedmont Private Capital | 2,042 | 228 | ||||||
| 2025-09-04 | 13F/A | Advisor Group Holdings, Inc. | 20,884 | 2.31 | 2,316 | 9.98 | ||||
| 2025-08-12 | 13F | Gladstone Institutional Advisory LLC | 3,169 | 29.29 | 351 | 39.29 | ||||
| 2025-08-14 | 13F | Fmr Llc | 1,463 | 9.59 | 162 | 18.25 | ||||
| 2025-08-13 | 13F | Russell Investments Group, Ltd. | 125 | 0.00 | 14 | 8.33 | ||||
| 2025-08-13 | 13F | Flow Traders U.s. Llc | 74,100 | 8 | ||||||
| 2025-06-27 | NP | TRTY - Cambria Trinity ETF | 10,607 | -57.53 | 1,093 | -57.14 | ||||
| 2025-08-11 | 13F | Cornerstone Planning Group LLC | 15 | 0.00 | 2 | 0.00 | ||||
| 2025-08-05 | 13F | Advisors Preferred, LLC | 0 | -100.00 | 0 | |||||
| 2025-07-08 | 13F | Parallel Advisors, LLC | 0 | -100.00 | 0 | |||||
| 2025-07-29 | 13F | MPS Loria Financial Planners, LLC | 0 | -100.00 | 0 | |||||
| 2025-08-12 | 13F | Proequities, Inc. | 0 | 0 | ||||||
| 2025-08-19 | 13F | Anchor Investment Management, LLC | 10 | 0.00 | 1 | 0.00 | ||||
| 2025-08-14 | 13F | Ameriprise Financial Inc | 64,386 | 174.90 | 7,145 | 196.19 | ||||
| 2025-05-08 | 13F | ICICI Prudential Asset Management Co Ltd | 0 | -100.00 | 0 | |||||
| 2025-08-13 | 13F | M&t Bank Corp | 24,300 | 0.00 | 2,693 | 7.55 | ||||
| 2025-08-04 | 13F | Spire Wealth Management | 1,607 | -40.83 | 178 | -36.20 | ||||
| 2025-07-31 | 13F | Money Design Co.,Ltd. | 23,373 | -5.21 | 3 | 0.00 | ||||
| 2025-08-05 | 13F | Bank Of Montreal /can/ | 983 | 0.00 | 109 | 6.93 | ||||
| 2025-07-22 | 13F | Partners Wealth Management, Llc | 2,467 | 0.00 | 254 | -0.39 | ||||
| 2025-08-15 | 13F | Kestra Advisory Services, LLC | 8,517 | 9.15 | 944 | 17.43 | ||||
| 2025-07-15 | 13F | EWG Elevate Inc. | 101,304 | 946.31 | 11,226 | 1,025.98 | ||||
| 2025-08-08 | 13F | Larson Financial Group LLC | 100 | 0.00 | 11 | 10.00 | ||||
| 2025-05-01 | 13F | Quest 10 Wealth Builders, Inc. | 26 | 0.00 | 3 | 0.00 | ||||
| 2025-08-12 | 13F | Jpmorgan Chase & Co | 166 | -7.26 | 18 | 0.00 | ||||
| 2025-07-16 | 13F/A | CX Institutional | 44 | 0.00 | 0 | |||||
| 2025-08-08 | 13F | Comprehensive Financial Planning, Inc./PA | 0 | -100.00 | 0 | |||||
| 2025-08-06 | 13F | Commonwealth Equity Services, Llc | 6,185 | 18.65 | 1 | |||||
| 2025-08-13 | 13F | Fisher Asset Management, LLC | 6,680 | 6.68 | 740 | 14.73 | ||||
| 2025-08-06 | 13F | Richard Bernstein Advisors LLC | 2 | 0.00 | 0 | |||||
| 2025-08-14 | 13F | DZ BANK AG Deutsche Zentral Genossenschafts Bank, Frankfurt am Main | 7,640 | 0.00 | 847 | 7.50 | ||||
| 2025-07-17 | 13F | Sound Income Strategies, LLC | 481 | 0.00 | 53 | 8.16 | ||||
| 2025-08-14 | 13F | Snowden Capital Advisors LLC | 9,801 | 12.38 | 1,086 | 20.94 | ||||
| 2025-05-15 | 13F | Ancora Advisors, LLC | 0 | -100.00 | 0 | |||||
| 2025-07-18 | 13F | Client 1st Advisory Group, Llc | 1,812 | -10.43 | 201 | -3.85 | ||||
| 2025-07-31 | 13F/A | Avion Wealth | 151 | 0.00 | 0 | |||||
| 2025-08-14 | 13F | Sunbelt Securities, Inc. | 897 | 199.00 | 86 | 186.67 | ||||
| 2025-08-14 | 13F | UBS Group AG | 11,413 | -4.05 | 1,265 | 3.18 | ||||
| 2025-07-18 | 13F | Lynx Investment Advisory | 2,199 | -14.83 | 244 | -8.30 | ||||
| 2025-05-05 | 13F | Mandatum Life Insurance Co Ltd | 0 | -100.00 | 0 | -100.00 | ||||
| 2025-07-18 | 13F | Provident Wealth Management, LLC | 600 | 0.00 | 66 | 8.20 | ||||
| 2025-07-24 | 13F | Ronald Blue Trust, Inc. | 44 | 0.00 | 5 | 0.00 | ||||
| 2025-08-08 | 13F | SBI Securities Co., Ltd. | 308 | 9.22 | 34 | 17.24 | ||||
| 2025-07-16 | 13F | MontVue Capital Management, Inc. | 2,375 | 263 | ||||||
| 2025-07-28 | 13F | Harbour Investments, Inc. | 476 | -18.49 | 53 | -13.33 | ||||
| 2025-08-06 | 13F | AE Wealth Management LLC | 1 | -99.34 | 0 | -100.00 | ||||
| 2025-07-08 | 13F | Rise Advisors, LLC | 72 | 1.41 | 8 | 0.00 | ||||
| 2025-07-17 | 13F | Janney Montgomery Scott LLC | 7,644 | 27.91 | 1 | |||||
| 2025-08-12 | 13F | Coldstream Capital Management Inc | 0 | -100.00 | 0 | |||||
| 2025-08-12 | 13F | Edmond De Rothschild Holding S.a. | 335 | -23.52 | 37 | -17.78 | ||||
| 2025-07-28 | 13F | Founders Grove Wealth Partners, Llc | 16,468 | 9.98 | 1,825 | 18.29 | ||||
| 2025-07-17 | 13F | Johnson Bixby & Associates, LLC | 129,625 | 2.03 | 14,365 | 9.76 | ||||
| 2025-08-14 | 13F | Susquehanna International Group, Llp | 3,741 | 0.00 | 415 | 7.53 | ||||
| 2025-08-12 | 13F | Founders Financial Alliance, LLC | 300 | 0.00 | 33 | 10.00 | ||||
| 2025-08-07 | 13F | Flagship Wealth Advisors, Llc | 75 | 0.00 | 8 | 14.29 | ||||
| 2025-08-07 | 13F | Kestra Private Wealth Services, Llc | 2,360 | 262 | ||||||
| 2025-05-15 | 13F | Gts Securities Llc | 0 | -100.00 | 0 | |||||
| 2025-08-12 | 13F | Franklin Resources Inc | 510 | 0.00 | 57 | 7.69 | ||||
| 2025-08-13 | 13F | Jones Financial Companies Lllp | 3,262 | 54.09 | 360 | 65.90 | ||||
| 2025-05-05 | 13F | Lindbrook Capital, Llc | 0 | -100.00 | 0 | |||||
| 2025-08-07 | 13F | LOM Asset Management Ltd | 7,530 | 1 | ||||||
| 2025-05-08 | NP | QALTX - Quantified Alternative Investment Fund Investor Class Shares | 6,032 | -58.99 | 621 | -56.02 | ||||
| 2025-08-14 | 13F | Stifel Financial Corp | 1,877 | 208 | ||||||
| 2025-07-25 | 13F | Cwm, Llc | 2,633 | -9.71 | 0 | |||||
| 2025-08-13 | 13F | Cambria Investment Management, L.P. | 71,390 | -17.68 | 7,911 | -11.45 | ||||
| 2025-08-15 | 13F | Morgan Stanley | 406,602 | 2.59 | 45,060 | 10.35 | ||||
| 2025-08-07 | 13F | Resources Investment Advisors, LLC. | 2,012 | 223 | ||||||
| 2025-08-12 | 13F | SRS Capital Advisors, Inc. | 207 | 0.00 | 23 | 4.76 | ||||
| 2025-08-11 | 13F | Blue Bell Private Wealth Management, Llc | 15 | 0.00 | 2 | 0.00 | ||||
| 2025-05-16 | 13F | Coppell Advisory Solutions LLC | 0 | -100.00 | 0 | |||||
| 2025-08-13 | 13F | Cresset Asset Management, LLC | 18,824 | -27.06 | 2,086 | -21.52 | ||||
| 2025-08-12 | 13F | Steward Partners Investment Advisory, Llc | 599 | -8.83 | 66 | -1.49 | ||||
| 2025-08-08 | 13F | Hartland & Co., LLC | 650 | 0.00 | 72 | 9.09 | ||||
| 2025-07-24 | 13F | Blair William & Co/il | 230 | 0.00 | 25 | 8.70 | ||||
| 2025-08-18 | 13F/A | National Bank Of Canada /fi/ | 3,563 | -2.60 | 395 | 4.79 | ||||
| 2025-08-08 | 13F | Creative Planning | 4,860 | 0.00 | 539 | 7.60 | ||||
| 2025-07-17 | 13F | Beacon Capital Management, LLC | 1,091 | 1.30 | 121 | 9.09 | ||||
| 2025-08-14 | 13F | Bank Of America Corp /de/ | 282,050 | 12.81 | 31,257 | 21.35 | ||||
| 2025-08-13 | 13F | Pictet Asset Management Holding SA | 211,300 | -34.40 | 23,351 | -29.30 | ||||
| 2025-07-23 | 13F | Nbt Bank N A /ny | 304 | 0.00 | 34 | 6.45 | ||||
| 2025-07-29 | 13F | International Assets Investment Management, Llc | 2,639 | 0.00 | 292 | 7.75 | ||||
| 2025-08-13 | 13F | Cerity Partners LLC | 5,185 | -16.48 | 575 | -10.17 | ||||
| 2025-08-14 | 13F | Wells Fargo & Company/mn | 27,620 | 57.85 | 3,061 | 69.81 | ||||
| 2025-08-14 | 13F | CIBC World Markets Inc. | 2,360 | 0.00 | 262 | 7.41 | ||||
| 2025-06-27 | NP | GMOM - Cambria Global Momentum ETF | 60,783 | -8.93 | 6,265 | -8.09 | ||||
| 2025-07-31 | 13F | Sentinel Trust Co Lba | 15,800 | 0.00 | 2 | 0.00 | ||||
| 2025-08-26 | NP | Forethought Variable Insurance Trust - Global Atlantic BlackRock Selects Managed Risk Portfolio (formerly Global Atlantic BlackRock Global Allocation Managed Risk Portfolio) Global Atlantic BlackRock Global Allocation Managed Risk Portfolio | 42,054 | 54.76 | 4,660 | 66.49 | ||||
| 2025-05-09 | 13F | Emerald Investment Partners, Llc | 0 | -100.00 | 0 | |||||
| 2025-07-15 | 13F | Fifth Third Bancorp | 2,888 | 0.00 | 320 | 7.74 | ||||
| 2025-07-17 | 13F | Youngs Advisory Group, Inc. | 4,450 | 3.61 | 494 | 11.76 | ||||
| 2025-08-12 | 13F | Global Retirement Partners, LLC | 291 | 0.69 | 32 | 18.52 | ||||
| 2025-08-15 | 13F | Equitable Holdings, Inc. | 4,830 | -41.03 | 535 | -36.54 | ||||
| 2025-07-16 | 13F | Brown, Lisle/cummings, Inc. | 35 | 0.00 | 4 | 0.00 | ||||
| 2025-08-11 | 13F | Private Advisor Group, LLC | 6,327 | 3.94 | 701 | 11.80 | ||||
| 2025-08-18 | 13F | Front Row Advisors LLC | 2,015 | -11.08 | 223 | -4.29 | ||||
| 2025-08-12 | 13F | BlackRock, Inc. | 42,054 | 54.76 | 4,660 | 66.49 | ||||
| 2025-07-23 | 13F | Vontobel Holding Ltd. | 4,000 | -33.33 | 443 | -28.32 | ||||
| 2025-08-14 | 13F | Riggs Asset Managment Co. Inc. | 233 | 0.00 | 26 | 4.17 | ||||
| 2025-05-12 | 13F | Sandy Spring Bank | 398 | 0.00 | 41 | 7.89 | ||||
| 2025-07-21 | 13F | Mirae Asset Global Investments Co., Ltd. | 4,300 | -53.41 | 477 | -49.68 | ||||
| 2025-07-14 | 13F | AdvisorNet Financial, Inc | 112 | 1.82 | 12 | 9.09 | ||||
| 2025-08-14 | 13F | CoreCap Advisors, LLC | 6 | 0.00 | 1 | |||||
| 2025-08-04 | 13F | Creative Financial Designs Inc /adv | 26 | 4.00 | 3 | 0.00 | ||||
| 2025-08-01 | 13F | Envestnet Asset Management Inc | 5,421 | -4.17 | 601 | 3.09 | ||||
| 2025-08-14 | 13F | Comerica Bank | 1,276 | 4.33 | 141 | 12.80 | ||||
| 2025-07-29 | 13F | Signature Estate & Investment Advisors Llc | 2,264 | 0.98 | 251 | 8.23 | ||||
| 2025-08-08 | 13F | Pnc Financial Services Group, Inc. | 30 | 0.00 | 3 | 0.00 | ||||
| 2025-08-12 | 13F | Wayfinding Financial, LLC | 0 | -100.00 | 0 | |||||
| 2025-08-14 | 13F | Federation des caisses Desjardins du Quebec | 3,000 | 0.00 | 332 | 7.44 | ||||
| 2025-08-14 | 13F | Royal Bank Of Canada | 18,226 | 1.23 | 2,019 | 8.84 | ||||
| 2025-05-01 | 13F | Northwest Capital Management Inc | 0 | -100.00 | 0 | |||||
| 2025-08-08 | 13F | Cetera Investment Advisers | 2,741 | 6.24 | 304 | 14.34 | ||||
| 2025-08-11 | 13F | Citigroup Inc | 3,614 | -0.55 | 401 | 6.95 | ||||
| 2025-08-08 | 13F | Family Firm, Inc. | 0 | -100.00 | 0 | |||||
| 2025-08-14 | 13F | Mml Investors Services, Llc | 5,762 | -0.95 | 1 | |||||
| 2025-07-29 | 13F | JTC Employer Solutions Trusteee Ltd | 4,700 | 0.00 | 1 | |||||
| 2025-07-30 | 13F | D.a. Davidson & Co. | 2,516 | -21.64 | 279 | -15.76 | ||||
| 2025-07-28 | 13F | Rosenberg Matthew Hamilton | 2 | 0.00 | 0 | |||||
| 2025-08-11 | 13F | Principal Securities, Inc. | 73 | 8.96 | 8 | 33.33 | ||||
| 2025-08-12 | 13F | LPL Financial LLC | 35,027 | 13.95 | 3,882 | 22.58 | ||||
| 2025-07-31 | 13F | Optimum Investment Advisors | 0 | -100.00 | 0 | |||||
| 2025-08-06 | 13F | Kcm Investment Advisors Llc | 5,576 | 618 | ||||||
| 2025-08-14 | 13F | Citadel Advisors Llc | 43,735 | 99.62 | 4,847 | 114.71 | ||||
| 2025-07-22 | 13F | Sava Infond d.o.o. | 400 | 0.00 | 44 | 7.32 | ||||
| 2025-07-02 | 13F | Central Pacific Bank - Trust Division | 42 | 0.00 | 5 | 0.00 | ||||
| 2025-07-31 | 13F | Cambridge Investment Research Advisors, Inc. | 3,514 | -9.69 | 0 | |||||
| 2025-08-13 | 13F/A | StoneX Group Inc. | 4,044 | -23.78 | 321 | -24.29 | ||||
| 2025-07-29 | 13F | Salomon & Ludwin, LLC | 50,546 | -5.59 | 5,620 | 1.90 | ||||
| 2025-08-14 | 13F | Mercer Global Advisors Inc /adv | 2,141 | 237 | ||||||
| 2025-08-15 | 13F | Tower Research Capital LLC (TRC) | 1 | 0.00 | 0 | |||||
| 2025-08-14 | 13F | Arete Wealth Advisors, LLC | 0 | -100.00 | 0 | |||||
| 2025-07-28 | 13F | BRYN MAWR TRUST Co | 256 | -13.80 | 28 | -6.67 | ||||
| 2025-07-11 | 13F | Farther Finance Advisors, LLC | 1,055 | 103.67 | 117 | 118.87 | ||||
| 2025-07-31 | 13F | FSM Wealth Advisors, LLC | 4,075 | 453 | ||||||
| 2025-07-30 | 13F | Cookson Peirce & Co Inc | 4,122 | -4.03 | 457 | 3.17 | ||||
| 2025-08-11 | 13F | TD Waterhouse Canada Inc. | 291 | 0.00 | 32 | 10.34 | ||||
| 2025-08-01 | 13F | Banco Santander, S.A. | 56,968 | 3.17 | 6,313 | 10.99 | ||||
| 2025-08-14 | 13F | McIlrath & Eck, LLC | 2,425 | -6.30 | 269 | 0.75 | ||||
| 2025-04-21 | 13F | Ayalon Holdings Ltd. | 0 | -100.00 | 0 | |||||
| 2025-08-04 | 13F | Mesirow Financial Investment Management, Inc. | 2,775 | 0.00 | 308 | 7.72 | ||||
| 2025-08-06 | 13F | Atlantic Union Bankshares Corp | 403 | 45 | ||||||
| 2025-08-11 | 13F | HighTower Advisors, LLC | 8,094 | 0.65 | 897 | 8.21 | ||||
| 2025-08-04 | 13F | Assetmark, Inc | 210 | 14.13 | 23 | 27.78 | ||||
| 2025-08-14 | 13F | Warren Averett Asset Management, LLC | 2,327 | 0.00 | 258 | 7.53 | ||||
| 2025-08-13 | 13F | Northwestern Mutual Wealth Management Co | 3,858 | 10.17 | 428 | 18.61 | ||||
| 2025-08-14 | 13F | Jane Street Group, Llc | 16,464 | -50.43 | 1,825 | -46.68 | ||||
| 2025-08-14 | 13F | Raymond James Financial Inc | 10,757 | 54.60 | 1,192 | 66.48 | ||||
| 2025-08-05 | 13F | Strategic Financial Concepts, LLC | 2,200 | 0.00 | 244 | 7.52 | ||||
| 2025-07-31 | 13F | City State Bank | 1,425 | 16.33 | 158 | 24.60 | ||||
| 2025-08-14 | 13F | GWM Advisors LLC | 656 | 0.31 | 73 | 7.46 |