Mga Batayang Estadistika
| Pemilik Institusional | 100 total, 100 long only, 0 short only, 0 long/short - change of 1.01% MRQ |
| Alokasi Portofolio Rata-rata | 0.1771 % - change of 20.35% MRQ |
| Saham Institusional (Jangka Panjang) | 3,944,150 (ex 13D/G) - change of -0.19MM shares -4.51% MRQ |
| Nilai Institusional (Jangka Panjang) | $ 111,711 USD ($1000) |
Kepemilikan Institusional dan Pemegang Saham
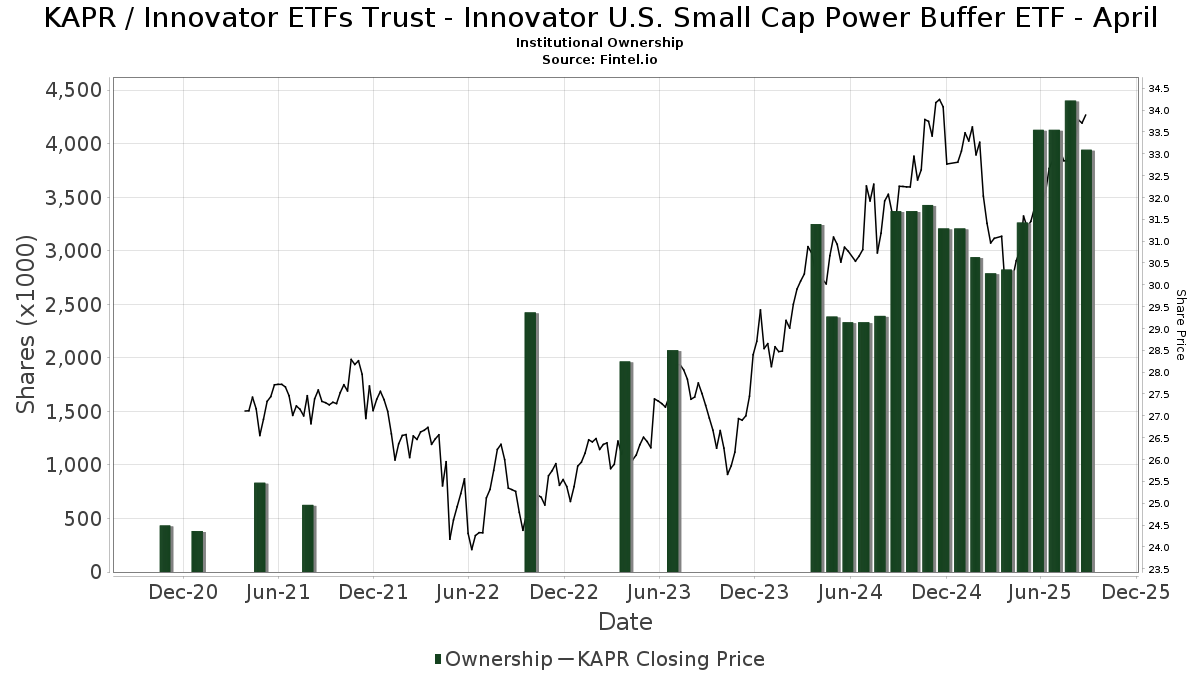
Innovator ETFs Trust - Innovator U.S. Small Cap Power Buffer ETF - April (US:KAPR) memiliki 100 pemilik institusional dan pemegang saham yang telah mengajukan formulir 13D/G atau 13F kepada Komisi Bursa Efek (Securities Exchange Commission/SEC). Lembaga-lembaga ini memegang total 3,944,150 saham. Pemegang saham terbesar meliputi Cetera Investment Advisers, Jane Street Group, Llc, Commonwealth Equity Services, Llc, Advisor Group Holdings, Inc., ODonnell Financial Services, LLC, Tradition Wealth Management, LLC, Kestra Advisory Services, LLC, Red Crane Wealth Management, Llc, Berkshire Money Management, Inc., and Blair William & Co/il .
Struktur kepemilikan institusional Innovator ETFs Trust - Innovator U.S. Small Cap Power Buffer ETF - April (BATS:KAPR) menunjukkan posisi terkini di perusahaan oleh institusi dan dana, serta perubahan terbaru dalam ukuran posisi. Pemegang saham utama dapat mencakup investor individu, reksa dana, dana lindung nilai, atau institusi. Jadwal 13D menunjukkan bahwa investor memegang (atau pernah memegang) lebih dari 5% saham perusahaan dan bermaksud (atau pernah bermaksud) untuk secara aktif mengejar perubahan strategi bisnis. Jadwal 13G menunjukkan investasi pasif lebih dari 5%.
The share price as of September 5, 2025 is 33.89 / share. Previously, on September 9, 2024, the share price was 31.37 / share. This represents an increase of 8.03% over that period.
Skor Sentimen Dana
Skor Sentimen Dana (sebelumnya dikenal sebagai Skor Akumulasi Kepemilikan) menemukan saham-saham yang paling banyak dibeli oleh dana. Ini adalah hasil dari model kuantitatif multi-faktor yang canggih yang mengidentifikasi perusahaan dengan tingkat akumulasi institusional tertinggi. Model penilaian menggunakan kombinasi dari total peningkatan pemilik yang diungkapkan, perubahan dalam alokasi portofolio pada pemilik tersebut, dan metrik lainnya. Angka berkisar dari 0 hingga 100, dengan angka yang lebih tinggi menunjukkan tingkat akumulasi yang lebih tinggi dibandingkan dengan perusahaan sejenisnya, dan 50 adalah rata-ratanya.
Frekuensi Pembaruan: Setiap Hari
Lihat Ownership Explorer, yang menyediakan daftar perusahaan dengan peringkat tertinggi.
Rasio Put/Call Institusional
Selain melaporkan isu ekuitas dan utang standar, institusi dengan aset di bawah manajemen lebih dari 100 juta dolar AS juga harus mengungkapkan kepemilikan opsi put dan call mereka. Karena opsi put umumnya menunjukkan sentimen negatif, dan opsi call menunjukkan sentimen positif, kita dapat mengetahui sentimen institusional secara keseluruhan dengan memplot rasio put terhadap call. Grafik di sebelah kanan memplot rasio put/call historis untuk instrumen ini.
Menggunakan Rasio Put/Call sebagai indikator sentimen investor mengatasi salah satu kekurangan utama dari penggunaan total kepemilikan institusional, yaitu sejumlah besar aset yang dikelola diinvestasikan secara pasif untuk melacak indeks. Dana yang dikelola secara pasif biasanya tidak membeli opsi, sehingga indikator rasio put/call lebih akurat dalam melacak sentimen dana yang dikelola secara aktif.
Pengajuan 13F dan NPORT
Detail pada pengajuan 13F tersedia gratis. Detail pada pengajuan NP memerlukan keanggotaan premium. Baris berwarna hijau menunjukkan posisi baru. Baris berwarna merah menunjukkan posisi yang sudah ditutup. Klik tautan ini ikon untuk melihat riwayat transaksi selengkapnya.
Tingkatkan
untuk membuka data premium dan mengekspor ke Excel ![]() .
.
| Tanggal File | Sumber | Investor | Ketik | Presyo ng Avg (Silangan) |
Saham | Δ Saham (%) |
Dilaporkan Nilai ($1000) |
Nilai Δ (%) |
Alokasi Port (%) |
|
|---|---|---|---|---|---|---|---|---|---|---|
| 2025-08-12 | 13F | LPL Financial LLC | 51,146 | 28.91 | 1,656 | 35.29 | ||||
| 2025-08-12 | 13F | Miller Financial Services LLC | 23,660 | -2.97 | 766 | 1.86 | ||||
| 2025-08-14 | 13F | Helium Advisors LLC | 11,222 | 363 | ||||||
| 2025-07-17 | 13F | Clear Point Advisors Inc. | 15,459 | 5.51 | 501 | 4.38 | ||||
| 2025-07-09 | 13F | Fragasso Group Inc. | 29,566 | 18.35 | 958 | 24.29 | ||||
| 2025-08-14 | 13F | Visionary Wealth Advisors | 9,452 | 306 | ||||||
| 2025-07-22 | 13F | Merit Financial Group, LLC | 16,829 | 545 | ||||||
| 2025-05-09 | 13F | Cary Street Partners Financial Llc | 0 | -100.00 | 0 | |||||
| 2025-07-22 | 13F | Berger Financial Group, Inc | 27,934 | 174.05 | 905 | 187.90 | ||||
| 2025-07-28 | 13F | Harbour Investments, Inc. | 4,221 | 25.96 | 137 | 32.04 | ||||
| 2025-08-14 | 13F | Wells Fargo & Company/mn | 753 | 0.00 | 24 | 4.35 | ||||
| 2025-08-07 | 13F | Allworth Financial LP | 2,553 | -99.61 | 83 | -99.59 | ||||
| 2025-07-30 | 13F | Brookstone Capital Management | 6,456 | 209 | ||||||
| 2025-07-16 | 13F | Crown Wealth Group, LLC | 0 | -100.00 | 0 | |||||
| 2025-08-15 | 13F | Morgan Stanley | 50 | 0.00 | 2 | 0.00 | ||||
| 2025-07-22 | 13F | Diligent Investors, LLC | 31,658 | -11.00 | 1,025 | -6.56 | ||||
| 2025-07-16 | 13F | PFS Partners, LLC | 23,363 | 4.76 | 757 | 10.04 | ||||
| 2025-08-07 | 13F | David R. Rahn & Associates Inc. | 92,851 | 3,007 | ||||||
| 2025-08-13 | 13F | Continuum Advisory, LLC | 0 | -100.00 | 0 | -100.00 | ||||
| 2025-08-11 | 13F | Blue Bell Private Wealth Management, Llc | 1,124 | 36 | ||||||
| 2025-07-31 | 13F | Gill Capital Partners, Llc | 6,808 | 0.00 | 220 | 4.76 | ||||
| 2025-08-14 | 13F | Ambassador Advisors, LLC | 25,905 | 839 | ||||||
| 2025-08-05 | 13F | Bank of New York Mellon Corp | 8,922 | -0.01 | 289 | 4.73 | ||||
| 2025-08-08 | 13F | Wealth Alliance | 23,639 | 5.78 | 766 | 11.03 | ||||
| 2025-08-01 | 13F | Corrado Advisors, Llc | 53,652 | 14.86 | 1,738 | 20.54 | ||||
| 2025-08-06 | 13F | AE Wealth Management LLC | 3,529 | -15.05 | 114 | -10.94 | ||||
| 2025-08-08 | 13F | Collaborative Wealth Managment Inc. | 9,504 | 308 | ||||||
| 2025-08-04 | 13F | Prairie Wealth Advisors, Inc. | 24,983 | 0.00 | 809 | 5.06 | ||||
| 2025-07-30 | 13F | Onyx Bridge Wealth Group LLC | 62,729 | 2,032 | ||||||
| 2025-08-05 | 13F | WorthPointe, LLC | 9,178 | 297 | ||||||
| 2025-07-16 | 13F | Signaturefd, Llc | 4,148 | 0.00 | 134 | 5.51 | ||||
| 2025-08-08 | 13F | Avantax Advisory Services, Inc. | 36,835 | 10.29 | 1,193 | 15.73 | ||||
| 2025-08-12 | 13F | Steward Partners Investment Advisory, Llc | 3,324 | -6.68 | 108 | -1.83 | ||||
| 2025-04-23 | 13F | Retirement Guys Formula Llc | 0 | -100.00 | 0 | -100.00 | ||||
| 2025-08-11 | 13F | Nations Financial Group Inc, /ia/ /adv | 18,061 | -0.86 | 585 | 4.10 | ||||
| 2025-08-12 | 13F | Proequities, Inc. | 0 | 0 | ||||||
| 2025-07-28 | 13F | Compass Advisory Group LLC | 27,343 | -4.54 | 886 | 0.23 | ||||
| 2025-08-08 | 13F | Pnc Financial Services Group, Inc. | 0 | -100.00 | 0 | |||||
| 2025-07-14 | 13F | AdvisorNet Financial, Inc | 17,158 | -0.21 | 556 | 4.72 | ||||
| 2025-08-05 | 13F | Sigma Planning Corp | 6,593 | 0.78 | 214 | 5.97 | ||||
| 2025-08-12 | 13F | Jacobi Capital Management LLC | 20,347 | -5.04 | 659 | -0.30 | ||||
| 2025-07-22 | 13F | Berkshire Money Management, Inc. | 101,740 | 3,295 | ||||||
| 2025-08-12 | 13F | Long Island Wealth Management, Inc. | 11,945 | 0.00 | 387 | 4.89 | ||||
| 2025-07-09 | 13F | Triumph Capital Management | 0 | -100.00 | 0 | |||||
| 2025-08-14 | 13F | Main Street Financial Solutions, LLC | 23,782 | 1.49 | 770 | 6.65 | ||||
| 2025-08-14 | 13F | Old Mission Capital Llc | 19,480 | 631 | ||||||
| 2025-08-06 | 13F | Valtinson Bruner Financial Planning LLC | 16,575 | -80.98 | 537 | -80.05 | ||||
| 2025-07-25 | 13F | Concurrent Investment Advisors, LLC | 13,054 | 0.00 | 423 | 4.98 | ||||
| 2025-07-30 | 13F | Strategic Blueprint, LLC | 9,027 | 0.85 | 292 | 5.80 | ||||
| 2025-08-14 | 13F | Jane Street Group, Llc | 454,632 | 14,724 | ||||||
| 2025-07-02 | 13F | HBW Advisory Services LLC | 0 | -100.00 | 0 | |||||
| 2025-08-14 | 13F | Arete Wealth Advisors, LLC | 8,913 | 10.04 | 0 | |||||
| 2025-08-08 | 13F | Gts Securities Llc | 0 | -100.00 | 0 | |||||
| 2025-08-12 | 13F | Leigh Baldwin & Co., Llc | 11,551 | -6.48 | 374 | -1.84 | ||||
| 2025-08-14 | 13F | Susquehanna International Group, Llp | 13,098 | -98.44 | 424 | -98.37 | ||||
| 2025-08-12 | 13F | Tradition Wealth Management, LLC | 137,984 | -1.08 | 4,469 | 3.83 | ||||
| 2025-08-19 | 13F | Advisory Services Network, LLC | 27,843 | 912 | ||||||
| 2025-07-24 | 13F | IFP Advisors, Inc | 6,123 | 40.89 | 198 | 47.76 | ||||
| 2025-07-18 | 13F | Truist Financial Corp | 16,500 | 0.65 | 534 | 5.74 | ||||
| 2025-08-12 | 13F | Wood Tarver Financial Group, LLC | 43,552 | 26.07 | 1 | -99.91 | ||||
| 2025-07-17 | 13F | Janney Montgomery Scott LLC | 29,093 | 0.87 | 1 | |||||
| 2025-07-17 | 13F | Global Trust Asset Management, LLC | 2,000 | 0.00 | 65 | 4.92 | ||||
| 2025-08-13 | 13F | Capital Analysts, Inc. | 26,202 | 0.00 | 1 | |||||
| 2025-07-22 | 13F | My Personal CFO, LLC | 12,731 | 0.00 | 412 | 5.10 | ||||
| 2025-08-11 | 13F | HighTower Advisors, LLC | 33,354 | -1.57 | 1,080 | 3.35 | ||||
| 2025-05-06 | 13F | Assetmark, Inc | 0 | -100.00 | 0 | |||||
| 2025-07-31 | 13F | Cardinal Point Capital Management, ULC | 7,360 | 0.00 | 238 | 4.85 | ||||
| 2025-08-08 | 13F | Cetera Investment Advisers | 513,384 | 222.77 | 16,626 | 238.89 | ||||
| 2025-07-30 | 13F | Red Crane Wealth Management, Llc | 103,688 | 360.45 | 3,358 | 383.72 | ||||
| 2025-08-14 | 13F | Raymond James Financial Inc | 98,604 | 55.48 | 3,193 | 63.24 | ||||
| 2025-07-21 | 13F | DHJJ Financial Advisors, Ltd. | 25,704 | 14.40 | 832 | 20.06 | ||||
| 2025-07-29 | 13F | Straight Path Wealth Management | 15,184 | 1.57 | 492 | 6.51 | ||||
| 2025-07-10 | 13F | Wealth Enhancement Advisory Services, Llc | 9,457 | 12.24 | 310 | 19.69 | ||||
| 2025-07-21 | 13F | Catalina Capital Group, LLC | 69,797 | 57.51 | 2,260 | 65.33 | ||||
| 2025-07-24 | 13F | Vantage Point Financial LLC | 8,691 | 0.00 | 281 | 4.85 | ||||
| 2025-08-13 | 13F | EverSource Wealth Advisors, LLC | 843 | 0.00 | 27 | 3.85 | ||||
| 2025-08-12 | 13F | NFP Retirement, Inc. | 11,049 | 0.00 | 358 | 5.00 | ||||
| 2025-07-29 | 13F | ODonnell Financial Services, LLC | 138,890 | -3.33 | 4,498 | 1.49 | ||||
| 2025-08-11 | 13F | Bellwether Advisors, LLC | 3,216 | 0.00 | 104 | 5.05 | ||||
| 2025-05-15 | 13F | Talon Private Wealth, LLC | 0 | -100.00 | 0 | -100.00 | ||||
| 2025-07-31 | 13F | Whipplewood Advisors, LLC | 0 | -100.00 | 0 | |||||
| 2025-08-13 | 13F | Townsquare Capital Llc | 0 | -100.00 | 0 | |||||
| 2025-08-14 | 13F | GWM Advisors LLC | 16,615 | 0.00 | 538 | 5.08 | ||||
| 2025-08-06 | 13F | Maltin Wealth Management, Inc. | 16,839 | -9.64 | 545 | -5.05 | ||||
| 2025-08-14 | 13F | Colony Group, LLC | 10,365 | 0.00 | 336 | 5.02 | ||||
| 2025-07-24 | 13F | Blair William & Co/il | 98,700 | -3.83 | 3,196 | 0.95 | ||||
| 2025-07-29 | 13F | Stratos Wealth Advisors, LLC | 12,124 | 0.00 | 393 | 4.81 | ||||
| 2025-07-22 | 13F | Beacon Financial Advisory LLC | 10,681 | 0.00 | 346 | 4.86 | ||||
| 2025-07-25 | 13F | Cwm, Llc | 43,749 | 2.75 | 1 | 0.00 | ||||
| 2025-08-01 | 13F | FSA Advisors, Inc. | 17,811 | 0.00 | 577 | 4.92 | ||||
| 2025-05-15 | 13F | Two Sigma Securities, Llc | 0 | -100.00 | 0 | -100.00 | ||||
| 2025-08-14 | 13F | Citadel Advisors Llc | 0 | -100.00 | 0 | |||||
| 2025-07-24 | 13F | Stonebridge Financial Group, LLC | 0 | -100.00 | 0 | |||||
| 2025-08-15 | 13F | Kestra Advisory Services, LLC | 130,446 | 34.62 | 4,225 | 41.32 | ||||
| 2025-07-15 | 13F | BCS Wealth Management | 14,231 | 20.41 | 0 | |||||
| 2025-08-14 | 13F | Acas, Llc | 18,039 | 7.06 | 604 | 17.09 | ||||
| 2025-07-29 | 13F | BKD Wealth Advisors, LLC | 17,624 | -5.74 | 571 | -1.04 | ||||
| 2025-08-12 | 13F | Weaver Consulting Group | 23,962 | 2.38 | 776 | 7.48 | ||||
| 2025-08-14 | 13F | CoreCap Advisors, LLC | 5,065 | 13.85 | 164 | 19.71 | ||||
| 2025-08-12 | 13F | Jpmorgan Chase & Co | 0 | -100.00 | 0 | |||||
| 2025-08-14 | 13F | EP Wealth Advisors, Inc. | 8,808 | -4.43 | 285 | 0.35 | ||||
| 2025-08-14 | 13F | Sunbelt Securities, Inc. | 22,806 | 0.82 | 746 | 6.89 | ||||
| 2025-07-31 | 13F | Cambridge Investment Research Advisors, Inc. | 56,207 | -21.12 | 2 | -50.00 | ||||
| 2025-08-01 | 13F | Envestnet Asset Management Inc | 17,745 | 6.65 | 575 | 11.89 | ||||
| 2025-08-06 | 13F | Founders Financial Securities Llc | 18,233 | 31.99 | 590 | 39.81 | ||||
| 2025-08-13 | 13F | Virtue Capital Management, LLC | 0 | -100.00 | 0 | |||||
| 2025-08-13 | 13F | Luminist Capital LLC | 7,861 | -5.68 | 255 | -1.17 | ||||
| 2025-08-18 | 13F | Geneos Wealth Management Inc. | 1,500 | 0.00 | 49 | 4.35 | ||||
| 2025-07-30 | 13F | Phoenix Holdings Ltd. | 6,750 | 218 | ||||||
| 2025-05-05 | 13F | Arq Wealth Advisors, Llc | 0 | -100.00 | 0 | |||||
| 2025-08-11 | 13F | Principal Securities, Inc. | 958 | -7.53 | 31 | -6.06 | ||||
| 2025-08-12 | 13F | BlackRock, Inc. | 1,657 | 54 | ||||||
| 2025-08-12 | 13F | Coldstream Capital Management Inc | 0 | -100.00 | 0 | |||||
| 2025-09-04 | 13F/A | Advisor Group Holdings, Inc. | 186,856 | 82.45 | 6,051 | 91.52 | ||||
| 2025-08-12 | 13F | Winnow Wealth Llc | 0 | -100.00 | 0 | -100.00 | ||||
| 2025-08-14 | 13F | Financial Network Wealth Advisors LLC | 9,900 | 0.00 | 321 | 4.92 | ||||
| 2025-08-12 | 13F | Archer Investment Corp | 10,492 | 0.00 | 340 | 4.95 | ||||
| 2025-08-14 | 13F | First Commonwealth Financial Corp /pa/ | 81,890 | 0.27 | 2,652 | 5.28 | ||||
| 2025-08-13 | 13F | SageView Advisory Group, LLC | 65,499 | 40.46 | 2,162 | 50.35 | ||||
| 2025-08-08 | 13F | Capital Investment Advisory Services, LLC | 512 | 0.00 | 17 | 6.67 | ||||
| 2025-08-06 | 13F | Commonwealth Equity Services, Llc | 274,224 | -11.53 | 9 | -11.11 |