Mga Batayang Estadistika
| Pemilik Institusional | 86 total, 86 long only, 0 short only, 0 long/short - change of -4.44% MRQ |
| Alokasi Portofolio Rata-rata | 0.4483 % - change of -0.85% MRQ |
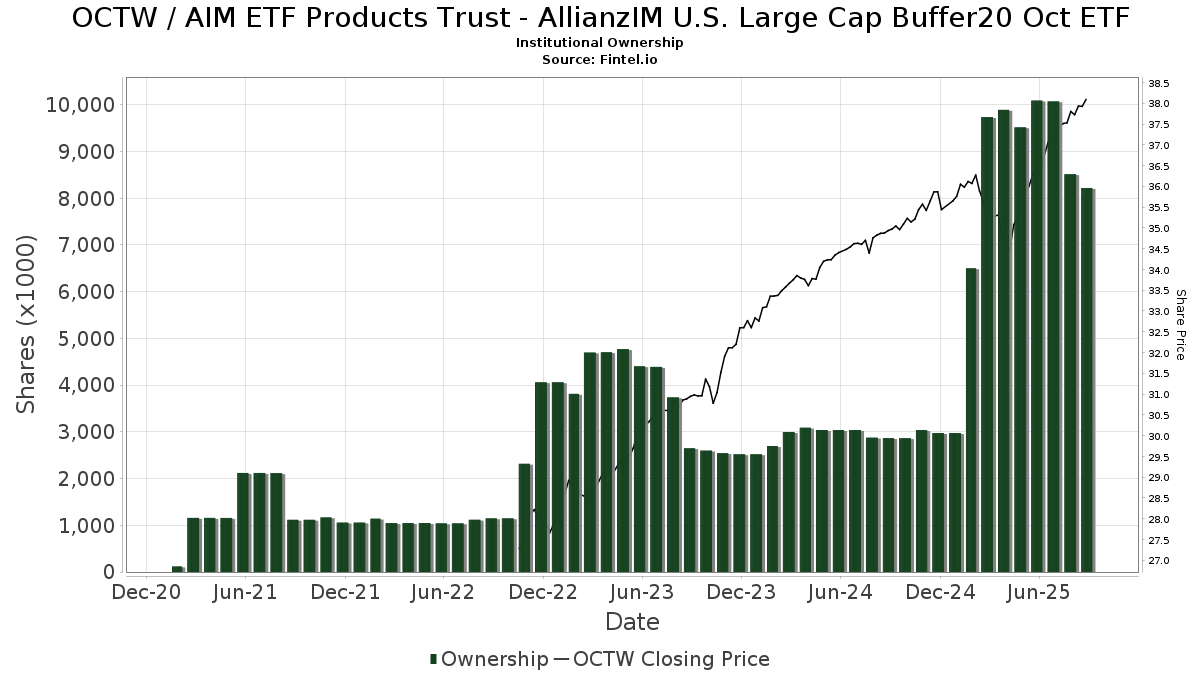
| Saham Institusional (Jangka Panjang) | 8,197,474 (ex 13D/G) - change of -1.89MM shares -18.77% MRQ |
| Nilai Institusional (Jangka Panjang) | $ 236,942 USD ($1000) |
Kepemilikan Institusional dan Pemegang Saham
AIM ETF Products Trust - AllianzIM U.S. Large Cap Buffer20 Oct ETF (US:OCTW) memiliki 86 pemilik institusional dan pemegang saham yang telah mengajukan formulir 13D/G atau 13F kepada Komisi Bursa Efek (Securities Exchange Commission/SEC). Lembaga-lembaga ini memegang total 8,197,474 saham. Pemegang saham terbesar meliputi AE Wealth Management LLC, Commonwealth Equity Services, Llc, Gradient Investments LLC, Centaurus Financial, Inc., Raymond James Financial Inc, Cetera Investment Advisers, Lloyd Advisory Services, LLC., Envestnet Asset Management Inc, Kestra Advisory Services, LLC, and Advisor Group Holdings, Inc. .
Struktur kepemilikan institusional AIM ETF Products Trust - AllianzIM U.S. Large Cap Buffer20 Oct ETF (ARCA:OCTW) menunjukkan posisi terkini di perusahaan oleh institusi dan dana, serta perubahan terbaru dalam ukuran posisi. Pemegang saham utama dapat mencakup investor individu, reksa dana, dana lindung nilai, atau institusi. Jadwal 13D menunjukkan bahwa investor memegang (atau pernah memegang) lebih dari 5% saham perusahaan dan bermaksud (atau pernah bermaksud) untuk secara aktif mengejar perubahan strategi bisnis. Jadwal 13G menunjukkan investasi pasif lebih dari 5%.
The share price as of September 5, 2025 is 38.04 / share. Previously, on September 6, 2024, the share price was 34.89 / share. This represents an increase of 9.04% over that period.
Skor Sentimen Dana
Skor Sentimen Dana (sebelumnya dikenal sebagai Skor Akumulasi Kepemilikan) menemukan saham-saham yang paling banyak dibeli oleh dana. Ini adalah hasil dari model kuantitatif multi-faktor yang canggih yang mengidentifikasi perusahaan dengan tingkat akumulasi institusional tertinggi. Model penilaian menggunakan kombinasi dari total peningkatan pemilik yang diungkapkan, perubahan dalam alokasi portofolio pada pemilik tersebut, dan metrik lainnya. Angka berkisar dari 0 hingga 100, dengan angka yang lebih tinggi menunjukkan tingkat akumulasi yang lebih tinggi dibandingkan dengan perusahaan sejenisnya, dan 50 adalah rata-ratanya.
Frekuensi Pembaruan: Setiap Hari
Lihat Ownership Explorer, yang menyediakan daftar perusahaan dengan peringkat tertinggi.
Rasio Put/Call Institusional
Selain melaporkan isu ekuitas dan utang standar, institusi dengan aset di bawah manajemen lebih dari 100 juta dolar AS juga harus mengungkapkan kepemilikan opsi put dan call mereka. Karena opsi put umumnya menunjukkan sentimen negatif, dan opsi call menunjukkan sentimen positif, kita dapat mengetahui sentimen institusional secara keseluruhan dengan memplot rasio put terhadap call. Grafik di sebelah kanan memplot rasio put/call historis untuk instrumen ini.
Menggunakan Rasio Put/Call sebagai indikator sentimen investor mengatasi salah satu kekurangan utama dari penggunaan total kepemilikan institusional, yaitu sejumlah besar aset yang dikelola diinvestasikan secara pasif untuk melacak indeks. Dana yang dikelola secara pasif biasanya tidak membeli opsi, sehingga indikator rasio put/call lebih akurat dalam melacak sentimen dana yang dikelola secara aktif.
Pengajuan 13F dan NPORT
Detail pada pengajuan 13F tersedia gratis. Detail pada pengajuan NP memerlukan keanggotaan premium. Baris berwarna hijau menunjukkan posisi baru. Baris berwarna merah menunjukkan posisi yang sudah ditutup. Klik tautan ini ikon untuk melihat riwayat transaksi selengkapnya.
Tingkatkan
untuk membuka data premium dan mengekspor ke Excel ![]() .
.
| Tanggal File | Sumber | Investor | Ketik | Presyo ng Avg (Silangan) |
Saham | Δ Saham (%) |
Dilaporkan Nilai ($1000) |
Nilai Δ (%) |
Alokasi Port (%) |
|
|---|---|---|---|---|---|---|---|---|---|---|
| 2025-08-12 | 13F | Long Island Wealth Management, Inc. | 60,525 | 155.53 | 2,240 | 169.55 | ||||
| 2025-08-14 | 13F | Jane Street Group, Llc | 23,024 | -91.92 | 852 | -91.49 | ||||
| 2025-08-14 | 13F | Main Street Financial Solutions, LLC | 6,369 | 0.00 | 236 | 5.38 | ||||
| 2025-08-01 | 13F | Envestnet Asset Management Inc | 270,887 | -10.52 | 10,026 | -5.71 | ||||
| 2025-08-12 | 13F | LPL Financial LLC | 48,067 | 17.18 | 1,779 | 23.47 | ||||
| 2025-05-16 | 13F | Coppell Advisory Solutions LLC | 0 | -100.00 | 0 | |||||
| 2025-08-14 | 13F | UBS Group AG | 11,675 | 336.78 | 432 | 364.52 | ||||
| 2025-07-23 | 13F | Castle Rock Wealth Management, LLC | 11,978 | 0.00 | 448 | 6.43 | ||||
| 2025-07-28 | 13F | WealthPlan Investment Management, LLC | 23,098 | 88.74 | 855 | 99.07 | ||||
| 2025-07-24 | 13F | IFP Advisors, Inc | 6,744 | 32.47 | 250 | 39.89 | ||||
| 2025-08-15 | 13F | Kestra Advisory Services, LLC | 258,912 | 7.92 | 9,582 | 13.73 | ||||
| 2025-05-15 | 13F | Old Mission Capital Llc | 0 | -100.00 | 0 | |||||
| 2025-08-12 | 13F | MAI Capital Management | 939 | 0.00 | 35 | 6.25 | ||||
| 2025-08-06 | 13F | AE Wealth Management LLC | 1,675,631 | -0.47 | 62,015 | 4.88 | ||||
| 2025-08-11 | 13F | Cornerstone Planning Group LLC | 0 | -100.00 | 0 | |||||
| 2025-08-06 | 13F | Csenge Advisory Group | 15,442 | -1.86 | 557 | 3.72 | ||||
| 2025-07-22 | 13F | Merit Financial Group, LLC | 9,294 | 344 | ||||||
| 2025-08-11 | 13F | Pineridge Advisors LLC | 54 | -93.08 | 2 | -96.30 | ||||
| 2025-08-14 | 13F | Raymond James Financial Inc | 347,334 | 2.44 | 12,855 | 7.95 | ||||
| 2025-08-14 | 13F/A | Barclays Plc | 168 | -16.00 | 0 | |||||
| 2025-08-11 | 13F | Private Advisor Group, LLC | 6,600 | 0.00 | 244 | 5.63 | ||||
| 2025-07-30 | 13F | LifeWealth Investments, LLC | 47,754 | 9.60 | 1,767 | 15.49 | ||||
| 2025-08-07 | 13F | Howard Bailey Securities, Llc | 70,950 | -2.44 | 2,626 | 2.78 | ||||
| 2025-08-12 | 13F | Allianz Investment Management U.S. LLC | 5,000 | 0.00 | 185 | 7.56 | ||||
| 2025-08-14 | 13F | Citadel Advisors Llc | 0 | -100.00 | 0 | |||||
| 2025-08-13 | 13F | Grantvest Financial Group LLC | 8,092 | -4.70 | 299 | 0.34 | ||||
| 2025-07-30 | 13F | Red Crane Wealth Management, Llc | 0 | -100.00 | 0 | |||||
| 2025-07-30 | 13F | Brookstone Capital Management | 6,065 | 224 | ||||||
| 2025-07-30 | 13F | Strategic Blueprint, LLC | 43,727 | 2.43 | 1,618 | 7.94 | ||||
| 2025-07-28 | 13F | Compass Advisory Group LLC | 69,363 | -0.67 | 2,567 | 4.69 | ||||
| 2025-08-08 | 13F | Foundations Investment Advisors, LLC | 7,290 | -18.09 | 270 | -13.78 | ||||
| 2025-08-07 | 13F | Blackston Financial Advisory Group, LLC | 16,847 | 53.50 | 624 | 61.82 | ||||
| 2025-08-04 | 13F | Spire Wealth Management | 18,353 | 0.00 | 679 | 5.43 | ||||
| 2025-07-18 | 13F | B.O.S.S. Retirement Advisors, LLC | 157,718 | -0.01 | 5,837 | 5.38 | ||||
| 2025-08-11 | 13F | Outlook Wealth Advisors, LLC | 112,161 | -1.14 | 4,151 | 4.19 | ||||
| 2025-08-13 | 13F | RIA Advisory Group LLC | 5,500 | 204 | ||||||
| 2025-08-11 | 13F | Nations Financial Group Inc, /ia/ /adv | 17,244 | -3.13 | 638 | 2.08 | ||||
| 2025-08-12 | 13F | Steward Partners Investment Advisory, Llc | 655 | 0.00 | 24 | 4.35 | ||||
| 2025-07-31 | 13F | FSR Wealth Management Ltd. | 134,231 | -0.53 | 4,968 | 4.81 | ||||
| 2025-07-22 | 13F | Diligent Investors, LLC | 7,910 | -11.22 | 293 | -6.41 | ||||
| 2025-05-01 | 13F | Quest 10 Wealth Builders, Inc. | 6,050 | 116.38 | 212 | 114.14 | ||||
| 2025-08-12 | 13F | Jpmorgan Chase & Co | 99 | -99.75 | 4 | -99.78 | ||||
| 2025-08-04 | 13F | Great Lakes Retirement, Inc. | 51,562 | -9.29 | 1,908 | -4.41 | ||||
| 2025-07-25 | 13F | Envestnet Portfolio Solutions, Inc. | 14,285 | -18.05 | 529 | -13.73 | ||||
| 2025-07-08 | 13F | Gradient Investments LLC | 1,031,815 | -59.08 | 38,187 | -56.88 | ||||
| 2025-07-31 | 13F | Cambridge Investment Research Advisors, Inc. | 42,321 | -19.10 | 2 | 0.00 | ||||
| 2025-08-07 | 13F | Panoramic Investment Advisors, Llc | 7,500 | 0.00 | 278 | 5.32 | ||||
| 2025-07-16 | 13F | Lloyd Advisory Services, LLC. | 285,949 | -4.43 | 10,583 | 0.70 | ||||
| 2025-08-12 | 13F | Park Square Financial Group, LLC | 8,523 | 196.45 | 315 | 215.00 | ||||
| 2025-08-13 | 13F | SMART Wealth LLC | 29,345 | 2.87 | 1,086 | 8.49 | ||||
| 2025-07-22 | 13F | Belpointe Asset Management LLC | 6,490 | 0.00 | 240 | 5.73 | ||||
| 2025-07-09 | 13F | Tounjian Advisory Partners, Llc | 66,384 | -2.83 | 2,331 | -2.83 | ||||
| 2025-07-08 | 13F | Paladin Wealth, LLC | 26,708 | -33.78 | 988 | -30.23 | ||||
| 2025-05-15 | 13F | Sentinus, LLC | 0 | -100.00 | 0 | |||||
| 2025-08-06 | 13F | Commonwealth Equity Services, Llc | 1,254,878 | 2.33 | 46 | 6.98 | ||||
| 2025-07-17 | 13F | HB Wealth Management, LLC | 9,908 | 0.00 | 367 | 5.48 | ||||
| 2025-07-28 | 13F | Harbour Investments, Inc. | 26,165 | -10.78 | 968 | -5.93 | ||||
| 2025-08-11 | 13F | Brown Brothers Harriman & Co | 1,500 | 0.00 | 56 | 5.77 | ||||
| 2025-08-12 | 13F | Proequities, Inc. | 0 | 0 | ||||||
| 2025-08-06 | 13F | Decker Retirement Planning Inc. | 837 | 119.69 | 31 | 130.77 | ||||
| 2025-06-25 | NP | AIM ETF Products Trust - AllianzIM Buffer20 Allocation ETF | 64,183 | 51.75 | 2,251 | 47.90 | ||||
| 2025-07-11 | 13F | Farther Finance Advisors, LLC | 2,144 | 0.00 | 79 | 5.33 | ||||
| 2025-08-13 | 13F | Transce3nd, LLC | 3,093 | -1.59 | 114 | 3.64 | ||||
| 2025-07-28 | 13F | WealthPLAN Partners, LLC | 8,291 | -57.87 | 307 | -55.72 | ||||
| 2025-07-23 | 13F | Secured Retirement Advisors, Llc | 33,395 | 4.64 | 1,236 | 10.27 | ||||
| 2025-07-14 | 13F | AdvisorNet Financial, Inc | 3,070 | 0.00 | 114 | 5.61 | ||||
| 2025-08-05 | 13F | Lord & Richards Wealth Management, LLC | 0 | -100.00 | 0 | |||||
| 2025-08-04 | 13F | Jim Saulnier & Associates, Llc | 8,140 | 0.00 | 301 | 5.61 | ||||
| 2025-08-15 | 13F | Brown Financial Advisors | 58,052 | -25.27 | 2,149 | -21.26 | ||||
| 2025-07-17 | 13F | Clear Point Advisors Inc. | 7,306 | 0.00 | 270 | 5.47 | ||||
| 2025-08-12 | 13F | Richard W. Paul & Associates, LLC | 153 | 0.00 | 6 | 0.00 | ||||
| 2025-08-11 | 13F | Kingdom Financial Group LLC. | 19,017 | 117.01 | 704 | 128.99 | ||||
| 2025-05-15 | 13F | Gts Securities Llc | 0 | -100.00 | 0 | |||||
| 2025-08-19 | 13F | Wealth Group, Ltd. | 0 | -100.00 | 0 | |||||
| 2025-07-10 | 13F | Focus Financial Network, Inc. | 13,535 | 13.94 | 501 | 19.90 | ||||
| 2025-08-14 | 13F | Susquehanna International Group, Llp | 0 | -100.00 | 0 | |||||
| 2025-07-21 | 13F | DHJJ Financial Advisors, Ltd. | 11,585 | -3.38 | 429 | 1.66 | ||||
| 2025-08-29 | 13F | Centaurus Financial, Inc. | 412,352 | -6.02 | 15 | 0.00 | ||||
| 2025-08-14 | 13F | CoreCap Advisors, LLC | 929 | -3.83 | 34 | 3.03 | ||||
| 2025-08-12 | 13F | Global Retirement Partners, LLC | 3,251 | 4.23 | 120 | 9.09 | ||||
| 2025-08-13 | 13F | Copley Financial Group, Inc. | 0 | -100.00 | 0 | |||||
| 2025-07-30 | 13F | Mid-American Wealth Advisory Group, Inc. | 146,222 | 10.31 | 5,412 | 16.24 | ||||
| 2025-08-14 | 13F | Mml Investors Services, Llc | 79,229 | 6.72 | 3 | 0.00 | ||||
| 2025-08-08 | 13F | Avantax Advisory Services, Inc. | 32,400 | 0.13 | 1,199 | 5.55 | ||||
| 2025-08-13 | 13F | GeoWealth Management, LLC | 59,270 | 21.49 | 2,194 | 28.02 | ||||
| 2025-05-02 | 13F | Capital A Wealth Management, LLC | 1,019 | -67.84 | 36 | -68.75 | ||||
| 2025-07-29 | 13F | Mattson Financial Services, LLC | 30,499 | -35.76 | 1,129 | -32.33 | ||||
| 2025-08-11 | 13F | Blue Bell Private Wealth Management, Llc | 114,194 | -0.71 | 4,226 | 4.63 | ||||
| 2025-05-12 | 13F | Fmr Llc | 0 | -100.00 | 0 | |||||
| 2025-07-25 | 13F | Atria Wealth Solutions, Inc. | 80,080 | -9.22 | 2,965 | -4.33 | ||||
| 2025-07-10 | 13F | Signal Advisors Wealth, LLC | 22,825 | 231.33 | 845 | 250.21 | ||||
| 2025-09-04 | 13F/A | Advisor Group Holdings, Inc. | 173,536 | -25.90 | 6,422 | -21.91 | ||||
| 2025-08-07 | 13F | PFG Advisors | 52,482 | -14.87 | 1,942 | -10.30 | ||||
| 2025-04-17 | 13F | Authentikos Wealth Advisory, LLC | 0 | -100.00 | 0 | |||||
| 2025-08-08 | 13F | Cetera Investment Advisers | 324,685 | -2.14 | 12,017 | 3.12 | ||||
| 2025-08-04 | 13F | Creative Financial Designs Inc /adv | 892 | 5.81 | 33 | 13.79 | ||||
| 2025-08-01 | 13F | FSA Advisors, Inc. | 25,030 | 20.49 | 926 | 27.02 | ||||
| 2025-08-14 | 13F | Diversify Advisory Services, LLC | 15,300 | 0.00 | 578 | 7.85 | ||||
| 2025-08-07 | 13F | Allworth Financial LP | 306 | 11 | ||||||
| 2025-08-14 | 13F | Certified Advisory Corp | 15,089 | -2.04 | 558 | 3.33 |