Mga Batayang Estadistika
| Pemilik Institusional | 172 total, 172 long only, 0 short only, 0 long/short - change of 16.11% MRQ |
| Alokasi Portofolio Rata-rata | 0.6971 % - change of -15.47% MRQ |
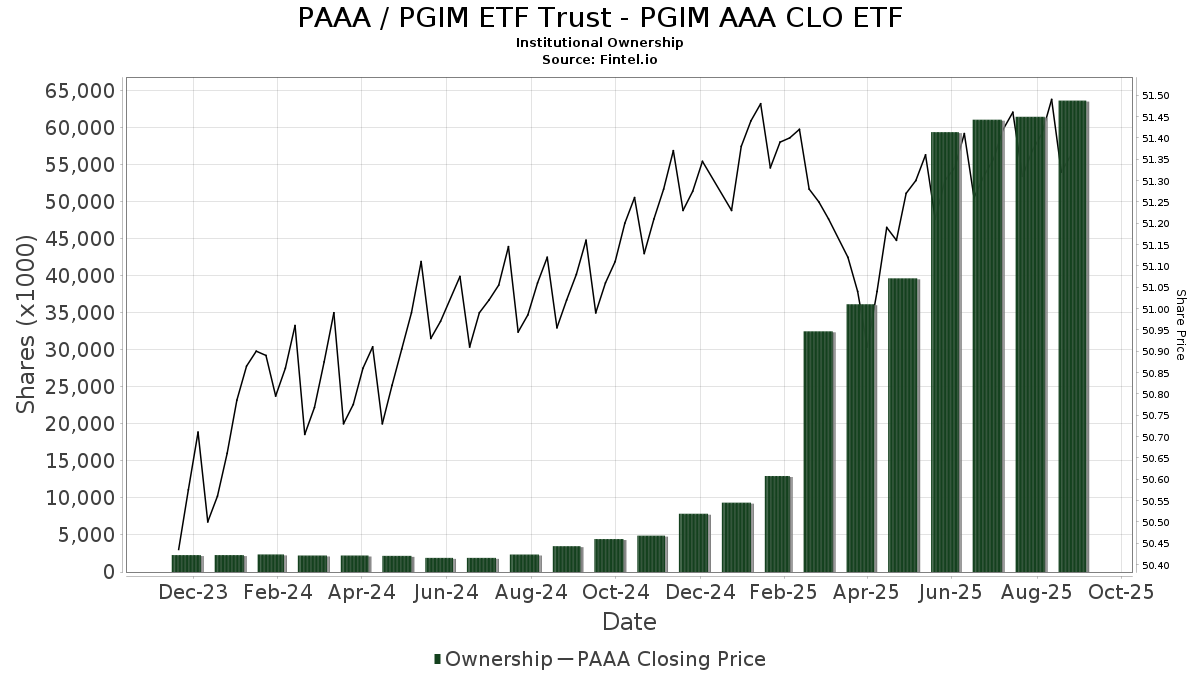
| Saham Institusional (Jangka Panjang) | 63,617,390 (ex 13D/G) - change of 4.26MM shares 7.17% MRQ |
| Nilai Institusional (Jangka Panjang) | $ 3,227,027 USD ($1000) |
Kepemilikan Institusional dan Pemegang Saham
PGIM ETF Trust - PGIM AAA CLO ETF (US:PAAA) memiliki 172 pemilik institusional dan pemegang saham yang telah mengajukan formulir 13D/G atau 13F kepada Komisi Bursa Efek (Securities Exchange Commission/SEC). Lembaga-lembaga ini memegang total 63,617,390 saham. Pemegang saham terbesar meliputi Prudential Financial Inc, Bank Of America Corp /de/, Morgan Stanley, LPL Financial LLC, JDYRX - PGIM HIGH YIELD FUND Class R, TAIBX - PGIM CORE BOND FUND Class Z, PULS - PGIM Ultra Short Bond ETF, PADAX - PGIM Absolute Return Bond Fund Class A, PDBAX - PGIM TOTAL RETURN BOND FUND Class A, and SDMAX - PGIM Short Duration Multi-Sector Bond Fund Class A .
Struktur kepemilikan institusional PGIM ETF Trust - PGIM AAA CLO ETF (ARCA:PAAA) menunjukkan posisi terkini di perusahaan oleh institusi dan dana, serta perubahan terbaru dalam ukuran posisi. Pemegang saham utama dapat mencakup investor individu, reksa dana, dana lindung nilai, atau institusi. Jadwal 13D menunjukkan bahwa investor memegang (atau pernah memegang) lebih dari 5% saham perusahaan dan bermaksud (atau pernah bermaksud) untuk secara aktif mengejar perubahan strategi bisnis. Jadwal 13G menunjukkan investasi pasif lebih dari 5%.
The share price as of September 5, 2025 is 51.35 / share. Previously, on September 9, 2024, the share price was 51.00 / share. This represents an increase of 0.69% over that period.
Skor Sentimen Dana
Skor Sentimen Dana (sebelumnya dikenal sebagai Skor Akumulasi Kepemilikan) menemukan saham-saham yang paling banyak dibeli oleh dana. Ini adalah hasil dari model kuantitatif multi-faktor yang canggih yang mengidentifikasi perusahaan dengan tingkat akumulasi institusional tertinggi. Model penilaian menggunakan kombinasi dari total peningkatan pemilik yang diungkapkan, perubahan dalam alokasi portofolio pada pemilik tersebut, dan metrik lainnya. Angka berkisar dari 0 hingga 100, dengan angka yang lebih tinggi menunjukkan tingkat akumulasi yang lebih tinggi dibandingkan dengan perusahaan sejenisnya, dan 50 adalah rata-ratanya.
Frekuensi Pembaruan: Setiap Hari
Lihat Ownership Explorer, yang menyediakan daftar perusahaan dengan peringkat tertinggi.
Rasio Put/Call Institusional
Selain melaporkan isu ekuitas dan utang standar, institusi dengan aset di bawah manajemen lebih dari 100 juta dolar AS juga harus mengungkapkan kepemilikan opsi put dan call mereka. Karena opsi put umumnya menunjukkan sentimen negatif, dan opsi call menunjukkan sentimen positif, kita dapat mengetahui sentimen institusional secara keseluruhan dengan memplot rasio put terhadap call. Grafik di sebelah kanan memplot rasio put/call historis untuk instrumen ini.
Menggunakan Rasio Put/Call sebagai indikator sentimen investor mengatasi salah satu kekurangan utama dari penggunaan total kepemilikan institusional, yaitu sejumlah besar aset yang dikelola diinvestasikan secara pasif untuk melacak indeks. Dana yang dikelola secara pasif biasanya tidak membeli opsi, sehingga indikator rasio put/call lebih akurat dalam melacak sentimen dana yang dikelola secara aktif.
Pengajuan 13F dan NPORT
Detail pada pengajuan 13F tersedia gratis. Detail pada pengajuan NP memerlukan keanggotaan premium. Baris berwarna hijau menunjukkan posisi baru. Baris berwarna merah menunjukkan posisi yang sudah ditutup. Klik tautan ini ikon untuk melihat riwayat transaksi selengkapnya.
Tingkatkan
untuk membuka data premium dan mengekspor ke Excel ![]() .
.
| Tanggal File | Sumber | Investor | Ketik | Presyo ng Avg (Silangan) |
Saham | Δ Saham (%) |
Dilaporkan Nilai ($1000) |
Nilai Δ (%) |
Alokasi Port (%) |
|
|---|---|---|---|---|---|---|---|---|---|---|
| 2025-08-27 | NP | SCFZX - PGIM Securitized Credit Fund Class Z | 725,000 | -35.56 | 37,301 | -35.38 | ||||
| 2025-08-13 | 13F | Raab & Moskowitz Asset Management LLC | 20,131 | 21.87 | 1,036 | 22.20 | ||||
| 2025-07-28 | 13F | Toews Corp /adv | 146,527 | 7,539 | ||||||
| 2025-08-13 | 13F | Mount Yale Investment Advisors, LLC | 3,997 | 206 | ||||||
| 2025-08-14 | 13F | Old Mission Capital Llc | 0 | -100.00 | 0 | |||||
| 2025-07-29 | NP | PSDM - PGIM Short Duration Multi-Sector Bond ETF | 75,000 | 4.46 | 3,855 | 4.36 | ||||
| 2025-08-08 | 13F | Pnc Financial Services Group, Inc. | 689,582 | 632.30 | 35,479 | 634.40 | ||||
| 2025-07-28 | 13F | J.Safra Asset Management Corp | 897 | 46 | ||||||
| 2025-08-14 | 13F/A | Rockefeller Capital Management L.P. | 784,825 | -3.22 | 40,379 | -2.96 | ||||
| 2025-08-14 | 13F | Great Valley Advisor Group, Inc. | 20,961 | 147.56 | 1,078 | 148.39 | ||||
| 2025-07-29 | NP | PULS - PGIM Ultra Short Bond ETF | 1,797,750 | 18.31 | 92,404 | 18.20 | ||||
| 2025-07-24 | 13F | MSH Capital Advisors LLC | 5,563 | -22.26 | 286 | -22.07 | ||||
| 2025-07-25 | 13F | Concurrent Investment Advisors, LLC | 80,313 | -79.71 | 4,132 | -79.65 | ||||
| 2025-08-14 | 13F | Raymond James Financial Inc | 843,900 | 30.90 | 43,419 | 31.26 | ||||
| 2025-05-08 | 13F | One Charles Private Wealth Services, LLC | 0 | -100.00 | 0 | -100.00 | ||||
| 2025-08-13 | 13F | EverSource Wealth Advisors, LLC | 294,821 | 19.90 | 15,169 | 20.23 | ||||
| 2025-08-14 | 13F | Mml Investors Services, Llc | 83,263 | 78.13 | 4 | 100.00 | ||||
| 2025-08-15 | 13F | Morgan Stanley | 3,128,135 | 15.02 | 160,943 | 15.33 | ||||
| 2025-08-14 | 13F | Wiley Bros.-aintree Capital, Llc | 3,908 | 241 | ||||||
| 2025-06-25 | NP | GTRAX - PGIM Global Total Return Fund Class A | 143,700 | 0.00 | 7,356 | -0.63 | ||||
| 2025-07-23 | 13F | Mraz, Amerine & Associates, Inc. | 27,178 | 271.03 | 1,398 | 272.80 | ||||
| 2025-08-12 | 13F | Proequities, Inc. | 0 | 0 | ||||||
| 2025-08-05 | 13F | Carolinas Wealth Consulting Llc | 0 | -100.00 | 0 | -100.00 | ||||
| 2025-08-11 | 13F | Principal Securities, Inc. | 1,069 | 55 | ||||||
| 2025-08-15 | 13F | Equitable Holdings, Inc. | 37,984 | 72.26 | 1,954 | 72.77 | ||||
| 2025-07-31 | 13F | Nilsine Partners, LLC | 157,036 | 13.18 | 8,080 | 13.49 | ||||
| 2025-08-06 | 13F | Middleton & Co Inc/ma | 84,010 | 2.25 | 4,322 | 2.54 | ||||
| 2025-08-12 | 13F | Financial Advocates Investment Management | 13,393 | -20.54 | 689 | -20.25 | ||||
| 2025-08-14 | 13F | Sunbelt Securities, Inc. | 0 | -100.00 | 0 | |||||
| 2025-07-29 | NP | PSH - PGIM Short Duration HIgh Yield ETF | 32,128 | 0.00 | 1,651 | -0.06 | ||||
| 2025-08-14 | 13F | Integrated Wealth Concepts LLC | 5,780 | 6.11 | 297 | 6.45 | ||||
| 2025-08-12 | 13F | BlueStem Wealth Partners, LLC | 0 | -100.00 | 0 | |||||
| 2025-08-12 | 13F | Prudential Financial Inc | 20,667,923 | 2.34 | 1,063,365 | 2.62 | ||||
| 2025-07-22 | 13F | Merit Financial Group, LLC | 42,857 | 66.58 | 2,205 | 66.97 | ||||
| 2025-08-13 | 13F | Saiph Capital, LLC | 4,863 | -25.74 | 250 | -25.60 | ||||
| 2025-08-13 | 13F | Basso Capital Management, L.p. | 90,000 | 4,630 | ||||||
| 2025-03-27 | NP | PAJBX - PGIM ESG Total Return Bond Fund Class R6 | 24,346 | 0.00 | 1,254 | 0.48 | ||||
| 2025-08-13 | 13F | Rsm Us Wealth Management Llc | 0 | -100.00 | 0 | |||||
| 2025-08-14 | 13F | Mpwm Advisory Solutions, Llc | 9,723 | 72.64 | 500 | 73.61 | ||||
| 2025-08-14 | 13F | Wells Fargo & Company/mn | 836,062 | 56.12 | 43,015 | 56.55 | ||||
| 2025-08-06 | 13F | New Millennium Group LLC | 0 | 0 | ||||||
| 2025-08-13 | 13F | Virtus Fixed Income Advisers, LLC | 22,155 | 1,140 | ||||||
| 2025-08-13 | 13F | Legacy Capital Wealth Partners, LLC | 7,095 | 0.00 | 365 | 0.27 | ||||
| 2025-07-16 | 13F | Register Financial Advisors LLC | 1,500 | 77 | ||||||
| 2025-07-16 | 13F | Essex Financial Services, Inc. | 78,736 | 75.63 | 4,051 | 76.09 | ||||
| 2025-07-29 | NP | PHYL - PGIM Active High Yield Bond ETF | 260,526 | 4.87 | 13,391 | 4.77 | ||||
| 2025-07-17 | 13F | Janney Montgomery Scott LLC | 53,336 | 71.60 | 3 | 100.00 | ||||
| 2025-08-01 | 13F | Pasadena Private Wealth, LLC | 19,407 | 998 | ||||||
| 2025-07-24 | 13F | IFP Advisors, Inc | 196,676 | -20.26 | 10,119 | -20.05 | ||||
| 2025-08-14 | 13F | UBS Group AG | 680,975 | 3.23 | 35,036 | 3.52 | ||||
| 2025-09-04 | 13F/A | Advisor Group Holdings, Inc. | 309,724 | -9.17 | 15,936 | -8.93 | ||||
| 2025-07-29 | NP | PAB - PGIM Active Aggregate Bond ETF | 63,525 | 6.19 | 3,265 | 6.11 | ||||
| 2025-08-13 | 13F | Virtus Investment Advisers, Inc. | 0 | -100.00 | 0 | |||||
| 2025-07-09 | 13F | Breakwater Capital Group | 13,537 | 696 | ||||||
| 2025-08-05 | 13F | Atlas Wealth LLC | 111,315 | 9.31 | 5,704 | 9.15 | ||||
| 2025-08-11 | 13F | Alteri Wealth LLC | 7,861 | 23.72 | 404 | 23.93 | ||||
| 2025-06-26 | NP | PHEAX - PGIM Global Total Return (USD Hedged) Fund Class A | 40,859 | 0.00 | 2,092 | -0.67 | ||||
| 2025-08-07 | 13F | Winch Advisory Services, LLC | 7 | 0 | ||||||
| 2025-08-15 | 13F | Asset Allocation Strategies LLC | 26,897 | 0.88 | 1,384 | 1.10 | ||||
| 2025-08-05 | 13F | Bridgewater Advisors Inc. | 4,498 | 231 | ||||||
| 2025-08-13 | 13F | Baird Financial Group, Inc. | 18,797 | 967 | ||||||
| 2025-07-11 | 13F | Farther Finance Advisors, LLC | 1,428 | 81.22 | 73 | 82.50 | ||||
| 2025-07-25 | 13F | We Are One Seven, LLC | 81,391 | 4.76 | 4,188 | 5.04 | ||||
| 2025-07-31 | 13F | Cambridge Investment Research Advisors, Inc. | 171,349 | 18.86 | 9 | 14.29 | ||||
| 2025-08-15 | 13F | Prevail Innovative Wealth Advisors, Llc | 31,365 | 1,614 | ||||||
| 2025-08-14 | 13F | Main Street Financial Solutions, LLC | 44,483 | -15.95 | 2,289 | -15.73 | ||||
| 2025-08-13 | 13F | Renaissance Technologies Llc | 857,693 | -22.68 | 44,128 | -22.47 | ||||
| 2025-07-23 | 13F | Country Club Bank /gfn | 158,582 | -0.25 | 8,159 | 0.12 | ||||
| 2025-08-27 | 13F/A | Brinker Capital Investments, LLC | 26,804 | 1,379 | ||||||
| 2025-07-25 | 13F | Priebe Wealth Holdings LLC | 15,610 | -32.12 | 803 | -31.89 | ||||
| 2025-08-01 | 13F | Brookwood Investment Group LLC | 0 | -100.00 | 0 | |||||
| 2025-08-15 | 13F/A | Symphony Financial, Ltd. Co. | 6,578 | 337 | ||||||
| 2025-08-13 | 13F | Vertex Planning Partners, LLC | 0 | -100.00 | 0 | |||||
| 2025-08-06 | 13F | Paladin Advisory Group, LLC | 467 | 0.00 | 24 | 4.35 | ||||
| 2025-08-12 | 13F | AlphaCore Capital LLC | 100 | 5 | ||||||
| 2025-08-14 | 13F | GWM Advisors LLC | 20,568 | 230.46 | 1,058 | 231.66 | ||||
| 2025-07-17 | 13F | KWB Wealth | 51,770 | 28.09 | 2,656 | 28.37 | ||||
| 2025-07-29 | NP | HYSAX - PGIM Short Duration High Yield Income Fund Class A | 925,000 | 0.00 | 47,545 | -0.10 | ||||
| 2025-07-10 | 13F | Community Trust & Investment Co | 194,741 | -0.79 | 10,019 | -0.52 | ||||
| 2025-08-13 | 13F | Quadrature Capital Ltd | 113,883 | 561.73 | 5,861 | 563.65 | ||||
| 2025-07-10 | 13F | Wealth Enhancement Advisory Services, Llc | 322,421 | 22.18 | 16,537 | 22.13 | ||||
| 2025-07-03 | 13F | Collective Family Office Llc | 25,728 | 60.25 | 1,324 | 60.75 | ||||
| 2025-07-18 | 13F | Cooper Financial Group | 9,001 | 2.27 | 463 | 2.66 | ||||
| 2025-08-06 | 13F | Able Wealth Management LLC | 8,232 | 424 | ||||||
| 2025-08-01 | 13F | Envestnet Asset Management Inc | 276,625 | -7.72 | 14,232 | -7.47 | ||||
| 2025-08-05 | 13F | Westside Investment Management, Inc. | 10,175 | 524 | ||||||
| 2025-08-07 | 13F | Kestra Private Wealth Services, Llc | 497,745 | 89.57 | 25,609 | 90.08 | ||||
| 2025-08-15 | 13F | Kestra Advisory Services, LLC | 55,528 | 19.97 | 2,857 | 20.30 | ||||
| 2025-08-14 | 13F | Comerica Bank | 6,815 | 86.56 | 351 | 87.17 | ||||
| 2025-07-21 | 13F | Andina Capital Management, LLC | 30,056 | 7.62 | 1,546 | 7.96 | ||||
| 2025-08-13 | 13F | Level Four Advisory Services, Llc | 107,286 | 5,520 | ||||||
| 2025-07-10 | 13F | Worth Asset Management, LLC | 20,377 | -2.16 | 1,048 | -1.87 | ||||
| 2025-08-08 | 13F | Cooper Capital Advisors LLC | 157,730 | -2.28 | 8,115 | -2.02 | ||||
| 2025-08-12 | 13F | Running Point Capital Advisors, LLC | 26,457 | 70.57 | 1,361 | 71.19 | ||||
| 2025-07-14 | 13F | Lakeshore Financial Planning, Inc. | 19,702 | 0.00 | 1,014 | 0.30 | ||||
| 2025-07-24 | 13F | Aurora Private Wealth, Inc. | 3,917 | 0 | ||||||
| 2025-07-22 | 13F | DAVENPORT & Co LLC | 13,771 | 92.60 | 709 | 93.44 | ||||
| 2025-08-12 | 13F | Steward Partners Investment Advisory, Llc | 189,436 | 236.04 | 9,747 | 237.00 | ||||
| 2025-08-08 | 13F | Cornerstone Advisors Asset Management, Inc | 18,906 | 1.35 | 973 | 1.57 | ||||
| 2025-08-12 | 13F | Inscription Capital, LLC | 183,522 | 9,442 | ||||||
| 2025-05-16 | 13F | Laidlaw Wealth Management LLC | 0 | -100.00 | 0 | |||||
| 2025-07-14 | 13F | U.S. Capital Wealth Advisors, LLC | 163,744 | 2.66 | 8,425 | 2.95 | ||||
| 2025-08-13 | 13F | Fiduciary Group LLC | 256,521 | 0.65 | 13,198 | 0.93 | ||||
| 2025-07-31 | 13F | Hartford Financial Management Inc. | 184,454 | 5.96 | 9,490 | 6.25 | ||||
| 2025-07-30 | 13F | D.a. Davidson & Co. | 19,750 | 0.00 | 1,016 | 0.30 | ||||
| 2025-07-21 | 13F | Ameritas Advisory Services, LLC | 185,436 | -63.25 | 9,541 | -63.15 | ||||
| 2025-08-06 | 13F | Commonwealth Equity Services, Llc | 538,487 | 57.47 | 28 | 58.82 | ||||
| 2025-08-13 | 13F | Denver Wealth Management, Inc. | 33,499 | 1,724 | ||||||
| 2025-08-12 | 13F | Jpmorgan Chase & Co | 733,258 | -38.79 | 37,726 | -38.63 | ||||
| 2025-07-15 | 13F | Sheets Smith Wealth Management | 10,789 | 26.29 | 555 | 26.71 | ||||
| 2025-07-24 | 13F | Ronald Blue Trust, Inc. | 6,046 | 91.51 | 311 | 93.17 | ||||
| 2025-07-28 | 13F | WealthPLAN Partners, LLC | 178,769 | 141.13 | 9,198 | 141.77 | ||||
| 2025-08-05 | 13F | Optivise Advisory Services LLC | 13,301 | 5.20 | 684 | 5.56 | ||||
| 2025-08-11 | 13F | Advisor Resource Council | 15,205 | 25.23 | 782 | 28.83 | ||||
| 2025-08-12 | 13F | Laurel Wealth Advisors LLC | 0 | -100.00 | 0 | |||||
| 2025-07-28 | 13F | Triton Wealth Management, PLLC | 86,855 | 1,776.32 | 4,467 | 1,792.37 | ||||
| 2025-07-29 | 13F | Private Trust Co Na | 6,446 | 28.92 | 332 | 29.30 | ||||
| 2025-07-31 | 13F | Oppenheimer & Co Inc | 19,801 | 26.91 | 1,019 | 27.25 | ||||
| 2025-08-07 | 13F | Nwam Llc | 11,223 | 15.39 | 578 | 15.63 | ||||
| 2025-08-04 | 13F | Atria Investments Llc | 33,339 | -62.02 | 1,715 | -61.92 | ||||
| 2025-04-29 | 13F | Hm Payson & Co | 29,359 | 0.00 | 1,506 | 0.20 | ||||
| 2025-08-08 | 13F | Kingsview Wealth Management, LLC | 96,658 | -22.37 | 4,973 | -22.15 | ||||
| 2025-07-23 | 13F | Prime Capital Investment Advisors, LLC | 24,500 | 9.13 | 1,261 | 9.47 | ||||
| 2025-06-25 | NP | PGIM Short Duration High Yield Opportunities Fund | 307,811 | 0.00 | 15,757 | -0.64 | ||||
| 2025-07-28 | 13F | Harbour Investments, Inc. | 19,503 | -9.14 | 1,003 | -8.90 | ||||
| 2025-07-29 | NP | JDYRX - PGIM HIGH YIELD FUND Class R | 1,867,500 | 22.90 | 95,990 | 22.78 | ||||
| 2025-08-14 | 13F | Pine Harbor Wealth Management, LLC | 538,354 | 9.72 | 27,698 | 10.02 | ||||
| 2025-08-12 | 13F | Accordant Advisory Group Inc | 0 | -100.00 | 0 | |||||
| 2025-07-18 | 13F | Truist Financial Corp | 155,613 | 2.45 | 8,006 | 2.73 | ||||
| 2025-08-06 | 13F | Golden State Wealth Management, LLC | 10,917 | 13.09 | 562 | 13.33 | ||||
| 2025-08-27 | NP | PIBAX - PGIM BALANCED FUND Class A | 203,465 | 0.00 | 10,468 | 0.28 | ||||
| 2025-07-10 | 13F | Secure Asset Management, LLC | 5,393 | 277 | ||||||
| 2025-08-07 | 13F | Americana Partners, LLC | 13,800 | 0.00 | 710 | 0.28 | ||||
| 2025-08-11 | 13F | Addison Capital Co | 17,009 | 20.67 | 875 | 21.02 | ||||
| 2025-08-14 | 13F | Royal Bank Of Canada | 165,508 | 195.27 | 8,515 | 196.07 | ||||
| 2025-07-10 | 13F | Signal Advisors Wealth, LLC | 106,608 | 894.11 | 5,485 | 897.09 | ||||
| 2025-08-12 | 13F | Calton & Associates, Inc. | 8,334 | 429 | ||||||
| 2025-07-14 | 13F | AdvisorNet Financial, Inc | 21,925 | 1,128 | ||||||
| 2025-07-07 | 13F | Trust Co Of Oklahoma | 6,985 | 0.00 | 359 | 0.28 | ||||
| 2025-08-12 | 13F | Integrated Advisors Network LLC | 7,376 | 379 | ||||||
| 2025-07-29 | NP | PTRB - PGIM Total Return Bond ETF | 416,656 | 4.44 | 21,416 | 4.35 | ||||
| 2025-07-29 | 13F | Stratos Wealth Partners, LTD. | 28,223 | 5.46 | 1,452 | 5.75 | ||||
| 2025-08-13 | 13F | Townsquare Capital Llc | 0 | -100.00 | 0 | |||||
| 2025-07-30 | 13F | Bogart Wealth, LLC | 290 | 15 | ||||||
| 2025-06-25 | NP | Prudential Short Duration High Yield Fund, Inc. | 303,020 | 0.00 | 15,512 | -0.64 | ||||
| 2025-08-14 | 13F | Citadel Advisors Llc | 278,138 | 14,310 | ||||||
| 2025-06-25 | NP | PDBAX - PGIM TOTAL RETURN BOND FUND Class A | 1,740,083 | 36.35 | 89,075 | 35.47 | ||||
| 2025-08-08 | 13F | Avantax Advisory Services, Inc. | 217,716 | 5.70 | 11,201 | 5.98 | ||||
| 2025-08-14 | 13F | Fiduciary Trust Co | 6,000 | 0.00 | 309 | 0.33 | ||||
| 2025-07-22 | 13F | Mascoma Wealth Management LLC | 488 | 0.00 | 25 | 0.00 | ||||
| 2025-08-12 | 13F | LPL Financial LLC | 2,894,780 | 11.90 | 148,936 | 12.21 | ||||
| 2025-08-14 | 13F | Stifel Financial Corp | 70,018 | 44.83 | 3,602 | 45.24 | ||||
| 2025-07-07 | 13F | Insight Wealth Strategies, LLC | 18,406 | -11.48 | 943 | -11.54 | ||||
| 2025-07-15 | 13F | Norden Group Llc | 1,284,302 | -22.43 | 66,077 | -22.22 | ||||
| 2025-08-11 | 13F | Private Advisor Group, LLC | 58,015 | 21.84 | 2,985 | 22.14 | ||||
| 2025-06-25 | NP | SDMAX - PGIM Short Duration Multi-Sector Bond Fund Class A | 1,495,772 | 15.62 | 76,569 | 14.87 | ||||
| 2025-07-09 | 13F | Fiduciary Alliance LLC | 15,673 | 806 | ||||||
| 2025-08-08 | 13F | Tanglewood Legacy Advisors, LLC | 203,754 | -9.54 | 10,483 | -9.29 | ||||
| 2025-07-25 | NP | PMSAX - Global Multi-Strategy Fund Class A | 35,525 | 1,826 | ||||||
| 2025-08-26 | NP | PSFRX - Virtus Newfleet Senior Floating Rate Fund Class A | 22,155 | 12.21 | 1,140 | 12.44 | ||||
| 2025-08-06 | 13F | Prospera Financial Services Inc | 56,457 | -9.24 | 2,905 | -8.99 | ||||
| 2025-08-14 | 13F | Potentia Wealth | 0 | -100.00 | 0 | |||||
| 2025-07-11 | 13F | Pinnacle Bancorp, Inc. | 212 | 11 | ||||||
| 2025-07-29 | 13F | Koshinski Asset Management, Inc. | 41,887 | 2.48 | 2,155 | 2.77 | ||||
| 2025-08-14 | 13F | Gotham Asset Management, LLC | 16,728 | 2.25 | 861 | 2.50 | ||||
| 2025-08-01 | 13F | Liberty Wealth Management Llc | 0 | -100.00 | 0 | -100.00 | ||||
| 2025-08-13 | 13F | Great Diamond Partners, LLC | 36,346 | 1,870 | ||||||
| 2025-08-14 | 13F | Bank Of America Corp /de/ | 5,219,399 | 21.80 | 268,538 | 22.13 | ||||
| 2025-08-14 | 13F | Objective Capital Management, LLC | 0 | -100.00 | 0 | |||||
| 2025-03-27 | NP | PGIJX - PGIM ESG Short Duration Multi-Sector Bond Fund C | 16,988 | 0.00 | 875 | 0.46 | ||||
| 2025-08-12 | 13F | J.w. Cole Advisors, Inc. | 27,864 | 103.86 | 1,434 | 104.42 | ||||
| 2025-08-08 | 13F | Creative Planning | 4,234 | 218 | ||||||
| 2025-05-14 | 13F | Jane Street Group, Llc | 0 | -100.00 | 0 | |||||
| 2025-08-08 | 13F | Principal Financial Group Inc | 35,525 | 32.80 | 1,828 | 33.16 | ||||
| 2025-06-26 | NP | TAIBX - PGIM CORE BOND FUND Class Z | 1,800,878 | 39.20 | 92,187 | 38.31 | ||||
| 2025-07-18 | 13F | Parsons Capital Management Inc/ri | 8,067 | 0.00 | 415 | 0.48 | ||||
| 2025-08-05 | 13F | Everest Management Corp. | 11,622 | -6.69 | 598 | -6.57 | ||||
| 2025-07-15 | 13F | Regatta Capital Group, Llc | 5,459 | 281 | ||||||
| 2025-08-04 | 13F | Flagship Harbor Advisors, Llc | 99,772 | -67.61 | 5,133 | -67.52 | ||||
| 2025-07-22 | 13F | Foguth Wealth Management, LLC. | 108,014 | 907.22 | 5,557 | 910.36 | ||||
| 2025-08-13 | 13F | Jones Financial Companies Lllp | 1,423,466 | 43.00 | 73,237 | 43.53 | ||||
| 2025-08-11 | 13F | Independent Advisor Alliance | 8,500 | 437 | ||||||
| 2025-05-14 | 13F | Flow Traders U.s. Llc | 0 | -100.00 | 0 | |||||
| 2025-07-03 | 13F | TrueWealth Advisors, LLC | 5,100 | -3.41 | 262 | -2.96 | ||||
| 2025-07-25 | 13F | Atria Wealth Solutions, Inc. | 9,254 | -33.74 | 476 | -33.52 | ||||
| 2025-08-04 | 13F | Integrity Alliance, Llc. | 9,240 | 475 | ||||||
| 2025-07-24 | 13F | Riverchase Wealth Management, Llc | 6,778 | 38.72 | 349 | 39.20 | ||||
| 2025-08-04 | 13F | WNY Asset Management, LLC | 7,521 | 387 | ||||||
| 2025-08-11 | 13F | HighTower Advisors, LLC | 147,081 | 21.58 | 7,567 | 21.93 | ||||
| 2025-08-14 | 13F | Acorn Wealth Advisors, LLC | 0 | -100.00 | 0 | |||||
| 2025-05-14 | 13F | Straightline Group Llc | 0 | -100.00 | 0 | |||||
| 2025-06-26 | NP | PADAX - PGIM Absolute Return Bond Fund Class A | 1,797,750 | 38.96 | 92,027 | 38.07 | ||||
| 2025-08-12 | 13F | MAI Capital Management | 10,400 | 1.24 | 535 | 1.52 | ||||
| 2025-07-29 | NP | PGVAX - PGIM GOVERNMENT INCOME FUND Class A | 25,000 | 1,285 |