Mga Batayang Estadistika
| Pemilik Institusional | 100 total, 100 long only, 0 short only, 0 long/short - change of 8.70% MRQ |
| Alokasi Portofolio Rata-rata | 0.3966 % - change of -13.64% MRQ |
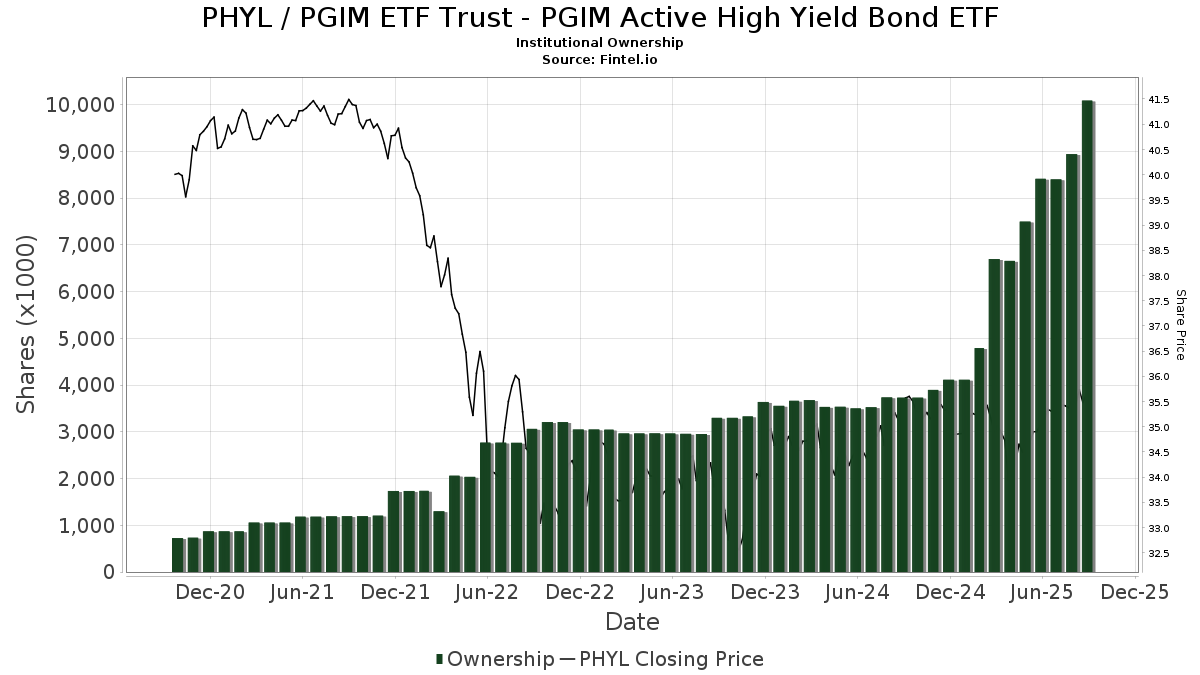
| Saham Institusional (Jangka Panjang) | 10,089,202 (ex 13D/G) - change of 1.67MM shares 19.89% MRQ |
| Nilai Institusional (Jangka Panjang) | $ 333,099 USD ($1000) |
Kepemilikan Institusional dan Pemegang Saham
PGIM ETF Trust - PGIM Active High Yield Bond ETF (US:PHYL) memiliki 100 pemilik institusional dan pemegang saham yang telah mengajukan formulir 13D/G atau 13F kepada Komisi Bursa Efek (Securities Exchange Commission/SEC). Lembaga-lembaga ini memegang total 10,089,202 saham. Pemegang saham terbesar meliputi Prudential Financial Inc, State of New Jersey Common Pension Fund D, PCLRX - PGIM INCOME BUILDER FUND Class R, Envestnet Asset Management Inc, Vestmark Advisory Solutions, Inc., Wright Fund Managment, LLC, LPL Financial LLC, Jpmorgan Chase & Co, Thrivent Financial For Lutherans, and Inspire Advisors, LLC .
Struktur kepemilikan institusional PGIM ETF Trust - PGIM Active High Yield Bond ETF (ARCA:PHYL) menunjukkan posisi terkini di perusahaan oleh institusi dan dana, serta perubahan terbaru dalam ukuran posisi. Pemegang saham utama dapat mencakup investor individu, reksa dana, dana lindung nilai, atau institusi. Jadwal 13D menunjukkan bahwa investor memegang (atau pernah memegang) lebih dari 5% saham perusahaan dan bermaksud (atau pernah bermaksud) untuk secara aktif mengejar perubahan strategi bisnis. Jadwal 13G menunjukkan investasi pasif lebih dari 5%.
The share price as of September 5, 2025 is 35.62 / share. Previously, on September 9, 2024, the share price was 35.27 / share. This represents an increase of 1.01% over that period.
Skor Sentimen Dana
Skor Sentimen Dana (sebelumnya dikenal sebagai Skor Akumulasi Kepemilikan) menemukan saham-saham yang paling banyak dibeli oleh dana. Ini adalah hasil dari model kuantitatif multi-faktor yang canggih yang mengidentifikasi perusahaan dengan tingkat akumulasi institusional tertinggi. Model penilaian menggunakan kombinasi dari total peningkatan pemilik yang diungkapkan, perubahan dalam alokasi portofolio pada pemilik tersebut, dan metrik lainnya. Angka berkisar dari 0 hingga 100, dengan angka yang lebih tinggi menunjukkan tingkat akumulasi yang lebih tinggi dibandingkan dengan perusahaan sejenisnya, dan 50 adalah rata-ratanya.
Frekuensi Pembaruan: Setiap Hari
Lihat Ownership Explorer, yang menyediakan daftar perusahaan dengan peringkat tertinggi.
Rasio Put/Call Institusional
Selain melaporkan isu ekuitas dan utang standar, institusi dengan aset di bawah manajemen lebih dari 100 juta dolar AS juga harus mengungkapkan kepemilikan opsi put dan call mereka. Karena opsi put umumnya menunjukkan sentimen negatif, dan opsi call menunjukkan sentimen positif, kita dapat mengetahui sentimen institusional secara keseluruhan dengan memplot rasio put terhadap call. Grafik di sebelah kanan memplot rasio put/call historis untuk instrumen ini.
Menggunakan Rasio Put/Call sebagai indikator sentimen investor mengatasi salah satu kekurangan utama dari penggunaan total kepemilikan institusional, yaitu sejumlah besar aset yang dikelola diinvestasikan secara pasif untuk melacak indeks. Dana yang dikelola secara pasif biasanya tidak membeli opsi, sehingga indikator rasio put/call lebih akurat dalam melacak sentimen dana yang dikelola secara aktif.
Pengajuan 13F dan NPORT
Detail pada pengajuan 13F tersedia gratis. Detail pada pengajuan NP memerlukan keanggotaan premium. Baris berwarna hijau menunjukkan posisi baru. Baris berwarna merah menunjukkan posisi yang sudah ditutup. Klik tautan ini ikon untuk melihat riwayat transaksi selengkapnya.
Tingkatkan
untuk membuka data premium dan mengekspor ke Excel ![]() .
.
| Tanggal File | Sumber | Investor | Ketik | Presyo ng Avg (Silangan) |
Saham | Δ Saham (%) |
Dilaporkan Nilai ($1000) |
Nilai Δ (%) |
Alokasi Port (%) |
|
|---|---|---|---|---|---|---|---|---|---|---|
| 2025-08-13 | 13F | Townsquare Capital Llc | 6,610 | -92.86 | 235 | -92.74 | ||||
| 2025-07-31 | 13F | Brinker Capital Investments, LLC | 0 | -100.00 | 0 | -100.00 | ||||
| 2025-08-05 | 13F | Claro Advisors LLC | 16,563 | -42.47 | 588 | -41.42 | ||||
| 2025-08-01 | 13F | Ashton Thomas Private Wealth, LLC | 7,806 | -28.75 | 277 | -27.30 | ||||
| 2025-08-06 | 13F | Commonwealth Equity Services, Llc | 30,215 | 43.59 | 1 | |||||
| 2025-08-12 | 13F | Global Retirement Partners, LLC | 3,988 | -25.47 | 142 | -23.78 | ||||
| 2025-07-07 | 13F | First Citizens Financial Corp | 37,314 | -4.49 | 1,324 | -2.65 | ||||
| 2025-09-04 | 13F/A | Advisor Group Holdings, Inc. | 45,971 | 62.59 | 1,632 | 65.58 | ||||
| 2025-07-23 | 13F | InTrack Investment Management Inc | 28,324 | 1,005 | ||||||
| 2025-08-14 | 13F | Gen-Wealth Partners Inc | 1,925 | -52.19 | 68 | -51.43 | ||||
| 2025-08-07 | 13F | PFG Advisors | 8,760 | 311 | ||||||
| 2025-07-07 | 13F | Global Wealth Strategies & Associates | 0 | -100.00 | 0 | |||||
| 2025-08-13 | 13F | Capital Analysts, Inc. | 28,295 | 649.93 | 1 | |||||
| 2025-08-12 | 13F | Jpmorgan Chase & Co | 309,024 | -11.15 | 10,967 | -9.44 | ||||
| 2025-08-14 | 13F | Raymond James Financial Inc | 48,570 | -10.20 | 1,724 | -8.50 | ||||
| 2025-08-14 | 13F | Mml Investors Services, Llc | 228,990 | 3.74 | 8 | 14.29 | ||||
| 2025-05-09 | 13F | Financial Connections Group, Inc. | 0 | -100.00 | 0 | |||||
| 2025-08-08 | 13F | Austin Wealth Management, LLC | 13,029 | 10.20 | 462 | 13.24 | ||||
| 2025-07-23 | 13F | Nbt Bank N A /ny | 35 | 0.00 | 1 | 0.00 | ||||
| 2025-07-25 | 13F | Envestnet Portfolio Solutions, Inc. | 0 | -100.00 | 0 | |||||
| 2025-08-08 | 13F | Wall Street Access Asset Management, LLC | 7,072 | -3.51 | 251 | 4.17 | ||||
| 2025-05-29 | NP | CPATX - Counterpoint Tactical Income Fund Class A Shares | 100,000 | 0.00 | 3,482 | 0.23 | ||||
| 2025-08-13 | 13F | Gibbs Wealth Management | 56,656 | 2,011 | ||||||
| 2025-08-11 | 13F | Inspire Advisors, LLC | 283,535 | 10,063 | ||||||
| 2025-07-30 | 13F | Strategic Blueprint, LLC | 16,808 | -57.10 | 597 | -56.30 | ||||
| 2025-08-07 | 13F | Resources Investment Advisors, LLC. | 50,228 | 549.19 | 1,783 | 562.45 | ||||
| 2025-08-12 | 13F | Proequities, Inc. | 0 | 0 | ||||||
| 2025-08-06 | 13F | Financial Advisory Corp /ut/ /adv | 29,875 | 6.49 | 1 | |||||
| 2025-08-08 | 13F | Pnc Financial Services Group, Inc. | 246,529 | 52.86 | 8,749 | 55.81 | ||||
| 2025-08-08 | 13F | Better Money Decisions, LLC | 14,250 | -3.01 | 506 | -1.17 | ||||
| 2025-07-28 | 13F | Harbour Investments, Inc. | 1,524 | -30.00 | 54 | -28.00 | ||||
| 2025-08-14 | 13F | Financial Network Wealth Advisors LLC | 1,642 | 0.00 | 58 | 1.75 | ||||
| 2025-08-04 | 13F | Spire Wealth Management | 0 | -100.00 | 0 | |||||
| 2025-08-27 | NP | PGFEX - PGIM Enhanced Retirement Spending Fund Class R6 | 4,826 | 4.80 | 171 | 6.88 | ||||
| 2025-07-16 | 13F | MBE Wealth Management, LLC | 20,626 | 5.63 | 732 | 7.81 | ||||
| 2025-08-06 | 13F | Vestmark Advisory Solutions, Inc. | 556,890 | 141.25 | 19,764 | 145.91 | ||||
| 2025-07-09 | 13F | PFW Advisors LLC | 131,236 | -0.44 | 4,658 | 1.48 | ||||
| 2025-08-04 | 13F | Capital Performance Advisors Llp | 51,951 | 56.80 | 1,844 | 59.84 | ||||
| 2025-07-29 | 13F | Horst & Graben Wealth Management LLC | 0 | -100.00 | 0 | |||||
| 2025-05-06 | 13F | Goodwin Investment Advisory | 0 | -100.00 | 0 | |||||
| 2025-07-18 | 13F | Truist Financial Corp | 8,411 | -36.48 | 299 | -35.36 | ||||
| 2025-04-22 | 13F | Spectrum Planning & Advisory Services Inc. | 0 | -100.00 | 0 | |||||
| 2025-08-14 | 13F | Wells Fargo & Company/mn | 199,497 | 16.40 | 7,080 | 18.65 | ||||
| 2025-08-06 | 13F | Hoxton Planning & Management, LLC | 23,491 | 834 | ||||||
| 2025-05-13 | 13F | Adams Wealth Management | 135,078 | 1.66 | 4,703 | 1.91 | ||||
| 2025-08-13 | 13F | EverSource Wealth Advisors, LLC | 93 | 9,200.00 | 3 | |||||
| 2025-08-14 | 13F | Smartleaf Asset Management LLC | 723 | 26 | ||||||
| 2025-05-13 | 13F | BlackDiamond Wealth Management Inc. | 0 | -100.00 | 0 | |||||
| 2025-07-14 | 13F | Counterpoint Mutual Funds LLC | 0 | -100.00 | 0 | |||||
| 2025-08-11 | 13F | Private Advisor Group, LLC | 0 | -100.00 | 0 | |||||
| 2025-05-13 | 13F | CacheTech Inc. | 142,881 | 7.54 | 4,703 | 1.91 | ||||
| 2025-07-10 | 13F | Signal Advisors Wealth, LLC | 157,783 | -16.10 | 5,600 | -14.48 | ||||
| 2025-08-14 | 13F | Fmr Llc | 16 | 166.67 | 1 | |||||
| 2025-08-14 | 13F | UBS Group AG | 10 | 0 | ||||||
| 2025-08-13 | 13F | Flow Traders U.s. Llc | 22,076 | 1 | ||||||
| 2025-08-07 | 13F | American Alpha Advisors, LLC | 144,702 | -15.10 | 5,135 | -13.46 | ||||
| 2025-08-28 | NP | Northern Lights Fund Trust - Sierra Tactical Bond Fund Investor Class Shares | 128,300 | -65.12 | 4,553 | -64.45 | ||||
| 2025-07-09 | 13F | Breakwater Capital Group | 57,722 | 95.85 | 2,049 | 99.61 | ||||
| 2025-08-15 | 13F | Morgan Stanley | 1,653 | 0.00 | 59 | 1.75 | ||||
| 2025-08-12 | 13F | LPL Financial LLC | 365,469 | -15.27 | 12,971 | -13.64 | ||||
| 2025-07-31 | 13F | State of New Jersey Common Pension Fund D | 775,000 | 63.16 | 27,505 | 66.30 | ||||
| 2025-08-01 | 13F | Austin Private Wealth, LLC | 0 | -100.00 | 0 | |||||
| 2025-07-31 | 13F | Wright Fund Managment, LLC | 367,800 | 0.00 | 12,807 | 0.00 | ||||
| 2025-08-14 | 13F | Stifel Financial Corp | 61,399 | 178.14 | 2,179 | 183.72 | ||||
| 2025-07-16 | 13F | Stephenson National Bank & Trust | 551 | 0.00 | 20 | 0.00 | ||||
| 2025-07-17 | 13F | Fifth Third Securities, Inc. | 106,091 | 5.12 | 3,765 | 7.14 | ||||
| 2025-07-17 | 13F | One Wealth Advisors, LLC | 5,872 | -67.91 | 208 | -67.35 | ||||
| 2025-07-28 | 13F | RFG Advisory, LLC | 80,335 | 2,851 | ||||||
| 2025-07-31 | 13F | Cambridge Investment Research Advisors, Inc. | 10,998 | 64.39 | 0 | |||||
| 2025-08-08 | 13F | Symphony Financial Services, Inc. | 8,292 | 1.16 | 295 | 3.16 | ||||
| 2025-08-01 | 13F | Alexander Labrunerie & Co., Inc. | 9,324 | 0.38 | 331 | 2.17 | ||||
| 2025-08-12 | 13F | PSI Advisors, LLC | 0 | -100.00 | 0 | |||||
| 2025-07-21 | 13F | Mendota Financial Group, LLC | 4,079 | 168.89 | 145 | 176.92 | ||||
| 2025-07-29 | NP | JDYRX - PGIM HIGH YIELD FUND Class R | 225,000 | 7,868 | ||||||
| 2025-08-12 | 13F | BlackRock, Inc. | 142 | -41.08 | 5 | -37.50 | ||||
| 2025-08-14 | 13F | Freedom Financial Partners LLC | 25,167 | 5.33 | 893 | 7.46 | ||||
| 2025-07-22 | 13F | Ellenbecker Investment Group | 94,744 | 24.04 | 3,362 | 26.44 | ||||
| 2025-08-27 | NP | PGFCX - PGIM Conservative Retirement Spending Fund Class R6 | 2,994 | 1.42 | 106 | 3.92 | ||||
| 2025-08-14 | 13F | Jane Street Group, Llc | 16,668 | 168.54 | 592 | 173.61 | ||||
| 2025-08-27 | NP | PGFMX - PGIM Moderate Retirement Spending Fund Class R6 | 3,041 | 1.94 | 108 | 3.88 | ||||
| 2025-08-06 | 13F | AE Wealth Management LLC | 87 | -59.91 | 3 | -57.14 | ||||
| 2025-06-25 | NP | PCLRX - PGIM INCOME BUILDER FUND Class R | 704,453 | -1.57 | 24,409 | -3.27 | ||||
| 2025-07-29 | 13F | Private Trust Co Na | 0 | -100.00 | 0 | |||||
| 2025-08-19 | 13F | Anchor Investment Management, LLC | 2,522 | 0.96 | 90 | 3.49 | ||||
| 2025-07-15 | 13F | Armis Advisers, LLC | 7,545 | -13.54 | 266 | -12.54 | ||||
| 2025-08-14 | 13F | Royal Bank Of Canada | 18,196 | 108.69 | 647 | 112.83 | ||||
| 2025-08-26 | 13F/A | Thrivent Financial For Lutherans | 288,680 | 10 | ||||||
| 2025-07-17 | 13F | KWB Wealth | 6,702 | 233 | ||||||
| 2025-08-08 | 13F | Advisory Resource Group | 122,821 | 6.17 | 4,359 | 8.19 | ||||
| 2025-08-11 | 13F | United Advisor Group, LLC | 21,144 | 750 | ||||||
| 2025-08-12 | 13F | Prudential Financial Inc | 1,896,065 | 32.94 | 66,656 | 32.94 | ||||
| 2025-08-05 | 13F | Integrity Financial Corp /WA | 20,685 | 734 | ||||||
| 2025-08-12 | 13F | J.w. Cole Advisors, Inc. | 26,853 | 32.40 | 953 | 34.99 | ||||
| 2025-08-07 | 13F | Hughes Financial Services, LLC | 1,111 | -99.51 | 39 | -99.50 | ||||
| 2025-08-13 | 13F | Alerus Financial Na | 6 | 0 | ||||||
| 2025-08-04 | 13F | Creative Financial Designs Inc /adv | 3,368 | -18.82 | 120 | -17.36 | ||||
| 2025-08-01 | 13F | Envestnet Asset Management Inc | 680,797 | 21.87 | 24,161 | 24.21 | ||||
| 2025-07-25 | 13F | Atria Wealth Solutions, Inc. | 0 | -100.00 | 0 | |||||
| 2025-07-22 | 13F | Foguth Wealth Management, LLC. | 161,000 | -18.14 | 5,714 | -16.57 | ||||
| 2025-07-22 | 13F | Ffg Retirement Advisors Llc | 35,605 | -24.88 | 1,264 | -23.45 | ||||
| 2025-07-09 | 13F | Fjell Capital, LLC | 51,238 | -43.46 | 1,818 | -42.38 | ||||
| 2025-08-11 | 13F | Aptus Capital Advisors, LLC | 28 | 0.00 | 1 | |||||
| 2025-08-14 | 13F | Hilltop Holdings Inc. | 9,480 | -9.44 | 336 | -7.69 | ||||
| 2025-07-29 | NP | FRFAX - PGIM Floating Rate Income Fund Class A | 225,000 | 12.50 | 7,868 | 11.00 | ||||
| 2025-08-01 | 13F | Schmidt P J Investment Management Inc | 35,963 | 1,276 | ||||||
| 2025-08-05 | 13F | Milestone Asset Management, Llc | 14,035 | 12.68 | 498 | 15.01 | ||||
| 2025-08-13 | 13F | Jones Financial Companies Lllp | 32,835 | 1,163 | ||||||
| 2025-07-14 | 13F | Park Avenue Securities Llc | 0 | -100.00 | 0 | -100.00 | ||||
| 2025-08-04 | 13F | Integrity Alliance, Llc. | 6,093 | -66.53 | 216 | -65.88 | ||||
| 2025-08-15 | 13F | Equitable Holdings, Inc. | 46,744 | -9.77 | 1,659 | -6.12 | ||||
| 2025-07-23 | 13F | Sax Wealth Advisors, Llc | 62,805 | 32.95 | 2,229 | 35.52 | ||||
| 2025-07-25 | 13F | Cwm, Llc | 663 | 333.33 | 0 | |||||
| 2025-08-15 | 13F | Semmax Financial Advisors Inc. | 302 | -19.03 | 11 | -16.67 | ||||
| 2025-08-13 | 13F | Victory Financial Group, Llc | 8,506 | 46.08 | 302 | 49.01 | ||||
| 2025-05-16 | 13F | Coppell Advisory Solutions LLC | 0 | -100.00 | 0 | |||||
| 2025-07-29 | 13F | Stephens Inc /ar/ | 13,164 | 467 | ||||||
| 2025-08-12 | 13F | Steward Partners Investment Advisory, Llc | 663 | 24 | ||||||
| 2025-08-14 | 13F | Garden State Investment Advisory Services LLC | 9,574 | -15.00 | 340 | -13.52 |