Mga Batayang Estadistika
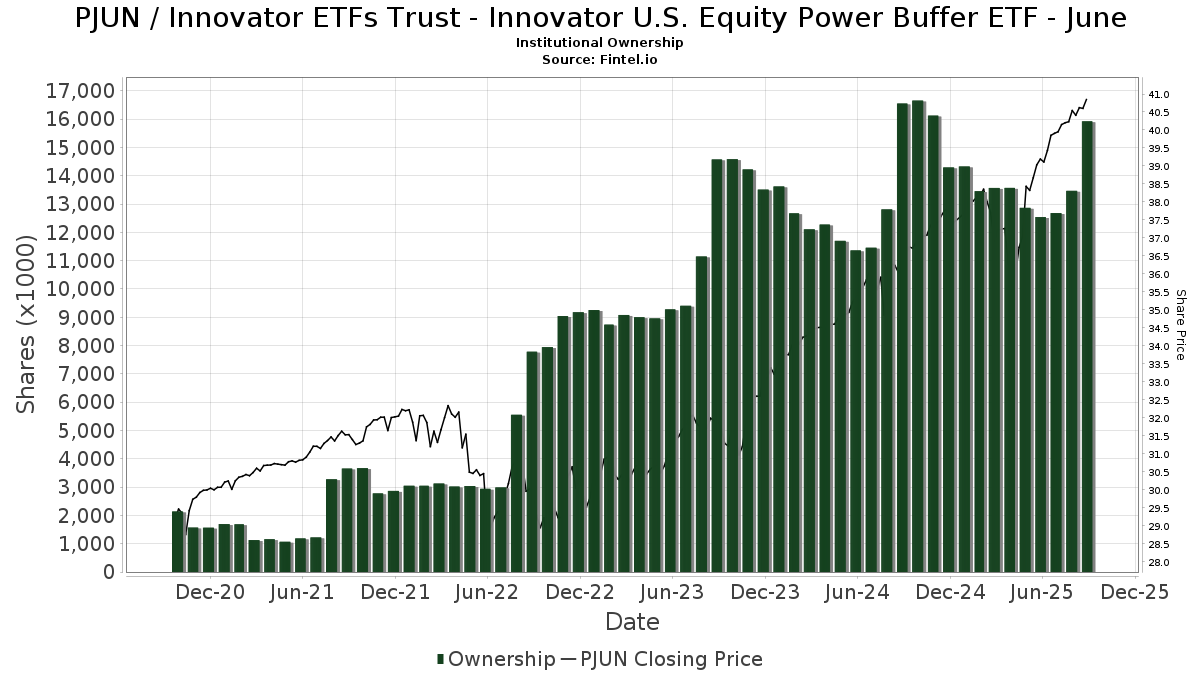
| Pemilik Institusional | 159 total, 159 long only, 0 short only, 0 long/short - change of 1.91% MRQ |
| Alokasi Portofolio Rata-rata | 0.2750 % - change of 2.94% MRQ |
| Saham Institusional (Jangka Panjang) | 15,924,910 (ex 13D/G) - change of 3.38MM shares 26.98% MRQ |
| Nilai Institusional (Jangka Panjang) | $ 492,553 USD ($1000) |
Kepemilikan Institusional dan Pemegang Saham
Innovator ETFs Trust - Innovator U.S. Equity Power Buffer ETF - June (US:PJUN) memiliki 159 pemilik institusional dan pemegang saham yang telah mengajukan formulir 13D/G atau 13F kepada Komisi Bursa Efek (Securities Exchange Commission/SEC). Lembaga-lembaga ini memegang total 15,924,910 saham. Pemegang saham terbesar meliputi Alliancebernstein L.p., Commonwealth Equity Services, Llc, Penserra Capital Management LLC, Innovator ETFs Trust - Innovator Laddered Fund of U.S. Equity Power Buffer ETFs, Berkshire Money Management, Inc., Advisor Group Holdings, Inc., HighTower Advisors, LLC, Kovitz Investment Group Partners, LLC, Wealth Enhancement Advisory Services, Llc, and Raymond James Financial Inc .
Struktur kepemilikan institusional Innovator ETFs Trust - Innovator U.S. Equity Power Buffer ETF - June (BATS:PJUN) menunjukkan posisi terkini di perusahaan oleh institusi dan dana, serta perubahan terbaru dalam ukuran posisi. Pemegang saham utama dapat mencakup investor individu, reksa dana, dana lindung nilai, atau institusi. Jadwal 13D menunjukkan bahwa investor memegang (atau pernah memegang) lebih dari 5% saham perusahaan dan bermaksud (atau pernah bermaksud) untuk secara aktif mengejar perubahan strategi bisnis. Jadwal 13G menunjukkan investasi pasif lebih dari 5%.
The share price as of September 5, 2025 is 40.69 / share. Previously, on September 6, 2024, the share price was 35.76 / share. This represents an increase of 13.79% over that period.
Skor Sentimen Dana
Skor Sentimen Dana (sebelumnya dikenal sebagai Skor Akumulasi Kepemilikan) menemukan saham-saham yang paling banyak dibeli oleh dana. Ini adalah hasil dari model kuantitatif multi-faktor yang canggih yang mengidentifikasi perusahaan dengan tingkat akumulasi institusional tertinggi. Model penilaian menggunakan kombinasi dari total peningkatan pemilik yang diungkapkan, perubahan dalam alokasi portofolio pada pemilik tersebut, dan metrik lainnya. Angka berkisar dari 0 hingga 100, dengan angka yang lebih tinggi menunjukkan tingkat akumulasi yang lebih tinggi dibandingkan dengan perusahaan sejenisnya, dan 50 adalah rata-ratanya.
Frekuensi Pembaruan: Setiap Hari
Lihat Ownership Explorer, yang menyediakan daftar perusahaan dengan peringkat tertinggi.
Rasio Put/Call Institusional
Selain melaporkan isu ekuitas dan utang standar, institusi dengan aset di bawah manajemen lebih dari 100 juta dolar AS juga harus mengungkapkan kepemilikan opsi put dan call mereka. Karena opsi put umumnya menunjukkan sentimen negatif, dan opsi call menunjukkan sentimen positif, kita dapat mengetahui sentimen institusional secara keseluruhan dengan memplot rasio put terhadap call. Grafik di sebelah kanan memplot rasio put/call historis untuk instrumen ini.
Menggunakan Rasio Put/Call sebagai indikator sentimen investor mengatasi salah satu kekurangan utama dari penggunaan total kepemilikan institusional, yaitu sejumlah besar aset yang dikelola diinvestasikan secara pasif untuk melacak indeks. Dana yang dikelola secara pasif biasanya tidak membeli opsi, sehingga indikator rasio put/call lebih akurat dalam melacak sentimen dana yang dikelola secara aktif.
Pengajuan 13F dan NPORT
Detail pada pengajuan 13F tersedia gratis. Detail pada pengajuan NP memerlukan keanggotaan premium. Baris berwarna hijau menunjukkan posisi baru. Baris berwarna merah menunjukkan posisi yang sudah ditutup. Klik tautan ini ikon untuk melihat riwayat transaksi selengkapnya.
Tingkatkan
untuk membuka data premium dan mengekspor ke Excel ![]() .
.
| Tanggal File | Sumber | Investor | Ketik | Presyo ng Avg (Silangan) |
Saham | Δ Saham (%) |
Dilaporkan Nilai ($1000) |
Nilai Δ (%) |
Alokasi Port (%) |
|
|---|---|---|---|---|---|---|---|---|---|---|
| 2025-08-13 | 13F | Cresset Asset Management, LLC | 54,746 | 46.96 | 2,177 | 57.91 | ||||
| 2025-07-25 | 13F | NorthRock Partners, LLC | 1,629 | 0.00 | 65 | 6.67 | ||||
| 2025-08-04 | 13F | Spire Wealth Management | 19,609 | 9.41 | 780 | 17.50 | ||||
| 2025-08-14 | 13F | Beck Capital Management, Llc | 12,882 | 0.01 | 512 | 7.56 | ||||
| 2025-07-25 | 13F | Atria Wealth Solutions, Inc. | 9,665 | -28.88 | 384 | -23.51 | ||||
| 2025-07-22 | 13F | Merit Financial Group, LLC | 10,720 | 426 | ||||||
| 2025-07-15 | 13F | McAdam, LLC | 201,951 | -1.20 | 8,030 | 6.15 | ||||
| 2025-07-23 | 13F | Valmark Advisers, Inc. | 16,399 | 24.08 | 652 | 33.33 | ||||
| 2025-08-11 | 13F | Atlantic Private Wealth, LLC | 0 | -100.00 | 0 | |||||
| 2025-08-12 | 13F | LPL Financial LLC | 196,618 | 10.32 | 7,818 | 18.51 | ||||
| 2025-04-08 | 13F | Lantz Financial LLC | 0 | -100.00 | 0 | |||||
| 2025-08-08 | 13F | Wealth Alliance | 51,065 | 1.90 | 2,030 | 9.49 | ||||
| 2025-05-06 | 13F | Assetmark, Inc | 0 | -100.00 | 0 | |||||
| 2025-08-04 | 13F | Integrity Alliance, Llc. | 0 | -100.00 | 0 | |||||
| 2025-08-14 | 13F | Wells Fargo & Company/mn | 879 | 0.00 | 35 | 6.25 | ||||
| 2025-08-15 | 13F | Kestra Advisory Services, LLC | 171,760 | 36.41 | 6,829 | 46.55 | ||||
| 2025-08-14 | 13F | Ambassador Advisors, LLC | 16,335 | 11.62 | 649 | 19.96 | ||||
| 2025-08-01 | 13F | FSA Advisors, Inc. | 12,067 | 8.29 | 480 | 17.11 | ||||
| 2025-08-01 | 13F | Corrado Advisors, Llc | 41,353 | 1,644 | ||||||
| 2025-08-06 | 13F | New Millennium Group LLC | 0 | -100.00 | 0 | |||||
| 2025-08-11 | 13F | Blue Bell Private Wealth Management, Llc | 11,603 | 1.75 | 461 | 9.24 | ||||
| 2025-07-25 | 13F | We Are One Seven, LLC | 15,276 | 607 | ||||||
| 2025-08-11 | 13F | Annis Gardner Whiting Capital Advisors, LLC | 20,875 | 830 | ||||||
| 2025-07-17 | 13F | Clear Point Advisors Inc. | 89,850 | -3.30 | 3,572 | 3.90 | ||||
| 2025-08-14 | 13F | Visionary Wealth Advisors | 6,242 | -0.14 | 248 | 7.36 | ||||
| 2025-07-09 | 13F | Fragasso Group Inc. | 18,268 | -4.41 | 726 | 2.69 | ||||
| 2025-08-12 | 13F | SRS Capital Advisors, Inc. | 7,962 | -46.66 | 317 | -42.75 | ||||
| 2025-07-30 | 13F | Brookstone Capital Management | 203,841 | -45.68 | 8,105 | -41.64 | ||||
| 2025-08-06 | 13F | Rps Advisory Solutions Llc | 49,591 | 139.32 | 1,972 | 157.31 | ||||
| 2025-08-14 | 13F | CoreCap Advisors, LLC | 202,489 | 105.68 | 8,051 | 120.97 | ||||
| 2025-07-30 | 13F | Retirement Planning Group | 7,620 | 0.00 | 303 | 7.09 | ||||
| 2025-08-07 | 13F | Resources Investment Advisors, LLC. | 82,206 | 74.56 | 3,269 | 87.60 | ||||
| 2025-08-14 | 13F | Colony Group, LLC | 69,914 | 1.85 | 2,780 | 9.41 | ||||
| 2025-07-21 | 13F | Ameriflex Group, Inc. | 133 | 0.00 | 5 | 25.00 | ||||
| 2025-07-22 | 13F | Berkshire Money Management, Inc. | 623,576 | 2,852.12 | 24,793 | 3,074.52 | ||||
| 2025-07-25 | 13F | Cwm, Llc | 1,950 | 22.41 | 0 | |||||
| 2025-05-15 | 13F | Two Sigma Securities, Llc | 0 | -100.00 | 0 | -100.00 | ||||
| 2025-08-11 | 13F | Bellwether Advisors, LLC | 127,427 | 17.90 | 5,066 | 26.68 | ||||
| 2025-08-04 | 13F | Atria Investments Llc | 24,297 | 966 | ||||||
| 2025-08-12 | 13F | MAI Capital Management | 55,251 | 127.74 | 2,197 | 144.82 | ||||
| 2025-08-13 | 13F | Continuum Advisory, LLC | 0 | -100.00 | 0 | |||||
| 2025-07-10 | 13F | Atticus Wealth Management, Llc | 15,838 | 77.78 | 630 | 91.19 | ||||
| 2025-08-12 | 13F | Jacobi Capital Management LLC | 10,850 | 0.00 | 431 | 7.48 | ||||
| 2025-08-05 | 13F | Sigma Planning Corp | 5,677 | 226 | ||||||
| 2025-08-11 | 13F | Nations Financial Group Inc, /ia/ /adv | 37,875 | 1.55 | 1,506 | 9.06 | ||||
| 2025-08-14 | 13F | Bank Of America Corp /de/ | 568 | 23 | ||||||
| 2025-08-08 | 13F | Avantax Advisory Services, Inc. | 21,114 | 89.07 | 839 | 103.15 | ||||
| 2025-07-17 | 13F | Wagner Wealth Management, Llc | 1,990 | 0.00 | 79 | 8.22 | ||||
| 2025-07-29 | 13F | Chicago Partners Investment Group LLC | 32,845 | -7.62 | 1,319 | 0.15 | ||||
| 2025-08-14 | 13F | Financial Network Wealth Advisors LLC | 3,055 | 9.03 | 121 | 17.48 | ||||
| 2025-08-08 | 13F | Thoroughbred Financial Services, Llc | 26,406 | -7.03 | 1 | 0.00 | ||||
| 2025-08-14 | 13F | Mml Investors Services, Llc | 120,549 | 179.70 | 5 | 300.00 | ||||
| 2025-07-28 | 13F | Elmwood Wealth Management, Inc. | 6,950 | -12.58 | 276 | -6.12 | ||||
| 2025-08-13 | 13F | Barclays Plc | 0 | -100.00 | 0 | |||||
| 2025-07-28 | 13F | Cypress Wealth Services, LLC | 9,684 | -15.59 | 385 | -9.20 | ||||
| 2025-08-01 | 13F | Advisory Alpha, LLC | 149,897 | -2.18 | 5,960 | 5.08 | ||||
| 2025-07-17 | 13F | Fort Washington Investment Advisors Inc /oh/ | 6,950 | -21.02 | 276 | -15.08 | ||||
| 2025-08-14 | 13F | Jane Street Group, Llc | 33,247 | 1,322 | ||||||
| 2025-07-24 | 13F | Weaver Capital Management LLC | 138,697 | 0.40 | 5,515 | 7.86 | ||||
| 2025-05-08 | 13F | Arkadios Wealth Advisors | 0 | -100.00 | 0 | |||||
| 2025-08-05 | 13F | Tsfg, Llc | 0 | -100.00 | 0 | |||||
| 2025-04-01 | 13F/A | Family Wealth Group, LLC | 0 | -100.00 | 0 | |||||
| 2025-07-22 | 13F | Global Strategic Investment Solutions, LLC | 14,932 | -0.08 | 594 | 7.23 | ||||
| 2025-05-06 | 13F | Retirement Income Solutions, Inc | 0 | -100.00 | 0 | |||||
| 2025-07-28 | 13F | Harbour Investments, Inc. | 24,896 | 2.73 | 990 | 10.38 | ||||
| 2025-07-09 | 13F | Fiduciary Alliance LLC | 5,674 | 226 | ||||||
| 2025-05-09 | 13F | Mitchell Capital Management Co | 0 | -100.00 | 0 | -100.00 | ||||
| 2025-08-12 | 13F | Proequities, Inc. | 0 | 0 | ||||||
| 2025-07-23 | 13F | Castle Rock Wealth Management, LLC | 45,035 | 0.69 | 1,804 | 9.00 | ||||
| 2025-07-16 | 13F | Dakota Wealth Management | 12,817 | 0.00 | 510 | 7.38 | ||||
| 2025-08-11 | 13F | WPWealth LLP | 30,176 | -72.38 | 1,200 | -70.34 | ||||
| 2025-08-01 | 13F | Bessemer Group Inc | 0 | -100.00 | 0 | |||||
| 2025-08-06 | 13F | Penserra Capital Management LLC | 1,493,506 | 15.39 | 59 | 25.53 | ||||
| 2025-08-14 | 13F | Kovitz Investment Group Partners, LLC | 416,018 | 34.28 | 16,541 | 44.25 | ||||
| 2025-08-05 | 13F | Bank Of Montreal /can/ | 16,587 | 0.00 | 659 | 7.50 | ||||
| 2025-04-10 | 13F | Sugar Maple Asset Management, LLC | 0 | -100.00 | 0 | |||||
| 2025-07-25 | 13F | Sequoia Financial Advisors, LLC | 8,974 | 0.00 | 357 | 7.23 | ||||
| 2025-08-06 | 13F | Commonwealth Equity Services, Llc | 1,670,634 | 274.26 | 66 | 312.50 | ||||
| 2025-08-13 | 13F | Beacon Pointe Advisors, LLC | 138,703 | 58.90 | 5,515 | 70.71 | ||||
| 2025-08-14 | 13F | First Commonwealth Financial Corp /pa/ | 17,908 | 8.70 | 712 | 16.91 | ||||
| 2025-08-12 | 13F | Weaver Consulting Group | 107,594 | 3.55 | 4,278 | 11.24 | ||||
| 2025-06-24 | NP | Innovator ETFs Trust - Innovator Laddered Fund of U.S. Equity Power Buffer ETFs | 1,304,988 | 12.03 | 47,932 | 8.17 | ||||
| 2025-07-14 | 13F | Chris Bulman Inc | 155,187 | -45.96 | 6,170 | -41.94 | ||||
| 2025-08-14 | 13F | UBS Group AG | 0 | -100.00 | 0 | |||||
| 2025-08-08 | 13F | Kingsview Wealth Management, LLC | 12,760 | -1.54 | 507 | 5.85 | ||||
| 2025-08-15 | 13F | First Heartland Consultants, Inc. | 25,648 | 1,020 | ||||||
| 2025-08-06 | 13F | AE Wealth Management LLC | 43,662 | -3.54 | 1,736 | 3.64 | ||||
| 2025-07-14 | 13F | Kfg Wealth Management, Llc | 59,227 | 25.73 | 2,355 | 35.05 | ||||
| 2025-07-21 | 13F | DHJJ Financial Advisors, Ltd. | 21,471 | 27.45 | 854 | 36.92 | ||||
| 2025-05-14 | 13F | Valtinson Bruner Financial Planning LLC | 0 | -100.00 | 0 | |||||
| 2025-08-06 | 13F | Stone House Investment Management, LLC | 1,450 | 58 | ||||||
| 2025-08-15 | 13F | Chapman Financial Group, Llc | 3,100 | -8.82 | 123 | -3.15 | ||||
| 2025-08-11 | 13F | Brown Brothers Harriman & Co | 272 | 0.00 | 11 | 0.00 | ||||
| 2025-04-22 | 13F | Continuum Wealth Advisors, Llc | 0 | -100.00 | 0 | |||||
| 2025-08-07 | 13F | Tfo-tdc, Llc | 0 | -100.00 | 0 | |||||
| 2025-08-12 | 13F | Tradition Wealth Management, LLC | 20,174 | -3.23 | 802 | 4.02 | ||||
| 2025-08-19 | 13F | Advisory Services Network, LLC | 23,000 | 138.34 | 924 | 158.82 | ||||
| 2025-08-11 | 13F | HighTower Advisors, LLC | 431,695 | -1.70 | 17,164 | 5.61 | ||||
| 2025-05-12 | 13F | Fmr Llc | 0 | -100.00 | 0 | |||||
| 2025-07-29 | 13F | Balboa Wealth Partners | 0 | -100.00 | 0 | |||||
| 2025-08-14 | 13F | Raymond James Financial Inc | 331,546 | 76.98 | 13,182 | 90.13 | ||||
| 2025-08-14 | 13F | Alliancebernstein L.p. | 2,943,205 | 10.53 | 117,022 | 18.74 | ||||
| 2025-07-31 | 13F | Cardinal Point Capital Management, ULC | 16,230 | 0.00 | 645 | 7.50 | ||||
| 2025-07-15 | 13F | BCS Wealth Management | 31,131 | 11.54 | 1 | 0.00 | ||||
| 2025-07-18 | 13F | Truist Financial Corp | 178,359 | 4.92 | 7,092 | 12.72 | ||||
| 2025-08-05 | 13F | Huntington National Bank | 20 | |||||||
| 2025-08-13 | 13F | Capital Analysts, Inc. | 8,288 | 9.07 | 0 | |||||
| 2025-05-01 | 13F | Quest 10 Wealth Builders, Inc. | 19,090 | 0.00 | 713 | -0.42 | ||||
| 2025-05-13 | 13F | Coldstream Capital Management Inc | 0 | -100.00 | 0 | |||||
| 2025-08-14 | 13F | Garden State Investment Advisory Services LLC | 13,585 | 0.00 | 540 | 7.57 | ||||
| 2025-07-25 | 13F | Yarger Wealth Strategies, Llc | 75,696 | 3.43 | 3,010 | 11.12 | ||||
| 2025-07-17 | 13F | Janney Montgomery Scott LLC | 35,792 | -4.06 | 1 | 0.00 | ||||
| 2025-08-12 | 13F | Wood Tarver Financial Group, LLC | 3,326 | 0.00 | 0 | -100.00 | ||||
| 2025-07-10 | 13F | Focus Financial Network, Inc. | 21,770 | 4.25 | 866 | 12.05 | ||||
| 2025-08-13 | 13F | Cerity Partners LLC | 11,941 | -28.71 | 475 | -23.42 | ||||
| 2025-07-24 | 13F | Bernard Wealth Management Corp. | 920 | 0.99 | 37 | 9.09 | ||||
| 2025-07-29 | 13F | Straight Path Wealth Management | 5,354 | -16.30 | 213 | -10.17 | ||||
| 2025-08-12 | 13F | Steward Partners Investment Advisory, Llc | 3,949 | 0.00 | 157 | 7.53 | ||||
| 2025-08-19 | 13F | Cape Investment Advisory, Inc. | 41,825 | -9.32 | 1,663 | -2.64 | ||||
| 2025-07-24 | 13F | IFP Advisors, Inc | 43,123 | 32.38 | 1,715 | 42.24 | ||||
| 2025-08-12 | 13F | Bedel Financial Consulting, Inc. | 0 | -100.00 | 0 | |||||
| 2025-07-31 | 13F | Orion Capital Management LLC | 13,720 | -6.79 | 546 | 0.18 | ||||
| 2025-08-05 | 13F | Integrity Financial Corp /WA | 5,284 | -17.41 | 210 | -11.02 | ||||
| 2025-07-17 | 13F | City Holding Co | 430 | 0.00 | 17 | 13.33 | ||||
| 2025-08-14 | 13F | Susquehanna International Group, Llp | 26,098 | -76.20 | 1,038 | -74.44 | ||||
| 2025-07-14 | 13F | AdvisorNet Financial, Inc | 1,848 | -11.32 | 73 | -5.19 | ||||
| 2025-08-11 | 13F | Outlook Wealth Advisors, LLC | 38,994 | -3.70 | 1,550 | 3.47 | ||||
| 2025-08-12 | 13F | Park Square Financial Group, LLC | 138 | 0.00 | 5 | 0.00 | ||||
| 2025-07-10 | 13F | ARS Wealth Advisors Group, LLC | 114,802 | 4.53 | 4,565 | 12.30 | ||||
| 2025-08-08 | 13F | Cetera Investment Advisers | 212,948 | 6.70 | 8,467 | 14.62 | ||||
| 2025-08-05 | 13F | WorthPointe, LLC | 16,451 | 3.27 | 654 | 11.04 | ||||
| 2025-08-08 | 13F | Gts Securities Llc | 7,900 | 314 | ||||||
| 2025-08-12 | 13F | Tableaux Llc | 6,714 | 2,847 | ||||||
| 2025-07-28 | 13F | WealthPlan Investment Management, LLC | 5,444 | 0.00 | 216 | 7.46 | ||||
| 2025-08-04 | 13F | JDM Financial Group LLC | 21,447 | 0.00 | 853 | 7.44 | ||||
| 2025-07-28 | 13F | RFG Advisory, LLC | 27,724 | -17.87 | 1,102 | -11.77 | ||||
| 2025-07-10 | 13F | Wealth Enhancement Advisory Services, Llc | 368,519 | 389.97 | 14,697 | 428.06 | ||||
| 2025-08-12 | 13F | Change Path, LLC | 30,655 | 73.08 | 1,219 | 85.95 | ||||
| 2025-08-13 | 13F | BCJ Capital Management, LLC | 7,331 | -0.33 | 291 | 6.99 | ||||
| 2025-07-31 | 13F | Cambridge Investment Research Advisors, Inc. | 91,125 | 19.80 | 4 | 50.00 | ||||
| 2025-04-22 | 13F | Worth Financial Advisory Group, LLC | 0 | -100.00 | 0 | -100.00 | ||||
| 2025-08-08 | 13F | Emerald Investment Partners, Llc | 842 | 155.15 | 33 | 175.00 | ||||
| 2025-07-29 | 13F | BKD Wealth Advisors, LLC | 56,829 | -16.54 | 2,260 | -10.32 | ||||
| 2025-08-01 | 13F | Envestnet Asset Management Inc | 251,711 | 93.36 | 10,008 | 107.76 | ||||
| 2025-07-17 | 13F | Clay Northam Wealth Management, LLC | 6,960 | 4.11 | 277 | 11.74 | ||||
| 2025-07-31 | 13F | Blue Sky Capital Consultants Group, Inc. | 7,925 | 315 | ||||||
| 2025-08-11 | 13F | Principal Securities, Inc. | 5,065 | 23.09 | 201 | 30.52 | ||||
| 2025-07-31 | 13F | Pinnacle Wealth Management Group, Inc. | 63,535 | 16.62 | 2,526 | 25.30 | ||||
| 2025-07-11 | 13F | Farther Finance Advisors, LLC | 6,227 | 2.47 | 248 | 9.78 | ||||
| 2025-08-19 | 13F | National Asset Management, Inc. | 7,500 | -63.99 | 298 | -61.84 | ||||
| 2025-07-14 | 13F | U.S. Capital Wealth Advisors, LLC | 12,457 | 29.36 | 495 | 39.04 | ||||
| 2025-08-14 | 13F | GWM Advisors LLC | 36,668 | 149.09 | 1,458 | 167.83 | ||||
| 2025-07-14 | 13F | Southland Equity Partners LLC | 94,166 | -0.00 | 3,744 | 7.43 | ||||
| 2025-07-31 | 13F | Gill Capital Partners, Llc | 19,407 | 42.94 | 772 | 53.59 | ||||
| 2025-07-24 | 13F | Riverchase Wealth Management, Llc | 27,250 | 0.00 | 1,083 | 7.44 | ||||
| 2025-07-30 | 13F | Strategic Blueprint, LLC | 23,053 | -36.50 | 917 | -31.79 | ||||
| 2025-08-14 | 13F | AllSquare Wealth Management LLC | 350 | 0.00 | 14 | 8.33 | ||||
| 2025-08-04 | 13F | Pensionmark Financial Group, Llc | 22,588 | 31.69 | 898 | 41.64 | ||||
| 2025-08-13 | 13F | M Holdings Securities, Inc. | 13,967 | 1 | ||||||
| 2025-07-28 | 13F | Cornerstone Wealth Group, LLC | 28,913 | -5.56 | 1,150 | 1.41 | ||||
| 2025-08-05 | 13F | BCGM Wealth Management, LLC | 9,979 | 0.00 | 397 | 7.32 | ||||
| 2025-08-04 | 13F | Creative Financial Designs Inc /adv | 4,820 | 2.53 | 192 | 10.40 | ||||
| 2025-08-14 | 13F | Citadel Advisors Llc | 0 | -100.00 | 0 | |||||
| 2025-07-30 | 13F | Phoenix Holdings Ltd. | 9,920 | 394 | ||||||
| 2025-08-14 | 13F | Hrt Financial Lp | 7,920 | -43.00 | 0 | |||||
| 2025-08-14 | 13F | Old Mission Capital Llc | 99,564 | 622.00 | 3,959 | 676.08 | ||||
| 2025-08-08 | 13F | Foundations Investment Advisors, LLC | 12,413 | 29.19 | 494 | 38.87 | ||||
| 2025-08-13 | 13F | Townsquare Capital Llc | 0 | -100.00 | 0 | |||||
| 2025-08-11 | 13F | Brown Wealth Management, Llc | 32,215 | -1.89 | 1,281 | 5.35 | ||||
| 2025-08-15 | 13F | Nikulski Financial, Inc. | 15,420 | 30.07 | 613 | 39.95 | ||||
| 2025-05-07 | 13F | Keystone Financial Group, Inc. | 0 | -100.00 | 0 | |||||
| 2025-07-22 | 13F | Belpointe Asset Management LLC | 10,789 | 429 | ||||||
| 2025-07-21 | 13F | Patriot Financial Group Insurance Agency, LLC | 28,608 | 4.95 | 1,137 | 12.80 | ||||
| 2025-07-28 | 13F | Axxcess Wealth Management, Llc | 9,646 | 0.00 | 384 | 7.58 | ||||
| 2025-08-08 | 13F | Capital Investment Advisory Services, LLC | 574 | 28.70 | 23 | 37.50 | ||||
| 2025-08-14 | 13F | Aqr Capital Management Llc | 0 | -100.00 | 0 | |||||
| 2025-07-14 | 13F | CRA Financial Services, LLC | 24,770 | -5.35 | 985 | 1.65 | ||||
| 2025-07-22 | 13F | Diligent Investors, LLC | 17,652 | 55.50 | 702 | 66.90 | ||||
| 2025-08-12 | 13F | Jpmorgan Chase & Co | 3,230 | -74.77 | 128 | -72.94 | ||||
| 2025-09-04 | 13F/A | Advisor Group Holdings, Inc. | 494,108 | 25.35 | 19,646 | 34.67 | ||||
| 2025-07-24 | 13F | Blair William & Co/il | 97,837 | -38.00 | 3,890 | -33.41 | ||||
| 2025-08-11 | 13F | Anfield Capital Management, LLC | 327 | 13 | ||||||
| 2025-08-08 | 13F | Firestone Capital Management | 6,005 | 0.00 | 239 | 7.21 | ||||
| 2025-07-22 | 13F | Beacon Financial Advisory LLC | 9,600 | 23.87 | 382 | 33.22 | ||||
| 2025-08-14 | 13F | Benjamin Edwards Inc | 24,229 | 5.62 | 963 | 13.43 | ||||
| 2025-07-09 | 13F | Lineweaver Wealth Advisors, LLC | 310,594 | -0.96 | 12,349 | 6.40 | ||||
| 2025-07-29 | 13F | Stratos Wealth Advisors, LLC | 11,875 | -1.66 | 472 | 5.83 | ||||
| 2025-08-12 | 13F | Leigh Baldwin & Co., Llc | 10,525 | 11.08 | 418 | 19.43 | ||||
| 2025-08-15 | 13F | Captrust Financial Advisors | 39,846 | 43.14 | 1,584 | 53.79 |