Mga Batayang Estadistika
| Pemilik Institusional | 132 total, 132 long only, 0 short only, 0 long/short - change of 4.76% MRQ |
| Alokasi Portofolio Rata-rata | 1.0759 % - change of -5.05% MRQ |
| Saham Institusional (Jangka Panjang) | 25,037,539 (ex 13D/G) - change of 1.45MM shares 6.14% MRQ |
| Nilai Institusional (Jangka Panjang) | $ 977,185 USD ($1000) |
Kepemilikan Institusional dan Pemegang Saham
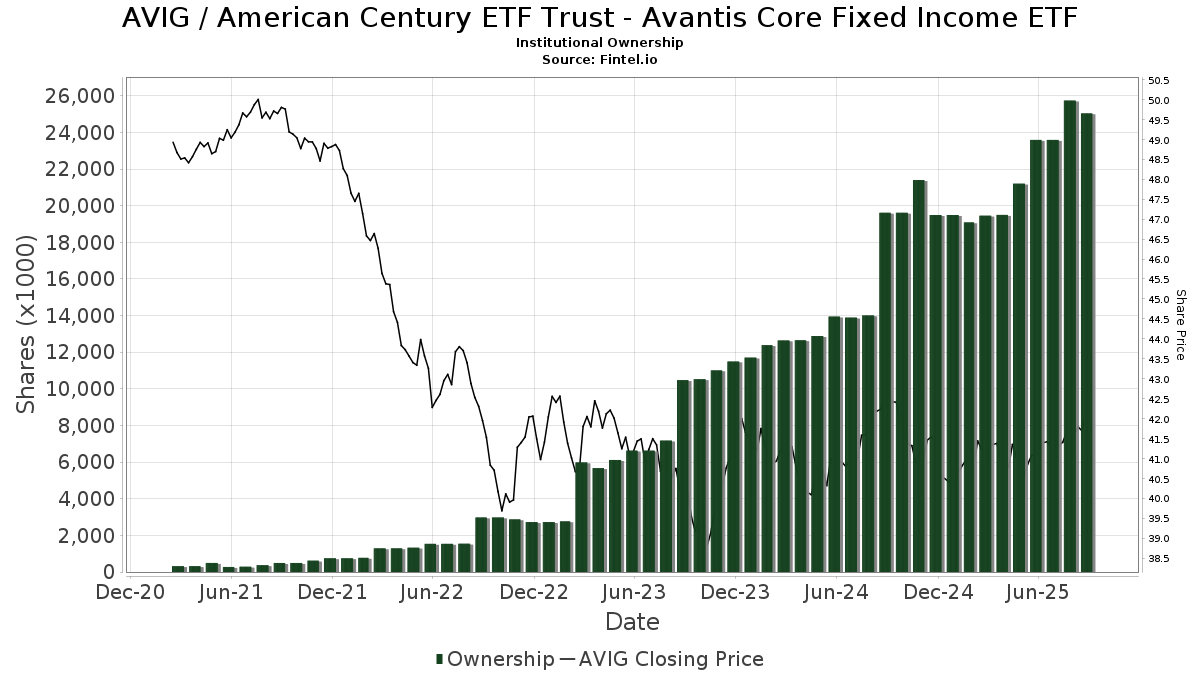
American Century ETF Trust - Avantis Core Fixed Income ETF (US:AVIG) memiliki 132 pemilik institusional dan pemegang saham yang telah mengajukan formulir 13D/G atau 13F kepada Komisi Bursa Efek (Securities Exchange Commission/SEC). Lembaga-lembaga ini memegang total 25,037,539 saham. Pemegang saham terbesar meliputi AE Wealth Management LLC, Simplicity Wealth,LLC, Verus Financial Partners, Inc., Hill Investment Group Partners, LLC, Pacific Life Fund Advisors LLC, PACIFIC SELECT FUND - PSF DFA Balanced Allocation Portfolio Class D, Envestnet Asset Management Inc, LPL Financial LLC, SRS Capital Advisors, Inc., and BCR Wealth Strategies, LLC .
Struktur kepemilikan institusional American Century ETF Trust - Avantis Core Fixed Income ETF (ARCA:AVIG) menunjukkan posisi terkini di perusahaan oleh institusi dan dana, serta perubahan terbaru dalam ukuran posisi. Pemegang saham utama dapat mencakup investor individu, reksa dana, dana lindung nilai, atau institusi. Jadwal 13D menunjukkan bahwa investor memegang (atau pernah memegang) lebih dari 5% saham perusahaan dan bermaksud (atau pernah bermaksud) untuk secara aktif mengejar perubahan strategi bisnis. Jadwal 13G menunjukkan investasi pasif lebih dari 5%.
The share price as of September 5, 2025 is 42.05 / share. Previously, on September 9, 2024, the share price was 42.46 / share. This represents a decline of 0.97% over that period.
Skor Sentimen Dana
Skor Sentimen Dana (sebelumnya dikenal sebagai Skor Akumulasi Kepemilikan) menemukan saham-saham yang paling banyak dibeli oleh dana. Ini adalah hasil dari model kuantitatif multi-faktor yang canggih yang mengidentifikasi perusahaan dengan tingkat akumulasi institusional tertinggi. Model penilaian menggunakan kombinasi dari total peningkatan pemilik yang diungkapkan, perubahan dalam alokasi portofolio pada pemilik tersebut, dan metrik lainnya. Angka berkisar dari 0 hingga 100, dengan angka yang lebih tinggi menunjukkan tingkat akumulasi yang lebih tinggi dibandingkan dengan perusahaan sejenisnya, dan 50 adalah rata-ratanya.
Frekuensi Pembaruan: Setiap Hari
Lihat Ownership Explorer, yang menyediakan daftar perusahaan dengan peringkat tertinggi.
Rasio Put/Call Institusional
Selain melaporkan isu ekuitas dan utang standar, institusi dengan aset di bawah manajemen lebih dari 100 juta dolar AS juga harus mengungkapkan kepemilikan opsi put dan call mereka. Karena opsi put umumnya menunjukkan sentimen negatif, dan opsi call menunjukkan sentimen positif, kita dapat mengetahui sentimen institusional secara keseluruhan dengan memplot rasio put terhadap call. Grafik di sebelah kanan memplot rasio put/call historis untuk instrumen ini.
Menggunakan Rasio Put/Call sebagai indikator sentimen investor mengatasi salah satu kekurangan utama dari penggunaan total kepemilikan institusional, yaitu sejumlah besar aset yang dikelola diinvestasikan secara pasif untuk melacak indeks. Dana yang dikelola secara pasif biasanya tidak membeli opsi, sehingga indikator rasio put/call lebih akurat dalam melacak sentimen dana yang dikelola secara aktif.
Pengajuan 13F dan NPORT
Detail pada pengajuan 13F tersedia gratis. Detail pada pengajuan NP memerlukan keanggotaan premium. Baris berwarna hijau menunjukkan posisi baru. Baris berwarna merah menunjukkan posisi yang sudah ditutup. Klik tautan ini ikon untuk melihat riwayat transaksi selengkapnya.
Tingkatkan
untuk membuka data premium dan mengekspor ke Excel ![]() .
.
| Tanggal File | Sumber | Investor | Ketik | Presyo ng Avg (Silangan) |
Saham | Δ Saham (%) |
Dilaporkan Nilai ($1000) |
Nilai Δ (%) |
Alokasi Port (%) |
|
|---|---|---|---|---|---|---|---|---|---|---|
| 2025-07-17 | 13F | Mattern Wealth Management LLC | 117,364 | -2.11 | 4,885 | -1.57 | ||||
| 2025-07-25 | 13F | BCR Wealth Strategies, LLC | 622,639 | 4.67 | 26 | 4.17 | ||||
| 2025-07-24 | 13F | PDS Planning, Inc | 0 | -100.00 | 0 | |||||
| 2025-07-25 | 13F | Index Fund Advisors, Inc. | 58,252 | 0.28 | 2,424 | 0.83 | ||||
| 2025-07-23 | 13F | Quarry Hill Advisors, Llc | 17,379 | 5.03 | 723 | 5.70 | ||||
| 2025-07-28 | 13F | Morris Financial Concepts, Inc. | 5,259 | 0.10 | 219 | 0.46 | ||||
| 2025-08-13 | 13F | WCG Wealth Advisors LLC | 34,000 | 10.41 | 1,415 | 11.07 | ||||
| 2025-05-02 | 13F | Capital A Wealth Management, LLC | 34 | 0.00 | 1 | 0.00 | ||||
| 2025-08-05 | 13F | Allodium Investment Consultants, LLC | 204,927 | 17.98 | 8,529 | 18.64 | ||||
| 2025-05-08 | 13F | Plante Moran Financial Advisors, LLC | 0 | -100.00 | 0 | |||||
| 2025-08-14 | 13F | Comerica Bank | 2,335 | 0.00 | 97 | 1.04 | ||||
| 2025-07-15 | 13F | FLP Wealth Management, LLC | 0 | -100.00 | 0 | |||||
| 2025-07-25 | 13F | Lion Street Advisors, LLC | 38,552 | 11.71 | 1,605 | 12.32 | ||||
| 2025-08-12 | 13F | Global Retirement Partners, LLC | 558 | 1.82 | 23 | 4.55 | ||||
| 2025-08-14 | 13F | Citadel Advisors Llc | 51,935 | 66.73 | 2,162 | 67.65 | ||||
| 2025-07-23 | 13F | Morey & Quinn Wealth Partners, LLC | 11,399 | 114.07 | 474 | 115.45 | ||||
| 2025-08-11 | 13F | Mach-1 Financial Group, Inc. | 0 | -100.00 | 0 | |||||
| 2025-08-14 | 13F | Hrt Financial Lp | 15,375 | 1 | ||||||
| 2025-07-28 | 13F | WealthPlan Investment Management, LLC | 32,201 | 1,340 | ||||||
| 2025-08-15 | 13F | Kestra Advisory Services, LLC | 8,290 | -6.36 | 345 | -5.74 | ||||
| 2025-08-14 | 13F | Aqr Capital Management Llc | 30,100 | 0.00 | 1,253 | 0.56 | ||||
| 2025-07-11 | 13F | SILVER OAK SECURITIES, Inc | 64,826 | 1.76 | 2,698 | 2.55 | ||||
| 2025-07-24 | 13F | Us Bancorp \de\ | 1,954 | 0.00 | 81 | 1.25 | ||||
| 2025-08-12 | 13F | SRS Capital Advisors, Inc. | 687,001 | 6.45 | 28,593 | 7.04 | ||||
| 2025-08-13 | 13F | Jones Financial Companies Lllp | 6,376 | 30.90 | 264 | 31.34 | ||||
| 2025-08-08 | 13F | Creative Planning | 460,006 | 2.60 | 19,145 | 3.17 | ||||
| 2025-08-13 | 13F | Balance Wealth, LLC | 14,960 | -1.40 | 623 | -0.96 | ||||
| 2025-08-12 | 13F | Jpmorgan Chase & Co | 1,352 | 56 | ||||||
| 2025-08-14 | 13F | Susquehanna International Group, Llp | 72,606 | 21.27 | 3,022 | 21.91 | ||||
| 2025-07-15 | 13F | Bannerman Wealth Management Group, Llc | 55,463 | 925.95 | 2,308 | 934.98 | ||||
| 2025-08-08 | 13F | Tortoise Investment Management, LLC | 50 | 0.00 | 2 | 0.00 | ||||
| 2025-08-08 | 13F | Kingsview Wealth Management, LLC | 5,218 | 217 | ||||||
| 2025-07-15 | 13F | Regatta Capital Group, Llc | 503,211 | 1.98 | 20,944 | 2.55 | ||||
| 2025-08-14 | 13F | Diversify Wealth Management, Llc | 14,211 | 10.09 | 591 | 10.67 | ||||
| 2025-05-01 | 13F | Quest 10 Wealth Builders, Inc. | 688 | 2.84 | 28 | 3.70 | ||||
| 2025-08-05 | 13F | Strategic Financial Concepts, LLC | 224,932 | 10.67 | 9,362 | 11.28 | ||||
| 2025-07-08 | 13F | Apella Capital, LLC | 26,433 | -35.17 | 1,089 | -34.63 | ||||
| 2025-08-06 | 13F | Spurstone Advisory Services, LLC | 15 | 0.00 | 1 | |||||
| 2025-08-13 | 13F | Baird Financial Group, Inc. | 8,023 | 0.00 | 334 | 0.30 | ||||
| 2025-07-28 | NP | AVMA - Avantis Moderate Allocation ETF | 147,284 | -6.39 | 6,053 | -7.40 | ||||
| 2025-07-17 | 13F | KWB Wealth | 5,492 | -10.10 | 227 | -8.10 | ||||
| 2025-07-16 | 13F | Plancorp, LLC | 142,407 | 0.62 | 5,927 | 1.16 | ||||
| 2025-08-01 | 13F | Rossby Financial, LCC | 302 | 0.00 | 13 | 0.00 | ||||
| 2025-08-18 | 13F/A | Kestra Investment Management, LLC | 100,230 | 112.07 | 4,172 | 113.24 | ||||
| 2025-08-08 | 13F | Pacific Life Fund Advisors LLC | 1,129,233 | 13.28 | 46,999 | 13.91 | ||||
| 2025-08-07 | 13F | Summit X, LLC | 40,885 | -0.71 | 1,702 | -0.18 | ||||
| 2025-08-08 | 13F | Larson Financial Group LLC | 49 | 2.08 | 2 | 0.00 | ||||
| 2025-08-14 | 13F | UBS Group AG | 299 | -33.85 | 12 | -33.33 | ||||
| 2025-07-23 | 13F | L.K. Benson & Company, P.C. | 30,537 | -20.94 | 1,271 | -20.53 | ||||
| 2025-08-12 | 13F | Change Path, LLC | 12,466 | -68.94 | 519 | -68.81 | ||||
| 2025-07-31 | 13F | Buckingham Strategic Partners | 447,245 | 5,333.01 | 18,614 | 5,374.71 | ||||
| 2025-08-08 | 13F | Good Life Advisors, LLC | 78,419 | -1.35 | 3,264 | -0.82 | ||||
| 2025-07-10 | 13F | Wealth Enhancement Advisory Services, Llc | 5,673 | 235 | ||||||
| 2025-08-12 | 13F | BWM Planning, LLC | 0 | -100.00 | 0 | |||||
| 2025-08-14 | 13F | Wiley Bros.-aintree Capital, Llc | 97,976 | 4,078 | ||||||
| 2025-08-14 | 13F | Jane Street Group, Llc | 131,114 | 1,712.47 | 5,457 | 1,724.75 | ||||
| 2025-08-14 | 13F | Visionary Wealth Advisors | 7,967 | -82.96 | 332 | -82.89 | ||||
| 2025-07-15 | 13F | Signet Financial Management, Llc | 0 | -100.00 | 0 | -100.00 | ||||
| 2025-07-16 | 13F | Leading Edge Financial Planning LLC | 15,466 | 41.06 | 644 | 41.94 | ||||
| 2025-08-14 | 13F | Beaird Harris Wealth Management, LLC | 11,870 | -1.25 | 494 | -0.60 | ||||
| 2025-04-28 | 13F | Great Point Wealth Advisors, LLC | 9,266 | 0.00 | 384 | 2.13 | ||||
| 2025-07-31 | 13F | Curio Wealth, Llc | 1,349 | 67,350.00 | 56 | 0.00 | ||||
| 2025-08-12 | 13F | Park Square Financial Group, LLC | 14,798 | 562.40 | 616 | 568.48 | ||||
| 2025-07-09 | 13F | Tounjian Advisory Partners, Llc | 57,622 | -0.47 | 2,385 | -0.46 | ||||
| 2025-08-07 | 13F | Allworth Financial LP | 6,901 | -6.67 | 287 | -5.28 | ||||
| 2025-07-15 | 13F | Traction Financial Partners, LLC | 6,265 | 261 | ||||||
| 2025-07-21 | 13F | Mattern Capital Management, Llc | 141,794 | 17.93 | 5,901 | 18.59 | ||||
| 2025-08-06 | 13F | AE Wealth Management LLC | 4,188,949 | 11.90 | 174,344 | 12.52 | ||||
| 2025-08-14 | 13F | Cardiff Park Advisors, Llc | 4,595 | 0.00 | 191 | 0.53 | ||||
| 2025-05-05 | 13F | Nwam Llc | 0 | -100.00 | 0 | |||||
| 2025-05-15 | 13F | Two Sigma Securities, Llc | 0 | -100.00 | 0 | |||||
| 2025-08-14 | 13F | Herold Advisors, Inc. | 137,227 | -14.60 | 5,711 | -14.13 | ||||
| 2025-07-10 | 13F | Pacific Asset Management, LLC | 34,305 | 4.73 | 1,428 | 5.31 | ||||
| 2025-08-01 | 13F | Winebrenner Capital Management Llc | 7,119 | 296 | ||||||
| 2025-07-08 | 13F | Ehrlich Financial Group | 0 | -100.00 | 0 | |||||
| 2025-04-18 | 13F | Creative Capital Management Investments LLC | 0 | -100.00 | 0 | |||||
| 2025-08-01 | 13F | Red Lighthouse Investment Management, Llc | 81,411 | -9.70 | 3,388 | -8.90 | ||||
| 2025-08-08 | 13F | Gts Securities Llc | 0 | -100.00 | 0 | |||||
| 2025-08-12 | 13F | LPL Financial LLC | 767,656 | 15.62 | 31,950 | 16.26 | ||||
| 2025-05-13 | 13F | EverSource Wealth Advisors, LLC | 0 | -100.00 | 0 | |||||
| 2025-07-31 | 13F | Cambridge Investment Research Advisors, Inc. | 94,506 | 28.69 | 4 | 0.00 | ||||
| 2025-08-13 | 13F | Cresset Asset Management, LLC | 168,486 | 6.68 | 7,012 | 7.28 | ||||
| 2025-07-29 | 13F | Werba Rubin Papier Wealth Management | 14,509 | 604 | ||||||
| 2025-08-14 | 13F | Betterment LLC | 18,305 | 1.02 | 1 | |||||
| 2025-08-14 | 13F | Mml Investors Services, Llc | 115,842 | -5.51 | 5 | -20.00 | ||||
| 2025-07-28 | 13F | Mutual Advisors, LLC | 6,969 | -5.24 | 288 | -4.64 | ||||
| 2025-07-11 | 13F | Quantum Financial Advisors, LLC | 105,697 | -1.69 | 4,399 | -1.12 | ||||
| 2025-07-15 | 13F | Elevated Capital Advisors, LLC | 21,965 | 0.00 | 909 | 0.00 | ||||
| 2025-08-14 | 13F | Raymond James Financial Inc | 348,825 | 6.28 | 14,518 | 6.87 | ||||
| 2025-07-17 | 13F | Beacon Capital Management, LLC | 1,864 | 78 | ||||||
| 2025-08-12 | 13F | Proequities, Inc. | 0 | 0 | ||||||
| 2025-05-16 | 13F | Coppell Advisory Solutions LLC | 0 | -100.00 | 0 | |||||
| 2025-08-13 | 13F | Flow Traders U.s. Llc | 0 | -100.00 | 0 | |||||
| 2025-08-14 | 13F | Planwiser Financial, Llc | 74,854 | -9.10 | 3,092 | -8.50 | ||||
| 2025-08-18 | NP | PACIFIC SELECT FUND - PSF DFA Balanced Allocation Portfolio Class D | 1,129,233 | 13.28 | 46,999 | 13.91 | ||||
| 2025-07-16 | 13F | Meredith Wealth Planning | 5,657 | 1.14 | 235 | 1.73 | ||||
| 2025-07-21 | 13F | Verus Financial Partners, Inc. | 1,354,347 | 3.22 | 55,935 | 4.46 | ||||
| 2025-07-22 | 13F | Echo Wealth Management, LLC | 516,788 | 30.42 | 21,509 | 31.14 | ||||
| 2025-07-18 | 13F | Dogwood Wealth Management LLC | 127,151 | -5.79 | 5,230 | -6.37 | ||||
| 2025-07-28 | 13F | Axxcess Wealth Management, Llc | 212,879 | 0.73 | 8,860 | 1.29 | ||||
| 2025-07-14 | 13F | Park Avenue Securities Llc | 464,250 | 8.33 | 19 | 11.76 | ||||
| 2025-08-18 | 13F/A | National Bank Of Canada /fi/ | 5,204 | 89.51 | 216 | 91.96 | ||||
| 2025-07-17 | 13F | LexAurum Advisors, LLC | 405,379 | 7.36 | 16,872 | 7.95 | ||||
| 2025-08-08 | 13F | Schwarz Dygos Wheeler Investment Advisors Llc | 19,173 | 3.74 | 798 | 4.31 | ||||
| 2025-07-22 | 13F | Wealthcare Advisory Partners LLC | 9,252 | 1.15 | 385 | 1.85 | ||||
| 2025-08-15 | 13F | CI Private Wealth, LLC | 409,239 | -80.59 | 17,033 | -80.48 | ||||
| 2025-07-24 | 13F | Endeavor Private Wealth, Inc. | 122,019 | 26.26 | 5,078 | 26.95 | ||||
| 2025-08-15 | 13F | Morgan Stanley | 3,640 | 113.36 | 151 | 115.71 | ||||
| 2025-07-17 | 13F | Oceanside Advisors LLC | 7,962 | -0.85 | 331 | -0.30 | ||||
| 2025-07-17 | 13F | SC&H Financial Advisors, Inc. | 65,881 | 4.18 | 2,742 | 4.74 | ||||
| 2025-08-14 | 13F | Wells Fargo & Company/mn | 111,883 | -45.50 | 4,657 | -45.20 | ||||
| 2025-08-21 | 13F | Aveo Capital Partners, LLC | 0 | -100.00 | 0 | |||||
| 2025-08-11 | 13F | Kingdom Financial Group LLC. | 14,464 | 602 | ||||||
| 2025-08-14 | 13F | CoreCap Advisors, LLC | 73,440 | 35.50 | 3,057 | 36.25 | ||||
| 2025-04-14 | 13F | Farther Finance Advisors, LLC | 0 | -100.00 | 0 | -100.00 | ||||
| 2025-08-14 | 13F | Mariner, LLC | 159,685 | 12.45 | 6,646 | 13.08 | ||||
| 2025-07-09 | 13F | Bank of New Hampshire | 12,450 | 518 | ||||||
| 2025-08-04 | 13F | Arcadia Wealth Management, Inc. | 60,929 | 6.01 | 2,536 | 6.60 | ||||
| 2025-08-14 | 13F | Eaton-Cambridge Inc. | 32,981 | -16.39 | 1,373 | -15.93 | ||||
| 2025-08-15 | 13F | Keel Point, LLC | 4,863 | 0.00 | 202 | 0.50 | ||||
| 2025-07-24 | 13F | WMG Financial Advisors, LLC | 37,046 | 6.29 | 1,542 | 6.87 | ||||
| 2025-07-25 | 13F | Cwm, Llc | 8,725 | -14.69 | 0 | |||||
| 2025-07-17 | 13F | Centennial Wealth Advisory LLC | 476,954 | 3.97 | 19,858 | 4.59 | ||||
| 2025-07-23 | 13F | Allegiance Financial Group Advisory Services LLC | 436,308 | 6.41 | 18,159 | 7.00 | ||||
| 2025-08-11 | 13F | Trajan Wealth LLC | 179,275 | -1.92 | 7,461 | -1.37 | ||||
| 2025-08-14 | 13F | Royal Bank Of Canada | 424,828 | 18.96 | 17,682 | 19.63 | ||||
| 2025-08-07 | 13F | Tillman Hartley LLC | 16,779 | 48.34 | 698 | 49.15 | ||||
| 2025-07-08 | 13F | Goldstone Financial Group, LLC | 19,560 | -5.03 | 809 | -5.16 | ||||
| 2025-07-21 | 13F | Keb Asset Management, Llc | 7,722 | 0.00 | 321 | 0.63 | ||||
| 2025-08-06 | 13F | Commonwealth Equity Services, Llc | 203,931 | 5.39 | 8 | 0.00 | ||||
| 2025-08-08 | 13F | Truepoint, Inc. | 51,540 | 5.61 | 2,145 | 6.24 | ||||
| 2025-08-12 | 13F | Nemes Rush Group LLC | 315 | 0.00 | 13 | 0.00 | ||||
| 2025-07-08 | 13F | Atwood & Palmer Inc | 6,635 | 0.00 | 276 | 0.73 | ||||
| 2025-07-09 | 13F | Dynamic Advisor Solutions LLC | 46,436 | 1,933 | ||||||
| 2025-07-31 | 13F | CVA Family Office, LLC | 2,170 | 0.00 | 90 | 1.12 | ||||
| 2025-07-22 | 13F | Simplicity Wealth,LLC | 2,191,612 | 112.45 | 91,215 | 113.63 | ||||
| 2025-09-04 | 13F/A | Advisor Group Holdings, Inc. | 547 | 1.30 | 23 | 0.00 | ||||
| 2025-07-31 | 13F | Orion Capital Management LLC | 1,463 | 61 | ||||||
| 2025-08-01 | 13F | Envestnet Asset Management Inc | 1,090,700 | 12.71 | 45,395 | 13.33 | ||||
| 2025-07-23 | 13F | Wealth Management Nebraska | 14,618 | -14.32 | 606 | -14.16 | ||||
| 2025-04-28 | 13F | Clune & Associates, Ltd. | 0 | -100.00 | 0 | |||||
| 2025-08-06 | 13F | Golden State Wealth Management, LLC | 15,852 | 4.95 | 660 | 5.44 | ||||
| 2025-05-06 | 13F | Financial Partners Group, Inc | 0 | -100.00 | 0 | -100.00 | ||||
| 2025-08-12 | 13F | Hill Investment Group Partners, LLC | 1,210,640 | -2.03 | 50,387 | -1.49 | ||||
| 2025-08-14 | 13F | Great Valley Advisor Group, Inc. | 110,272 | -10.95 | 4,589 | -10.46 | ||||
| 2025-08-12 | 13F | American Century Companies Inc | 178,198 | 10.90 | 7,417 | 11.52 | ||||
| 2025-08-13 | 13F | B&D White Capital Company, LLC | 128,882 | 1.75 | 5,364 | 2.33 | ||||
| 2025-07-15 | 13F | Highland Financial Advisors, LLC | 507,944 | 0.79 | 21,141 | 1.35 | ||||
| 2025-07-24 | 13F | Grand Wealth Management, Llc | 33,597 | -23.95 | 1,398 | -23.52 | ||||
| 2025-08-14 | 13F | IHT Wealth Management, LLC | 64,365 | 20.42 | 2,679 | 21.07 | ||||
| 2025-08-07 | 13F | Resources Investment Advisors, LLC. | 7,959 | -1.00 | 331 | -0.30 | ||||
| 2025-05-13 | 13F | Steward Partners Investment Advisory, Llc | 0 | -100.00 | 0 |