Mga Batayang Estadistika
| Pemilik Institusional | 80 total, 80 long only, 0 short only, 0 long/short - change of -8.99% MRQ |
| Alokasi Portofolio Rata-rata | 0.1113 % - change of 14.89% MRQ |
| Saham Institusional (Jangka Panjang) | 7,347,034 (ex 13D/G) - change of -0.15MM shares -2.05% MRQ |
| Nilai Institusional (Jangka Panjang) | $ 102,324 USD ($1000) |
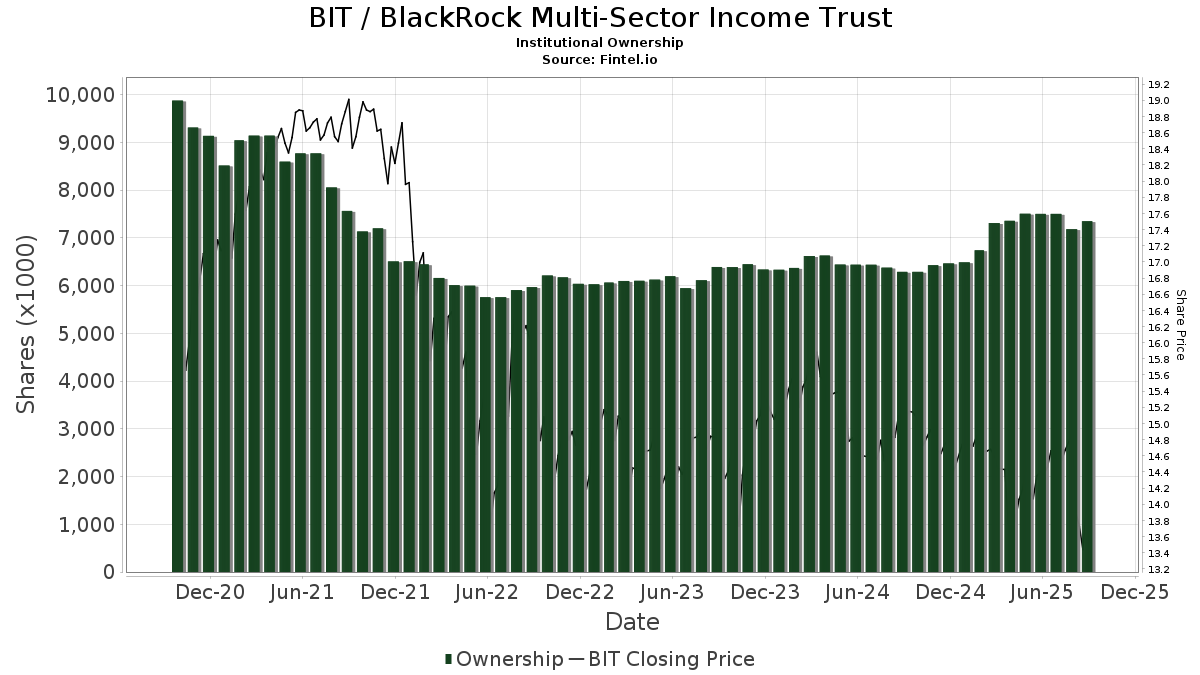
Kepemilikan Institusional dan Pemegang Saham
BlackRock Multi-Sector Income Trust (US:BIT) memiliki 80 pemilik institusional dan pemegang saham yang telah mengajukan formulir 13D/G atau 13F kepada Komisi Bursa Efek (Securities Exchange Commission/SEC). Lembaga-lembaga ini memegang total 7,347,034 saham. Pemegang saham terbesar meliputi Morgan Stanley, Cyndeo Wealth Partners, LLC, LPL Financial LLC, Ameriprise Financial Inc, Invesco Ltd., PCEF - Invesco CEF Income Composite ETF, Raymond James Financial Inc, Envestnet Asset Management Inc, UBS Group AG, and Guggenheim Capital Llc .
Struktur kepemilikan institusional BlackRock Multi-Sector Income Trust (NYSE:BIT) menunjukkan posisi terkini di perusahaan oleh institusi dan dana, serta perubahan terbaru dalam ukuran posisi. Pemegang saham utama dapat mencakup investor individu, reksa dana, dana lindung nilai, atau institusi. Jadwal 13D menunjukkan bahwa investor memegang (atau pernah memegang) lebih dari 5% saham perusahaan dan bermaksud (atau pernah bermaksud) untuk secara aktif mengejar perubahan strategi bisnis. Jadwal 13G menunjukkan investasi pasif lebih dari 5%.
The share price as of September 5, 2025 is 13.57 / share. Previously, on September 6, 2024, the share price was 14.91 / share. This represents a decline of 8.99% over that period.
Skor Sentimen Dana
Skor Sentimen Dana (sebelumnya dikenal sebagai Skor Akumulasi Kepemilikan) menemukan saham-saham yang paling banyak dibeli oleh dana. Ini adalah hasil dari model kuantitatif multi-faktor yang canggih yang mengidentifikasi perusahaan dengan tingkat akumulasi institusional tertinggi. Model penilaian menggunakan kombinasi dari total peningkatan pemilik yang diungkapkan, perubahan dalam alokasi portofolio pada pemilik tersebut, dan metrik lainnya. Angka berkisar dari 0 hingga 100, dengan angka yang lebih tinggi menunjukkan tingkat akumulasi yang lebih tinggi dibandingkan dengan perusahaan sejenisnya, dan 50 adalah rata-ratanya.
Frekuensi Pembaruan: Setiap Hari
Lihat Ownership Explorer, yang menyediakan daftar perusahaan dengan peringkat tertinggi.
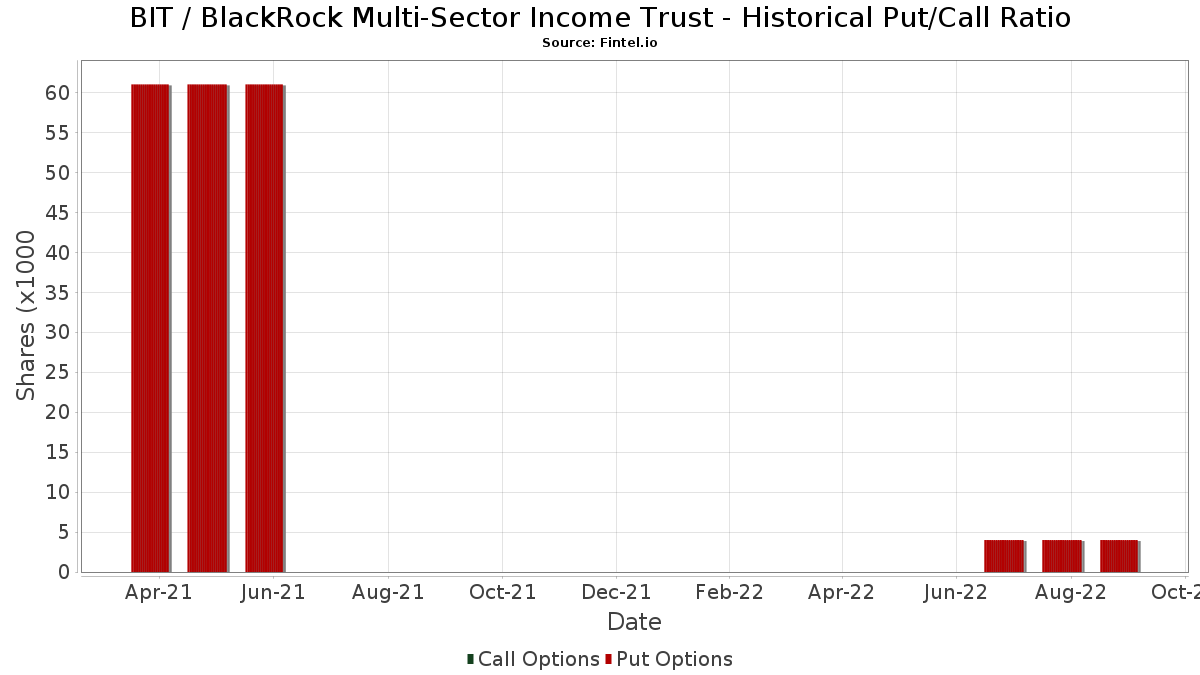
Rasio Put/Call Institusional
Selain melaporkan isu ekuitas dan utang standar, institusi dengan aset di bawah manajemen lebih dari 100 juta dolar AS juga harus mengungkapkan kepemilikan opsi put dan call mereka. Karena opsi put umumnya menunjukkan sentimen negatif, dan opsi call menunjukkan sentimen positif, kita dapat mengetahui sentimen institusional secara keseluruhan dengan memplot rasio put terhadap call. Grafik di sebelah kanan memplot rasio put/call historis untuk instrumen ini.
Menggunakan Rasio Put/Call sebagai indikator sentimen investor mengatasi salah satu kekurangan utama dari penggunaan total kepemilikan institusional, yaitu sejumlah besar aset yang dikelola diinvestasikan secara pasif untuk melacak indeks. Dana yang dikelola secara pasif biasanya tidak membeli opsi, sehingga indikator rasio put/call lebih akurat dalam melacak sentimen dana yang dikelola secara aktif.
Pengajuan 13F dan NPORT
Detail pada pengajuan 13F tersedia gratis. Detail pada pengajuan NP memerlukan keanggotaan premium. Baris berwarna hijau menunjukkan posisi baru. Baris berwarna merah menunjukkan posisi yang sudah ditutup. Klik tautan ini ikon untuk melihat riwayat transaksi selengkapnya.
Tingkatkan
untuk membuka data premium dan mengekspor ke Excel ![]() .
.
| Tanggal File | Sumber | Investor | Ketik | Presyo ng Avg (Silangan) |
Saham | Δ Saham (%) |
Dilaporkan Nilai ($1000) |
Nilai Δ (%) |
Alokasi Port (%) |
|
|---|---|---|---|---|---|---|---|---|---|---|
| 2025-08-29 | NP | GraniteShares ETF Trust - GraniteShares HIPS US High Income ETF | 191,623 | 6.67 | 2,798 | 7.54 | ||||
| 2025-08-27 | NP | THRIVENT SERIES FUND INC - Thrivent Diversified Income Plus Portfolio Class A | 11,523 | 0.00 | 168 | 1.20 | ||||
| 2025-08-06 | 13F | Smh Capital Advisors Inc | 12,416 | -1.57 | 181 | -0.55 | ||||
| 2025-07-31 | 13F | Curio Wealth, Llc | 0 | -100.00 | 0 | |||||
| 2025-08-01 | 13F | Envestnet Asset Management Inc | 290,990 | 9.21 | 4,248 | 10.11 | ||||
| 2025-07-11 | 13F | Farther Finance Advisors, LLC | 391 | 0.00 | 6 | 0.00 | ||||
| 2025-08-14 | 13F | Stifel Financial Corp | 18,305 | 1.25 | 267 | 2.30 | ||||
| 2025-08-11 | 13F | Western Wealth Management, LLC | 11,609 | 0.00 | 169 | 0.60 | ||||
| 2025-08-14 | 13F | Comerica Bank | 6,950 | 7.75 | 101 | 8.60 | ||||
| 2025-08-05 | 13F | Fourth Dimension Wealth, LLC | 1,000 | 0.00 | 15 | 0.00 | ||||
| 2025-09-04 | 13F/A | Advisor Group Holdings, Inc. | 119,618 | -3.31 | 1,746 | -2.51 | ||||
| 2025-08-06 | 13F | Walkner Condon Financial Advisors LLC | 14,243 | 0.00 | 208 | 0.49 | ||||
| 2025-08-14 | 13F | Royal Bank Of Canada | 217,447 | -4.76 | 3,174 | -3.96 | ||||
| 2025-08-06 | 13F | Pekin Hardy Strauss, Inc. | 70,365 | 189.99 | 1,027 | 192.59 | ||||
| 2025-07-25 | NP | FCEF - First Trust CEF Income Opportunity ETF This fund is a listed as child fund of First Trust Advisors Lp and if that institution has disclosed ownership in this security, then these positions will not be double counted when calculating total shares and total value | 23,030 | 16.00 | 328 | 12.37 | ||||
| 2025-07-10 | 13F | Contravisory Investment Management, Inc. | 0 | -100.00 | 0 | |||||
| 2025-07-24 | 13F | Us Bancorp \de\ | 0 | -100.00 | 0 | |||||
| 2025-04-21 | 13F | ORG Partners LLC | 0 | -100.00 | 0 | |||||
| 2025-08-13 | 13F | WCG Wealth Advisors LLC | 29,375 | 429 | ||||||
| 2025-08-14 | 13F | Sunbelt Securities, Inc. | 0 | -100.00 | 0 | |||||
| 2025-05-15 | 13F | WPG Advisers, LLC | 0 | -100.00 | 0 | |||||
| 2025-08-12 | 13F | LPL Financial LLC | 514,672 | 71.95 | 7,514 | 73.37 | ||||
| 2025-07-11 | 13F/A | Umb Bank N A/mo | 500 | 0.00 | 7 | 0.00 | ||||
| 2025-07-24 | 13F | Cyndeo Wealth Partners, LLC | 668,770 | -8.87 | 9,764 | -8.11 | ||||
| 2025-08-14 | 13F | Mariner, LLC | 103,697 | 26.46 | 1,514 | 27.46 | ||||
| 2025-05-16 | 13F | Coppell Advisory Solutions LLC | 0 | -100.00 | 0 | |||||
| 2025-08-26 | 13F/A | Thrivent Financial For Lutherans | 152,795 | 0.00 | 2 | 0.00 | ||||
| 2025-08-08 | 13F | Cetera Investment Advisers | 59,446 | 3.22 | 868 | 4.08 | ||||
| 2025-07-22 | 13F | DAVENPORT & Co LLC | 29,345 | -8.99 | 428 | -8.15 | ||||
| 2025-08-06 | 13F | Golden State Wealth Management, LLC | 1,120 | 2.00 | 16 | 6.67 | ||||
| 2025-08-14 | 13F | LaSalle St. Investment Advisors, LLC | 0 | -100.00 | 0 | |||||
| 2025-08-14 | 13F | Wells Fargo & Company/mn | 89,094 | -13.48 | 1,301 | -12.81 | ||||
| 2025-08-14 | 13F | GWM Advisors LLC | 84,429 | 2.03 | 1,233 | 2.84 | ||||
| 2025-08-11 | 13F | Semus Wealth Partners LLC | 26,118 | -4.53 | 381 | -3.79 | ||||
| 2025-08-18 | 13F | Geneos Wealth Management Inc. | 500 | 0.00 | 7 | 0.00 | ||||
| 2025-05-14 | 13F | Jane Street Group, Llc | 0 | -100.00 | 0 | |||||
| 2025-07-17 | 13F | Janney Montgomery Scott LLC | 65,493 | 11.65 | 1 | |||||
| 2025-07-31 | 13F | Cambridge Investment Research Advisors, Inc. | 67,734 | -44.09 | 1 | -100.00 | ||||
| 2025-08-14 | 13F | Ameriprise Financial Inc | 435,963 | -28.88 | 6,365 | -28.17 | ||||
| 2025-08-07 | 13F | Readystate Asset Management Lp | 0 | -100.00 | 0 | |||||
| 2025-08-05 | 13F | GPS Wealth Strategies Group, LLC | 1,900 | 0.00 | 28 | 0.00 | ||||
| 2025-08-08 | 13F | Pnc Financial Services Group, Inc. | 500 | 0.00 | 7 | 0.00 | ||||
| 2025-08-01 | 13F | Gwn Securities Inc. | 14,620 | 213 | ||||||
| 2025-08-27 | NP | THRIVENT SERIES FUND INC - Thrivent Balanced Income Plus Portfolio Class A | 4,532 | 0.00 | 66 | 1.54 | ||||
| 2025-08-14 | 13F | CoreCap Advisors, LLC | 4,400 | -18.52 | 64 | -17.95 | ||||
| 2025-07-21 | 13F | Ameritas Advisory Services, LLC | 580 | 8 | ||||||
| 2025-08-07 | 13F | Allworth Financial LP | 100 | 0.00 | 1 | 0.00 | ||||
| 2025-08-06 | 13F | Wedbush Securities Inc | 14,491 | 0 | ||||||
| 2025-07-18 | 13F | Truist Financial Corp | 116,774 | 8.09 | 1,705 | 8.95 | ||||
| 2025-07-14 | 13F | AdvisorNet Financial, Inc | 1,045 | 15 | ||||||
| 2025-07-17 | 13F | GraniteShares Advisors LLC | 191,623 | 6.67 | 2,798 | 7.54 | ||||
| 2025-05-05 | 13F | Transce3nd, LLC | 0 | -100.00 | 0 | |||||
| 2025-07-23 | 13F | Clear Creek Financial Management, LLC | 0 | -100.00 | 0 | |||||
| 2025-08-13 | 13F | Northwestern Mutual Wealth Management Co | 9,980 | 0.00 | 146 | 0.69 | ||||
| 2025-04-30 | 13F | Ramiah Investment Group | 34,274 | 496 | ||||||
| 2025-08-27 | NP | AAHYX - Thrivent Diversified Income Plus Fund Class A | 18,346 | 0.00 | 268 | 0.75 | ||||
| 2025-07-10 | 13F | Wealth Enhancement Advisory Services, Llc | 0 | -100.00 | 0 | |||||
| 2025-08-14 | 13F/A | Rockefeller Capital Management L.P. | 46,484 | 12.04 | 679 | 13.00 | ||||
| 2025-08-14 | 13F | Raymond James Financial Inc | 344,499 | -8.64 | 5,030 | -7.89 | ||||
| 2025-08-13 | 13F | Cerity Partners LLC | 53,209 | 0.01 | 777 | 0.78 | ||||
| 2025-08-13 | 13F | Guggenheim Capital Llc | 271,427 | 65.99 | 3,963 | 67.38 | ||||
| 2025-08-13 | 13F | First Trust Advisors Lp | 61,478 | 7.09 | 898 | 7.94 | ||||
| 2025-08-11 | 13F | HighTower Advisors, LLC | 12,510 | -4.57 | 183 | -3.70 | ||||
| 2025-07-29 | 13F | Private Trust Co Na | 5,242 | 0.00 | 77 | 1.33 | ||||
| 2025-08-27 | NP | THRIVENT SERIES FUND INC - Thrivent Opportunity Income Plus Portfolio Class A | 8,813 | 0.00 | 129 | 0.79 | ||||
| 2025-07-16 | 13F | ORG Wealth Partners, LLC | 3,343 | 0.00 | 49 | 0.00 | ||||
| 2025-07-23 | 13F | Elm3 Financial Group, LLC | 27,261 | 6.76 | 398 | 7.86 | ||||
| 2025-08-05 | 13F | Shaker Financial Services, LLC | 0 | -100.00 | 0 | |||||
| 2025-08-15 | 13F | Morgan Stanley | 1,286,694 | -4.82 | 18,786 | -4.03 | ||||
| 2025-06-26 | NP | AAINX - Thrivent Opportunity Income Plus Fund Class A | 39,295 | 0.00 | 552 | -4.83 | ||||
| 2025-07-08 | 13F | Webster Bank, N. A. | 2,255 | 0.00 | 33 | 0.00 | ||||
| 2025-08-12 | 13F | Steward Partners Investment Advisory, Llc | 100,237 | 13.49 | 1,463 | 14.48 | ||||
| 2025-08-13 | 13F | Invesco Ltd. | 351,527 | -1.00 | 5,132 | -0.18 | ||||
| 2025-07-29 | 13F | Stratos Wealth Partners, LTD. | 14,385 | 210 | ||||||
| 2025-08-04 | 13F | Spire Wealth Management | 10,000 | 0.00 | 146 | 1.39 | ||||
| 2025-07-25 | 13F | Concurrent Investment Advisors, LLC | 14,069 | 15.13 | 205 | 16.48 | ||||
| 2025-08-11 | 13F | Elequin Capital Lp | 0 | -100.00 | 0 | |||||
| 2025-08-11 | 13F | Principal Securities, Inc. | 9,165 | 1.04 | 134 | 0.76 | ||||
| 2025-08-15 | 13F | Tower Research Capital LLC (TRC) | 7 | 0 | ||||||
| 2025-07-25 | 13F | Atria Wealth Solutions, Inc. | 0 | -100.00 | 0 | |||||
| 2025-07-28 | NP | PCEF - Invesco CEF Income Composite ETF This fund is a listed as child fund of Invesco Ltd. and if that institution has disclosed ownership in this security, then these positions will not be double counted when calculating total shares and total value | 348,196 | 2.15 | 4,955 | -1.06 | ||||
| 2025-08-14 | 13F | UBS Group AG | 280,667 | -0.20 | 4,098 | 0.61 | ||||
| 2025-04-09 | 13F | St Germain D J Co Inc | 0 | 0 | ||||||
| 2025-08-07 | 13F | Evoke Wealth, Llc | 79,506 | 0.00 | 1,161 | 0.78 | ||||
| 2025-08-14 | 13F | Snowden Capital Advisors LLC | 29,688 | -2.08 | 433 | -1.37 | ||||
| 2025-06-26 | NP | AABFX - Thrivent Balanced Income Plus Fund Class A | 4,902 | 0.00 | 69 | -5.56 | ||||
| 2025-04-16 | 13F | West Oak Capital, LLC | 0 | -100.00 | 0 | |||||
| 2025-08-05 | 13F | Bank of New York Mellon Corp | 132,289 | 1,931 | ||||||
| 2025-08-19 | 13F | Advisory Services Network, LLC | 21,472 | -4.45 | 315 | -3.08 | ||||
| 2025-07-14 | 13F | E&G Advisors, LP | 78,400 | -1.38 | 1,145 | -0.61 | ||||
| 2025-08-05 | 13F | Westside Investment Management, Inc. | 0 | -100.00 | 0 | |||||
| 2025-08-04 | 13F | Creekmur Asset Management LLC | 4,719 | 161.44 | 69 | 161.54 | ||||
| 2025-07-14 | 13F | U.S. Capital Wealth Advisors, LLC | 0 | -100.00 | 0 | |||||
| 2025-08-06 | 13F | Commonwealth Equity Services, Llc | 33,719 | 4.05 | 0 | |||||
| 2025-08-12 | 13F | Proequities, Inc. | 0 | 0 | ||||||
| 2025-07-07 | 13F | First Citizens Financial Corp | 15,603 | 0.00 | 228 | 0.89 | ||||
| 2025-05-12 | 13F | Virtu Financial LLC | 0 | -100.00 | 0 | |||||
| 2025-08-12 | 13F | Founders Financial Alliance, LLC | 0 | -100.00 | 0 | |||||
| 2025-04-24 | 13F | Primoris Wealth Advisors, Llc | 0 | -100.00 | 0 | |||||
| 2025-05-12 | 13F | Wolverine Asset Management Llc | 0 | -100.00 | 0 | |||||
| 2025-05-14 | 13F | Landscape Capital Management, L.l.c. | 0 | -100.00 | 0 | |||||
| 2025-07-28 | 13F | Harbour Investments, Inc. | 1,276 | 0.00 | 19 | 0.00 | ||||
| 2025-05-13 | 13F | Verus Capital Partners, Llc | 0 | -100.00 | 0 | |||||
| 2025-08-14 | 13F | EP Wealth Advisors, Inc. | 10,479 | -4.55 | 153 | -3.80 | ||||
| 2025-08-14 | 13F | Bank Of America Corp /de/ | 216,549 | -1.94 | 3,162 | -1.13 | ||||
| 2025-08-11 | 13F | Private Advisor Group, LLC | 54,061 | -17.15 | 789 | -16.42 | ||||
| 2025-08-12 | 13F | Boreal Capital Management LLC | 0 | 455 | ||||||
| 2025-08-14 | 13F | Wiley Bros.-aintree Capital, Llc | 13,108 | 6.60 | 191 | 7.91 | ||||
| 2025-08-13 | 13F | StoneX Group Inc. | 0 | -100.00 | 0 | -100.00 |