Mga Batayang Estadistika
| Pemilik Institusional | 123 total, 122 long only, 0 short only, 1 long/short - change of 12.84% MRQ |
| Alokasi Portofolio Rata-rata | 1.1377 % - change of -6.01% MRQ |
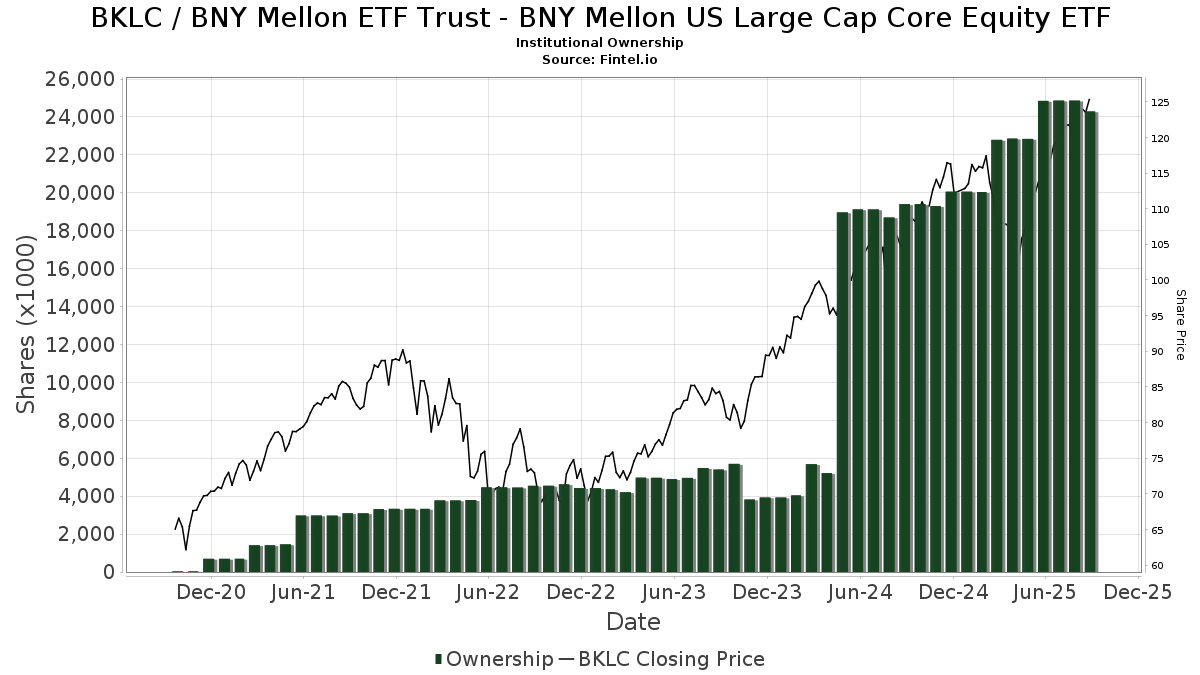
| Saham Institusional (Jangka Panjang) | 24,293,265 (ex 13D/G) - change of -0.56MM shares -2.24% MRQ |
| Nilai Institusional (Jangka Panjang) | $ 2,867,222 USD ($1000) |
Kepemilikan Institusional dan Pemegang Saham
BNY Mellon ETF Trust - BNY Mellon US Large Cap Core Equity ETF (US:BKLC) memiliki 123 pemilik institusional dan pemegang saham yang telah mengajukan formulir 13D/G atau 13F kepada Komisi Bursa Efek (Securities Exchange Commission/SEC). Lembaga-lembaga ini memegang total 24,293,265 saham. Pemegang saham terbesar meliputi RPOA Advisors, Inc., Integrated Wealth Concepts LLC, Bank of New York Mellon Corp, Sentinel Pension Advisors Inc, RAA - SMI 3Fourteen Real Asset Allocation ETF SMI 3Fourteen REAL Asset Allocation ETF, Stadion Money Management, LLC, Toroso Investments, LLC, GM Advisory Group, Inc., Ameriprise Financial Inc, and Northwestern Mutual Wealth Management Co .
Struktur kepemilikan institusional BNY Mellon ETF Trust - BNY Mellon US Large Cap Core Equity ETF (ARCA:BKLC) menunjukkan posisi terkini di perusahaan oleh institusi dan dana, serta perubahan terbaru dalam ukuran posisi. Pemegang saham utama dapat mencakup investor individu, reksa dana, dana lindung nilai, atau institusi. Jadwal 13D menunjukkan bahwa investor memegang (atau pernah memegang) lebih dari 5% saham perusahaan dan bermaksud (atau pernah bermaksud) untuk secara aktif mengejar perubahan strategi bisnis. Jadwal 13G menunjukkan investasi pasif lebih dari 5%.
The share price as of September 5, 2025 is 124.12 / share. Previously, on September 6, 2024, the share price was 102.72 / share. This represents an increase of 20.83% over that period.
Skor Sentimen Dana
Skor Sentimen Dana (sebelumnya dikenal sebagai Skor Akumulasi Kepemilikan) menemukan saham-saham yang paling banyak dibeli oleh dana. Ini adalah hasil dari model kuantitatif multi-faktor yang canggih yang mengidentifikasi perusahaan dengan tingkat akumulasi institusional tertinggi. Model penilaian menggunakan kombinasi dari total peningkatan pemilik yang diungkapkan, perubahan dalam alokasi portofolio pada pemilik tersebut, dan metrik lainnya. Angka berkisar dari 0 hingga 100, dengan angka yang lebih tinggi menunjukkan tingkat akumulasi yang lebih tinggi dibandingkan dengan perusahaan sejenisnya, dan 50 adalah rata-ratanya.
Frekuensi Pembaruan: Setiap Hari
Lihat Ownership Explorer, yang menyediakan daftar perusahaan dengan peringkat tertinggi.
Rasio Put/Call Institusional
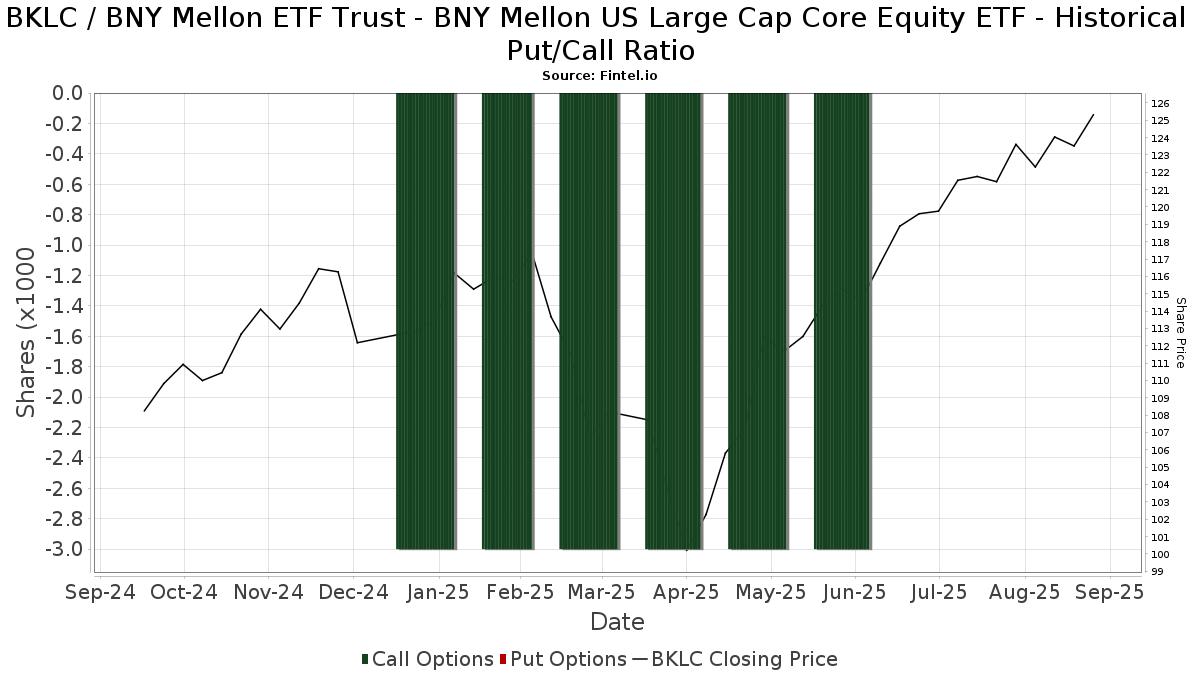
Selain melaporkan isu ekuitas dan utang standar, institusi dengan aset di bawah manajemen lebih dari 100 juta dolar AS juga harus mengungkapkan kepemilikan opsi put dan call mereka. Karena opsi put umumnya menunjukkan sentimen negatif, dan opsi call menunjukkan sentimen positif, kita dapat mengetahui sentimen institusional secara keseluruhan dengan memplot rasio put terhadap call. Grafik di sebelah kanan memplot rasio put/call historis untuk instrumen ini.
Menggunakan Rasio Put/Call sebagai indikator sentimen investor mengatasi salah satu kekurangan utama dari penggunaan total kepemilikan institusional, yaitu sejumlah besar aset yang dikelola diinvestasikan secara pasif untuk melacak indeks. Dana yang dikelola secara pasif biasanya tidak membeli opsi, sehingga indikator rasio put/call lebih akurat dalam melacak sentimen dana yang dikelola secara aktif.
Pengajuan 13F dan NPORT
Detail pada pengajuan 13F tersedia gratis. Detail pada pengajuan NP memerlukan keanggotaan premium. Baris berwarna hijau menunjukkan posisi baru. Baris berwarna merah menunjukkan posisi yang sudah ditutup. Klik tautan ini ikon untuk melihat riwayat transaksi selengkapnya.
Tingkatkan
untuk membuka data premium dan mengekspor ke Excel ![]() .
.
| Tanggal File | Sumber | Investor | Ketik | Presyo ng Avg (Silangan) |
Saham | Δ Saham (%) |
Dilaporkan Nilai ($1000) |
Nilai Δ (%) |
Alokasi Port (%) |
|
|---|---|---|---|---|---|---|---|---|---|---|
| 2025-08-12 | 13F | Jpmorgan Chase & Co | 112,192 | 539.09 | 13,287 | 612.00 | ||||
| 2025-08-29 | NP | RAA - SMI 3Fourteen Real Asset Allocation ETF SMI 3Fourteen REAL Asset Allocation ETF | 808,422 | 8.01 | 95,741 | 20.32 | ||||
| 2025-07-09 | 13F | WealthCare Investment Partners, LLC | 2,848 | 0.00 | 342 | 22.22 | ||||
| 2025-08-12 | 13F | Quadcap Wealth Management, LLC | 5,604 | 0.11 | 664 | 11.43 | ||||
| 2025-07-25 | 13F | Concord Wealth Partners | 0 | -100.00 | 0 | |||||
| 2025-08-11 | 13F | Aptus Capital Advisors, LLC | 179,103 | 335.02 | 21,211 | 384.60 | ||||
| 2025-05-05 | 13F | Transce3nd, LLC | 0 | -100.00 | 0 | |||||
| 2025-08-14 | 13F | Mariner, LLC | 2,645 | -45.69 | 313 | -39.46 | ||||
| 2025-07-08 | 13F | Parallel Advisors, LLC | 50 | 0.00 | 6 | 0.00 | ||||
| 2025-08-04 | 13F | Assetmark, Inc | 0 | -100.00 | 0 | |||||
| 2025-08-11 | 13F | CFS Investment Advisory Services, LLC | 0 | -100.00 | 0 | |||||
| 2025-08-13 | 13F | Northwestern Mutual Wealth Management Co | 307,822 | 12.69 | 36,455 | 25.53 | ||||
| 2025-08-14 | 13F | Jane Street Group, Llc | 21,406 | 106.03 | 2,535 | 129.62 | ||||
| 2025-08-18 | 13F | Geneos Wealth Management Inc. | 1,857 | 44.51 | 220 | 61.03 | ||||
| 2025-08-08 | 13F | Cetera Investment Advisers | 56,685 | 4.20 | 6,713 | 16.08 | ||||
| 2025-08-13 | 13F | Capital Analysts, Inc. | 375 | 13.64 | 0 | |||||
| 2025-08-15 | 13F | CI Private Wealth, LLC | 2,482 | -17.46 | 294 | -8.15 | ||||
| 2025-08-05 | 13F | Bank of New York Mellon Corp | 1,798,063 | -40.91 | 212,945 | -34.18 | ||||
| 2025-08-05 | 13F | Bank Of Montreal /can/ | 5,270 | 0.00 | 624 | 11.43 | ||||
| 2025-08-12 | 13F | DiMeo Schneider & Associates, L.L.C. | 2,495 | 0.00 | 295 | 11.32 | ||||
| 2025-08-06 | 13F | Commonwealth Equity Services, Llc | 8,139 | 45.08 | 1 | |||||
| 2025-08-14 | 13F | Susquehanna International Group, Llp | 34,196 | -7.28 | 4,050 | 3.26 | ||||
| 2025-07-29 | 13F | Pinnacle Wealth Management, LLC | 4,983 | -4.65 | 590 | 6.31 | ||||
| 2025-07-16 | 13F | Wealth Group Ltd | 13,534 | 1,603 | ||||||
| 2025-07-23 | 13F | REAP Financial Group, LLC | 760 | 0.00 | 90 | 12.50 | ||||
| 2025-07-10 | 13F | Kmg Fiduciary Partners, Llc | 67,389 | 4.40 | 7,981 | 16.28 | ||||
| 2025-07-24 | 13F | Stiles Financial Services Inc | 27,469 | -22.64 | 3,254 | -13.85 | ||||
| 2025-07-29 | 13F | Crux Wealth Advisors | 60,473 | 113.31 | 7,162 | 137.59 | ||||
| 2025-07-15 | 13F | Define Financial, Llc | 1,703 | 202 | ||||||
| 2025-08-14 | 13F | Goldman Sachs Group Inc | 1,814 | 215 | ||||||
| 2025-08-01 | NP | Advisors Preferred Trust - Dynamic Alpha Macro Fund Institutional Class Shares | 89,643 | 0.00 | 10,616 | 11.40 | ||||
| 2025-08-13 | 13F | Northern Trust Corp | 1,905 | 0.00 | 226 | 11.39 | ||||
| 2025-08-11 | 13F | Goodman Financial Corp | 0 | -100.00 | 0 | |||||
| 2025-08-08 | 13F | Empower Advisory Group, LLC | 2,310 | 274 | ||||||
| 2025-08-15 | 13F | Equitable Holdings, Inc. | 56,607 | 70.43 | 6,704 | 89.83 | ||||
| 2025-08-01 | 13F | Zhang Financial LLC | 305,121 | 8.15 | 36,136 | 20.47 | ||||
| 2025-08-08 | 13F | Compass Wealth Management LLC | 0 | -100.00 | 0 | |||||
| 2025-08-14 | 13F | Raymond James Financial Inc | 4,105 | 3.45 | 486 | 15.44 | ||||
| 2025-07-10 | 13F | Wealth Enhancement Advisory Services, Llc | 2,377 | -96.94 | 285 | -96.55 | ||||
| 2025-05-13 | 13F | Neuberger Berman Group LLC | 0 | -100.00 | 0 | |||||
| 2025-07-21 | 13F | Single Point Partners, LLC | 9,037 | 1 | ||||||
| 2025-08-05 | 13F | Simplex Trading, Llc | 41 | 0 | ||||||
| 2025-07-29 | 13F | BKD Wealth Advisors, LLC | 2,079 | 246 | ||||||
| 2025-07-29 | 13F | Woodard & Co Asset Management Group Inc /adv | 230,107 | 2,868.74 | 27,252 | 3,207.16 | ||||
| 2025-08-11 | 13F | Wealthspire Advisors, LLC | 7,874 | 932 | ||||||
| 2025-04-10 | 13F | Retireful, LLC | 0 | -100.00 | 0 | |||||
| 2025-08-15 | 13F | Lantern Wealth Advisors, LLC | 5,822 | 89.52 | 690 | 100.29 | ||||
| 2025-05-15 | 13F | GWM Advisors LLC | 0 | -100.00 | 0 | |||||
| 2025-08-01 | 13F | Envestnet Asset Management Inc | 74,631 | 62.25 | 8,839 | 80.74 | ||||
| 2025-08-14 | 13F | Integrated Wealth Concepts LLC | 2,427,445 | 11.76 | 287,482 | 24.48 | ||||
| 2025-07-25 | 13F | We Are One Seven, LLC | 132,111 | -10.04 | 15,646 | 0.20 | ||||
| 2025-08-14 | 13F | Ameriprise Financial Inc | 364,511 | 5.38 | 43,169 | 17.38 | ||||
| 2025-08-12 | 13F | Proequities, Inc. | 0 | 0 | ||||||
| 2025-08-14 | 13F | CoreCap Advisors, LLC | 9 | 1 | ||||||
| 2025-04-23 | 13F | Win Advisors, Inc | 0 | -100.00 | 0 | |||||
| 2025-07-25 | 13F | Atria Wealth Solutions, Inc. | 11,060 | -16.11 | 1,327 | -5.35 | ||||
| 2025-08-12 | 13F | LPL Financial LLC | 181,577 | -45.71 | 21,504 | -39.53 | ||||
| 2025-08-14 | 13F | UBS Group AG | 78,070 | 6.25 | 9,246 | 18.36 | ||||
| 2025-08-15 | 13F | Kestra Advisory Services, LLC | 97,978 | -2.46 | 11,604 | 8.65 | ||||
| 2025-08-04 | 13F | Spire Wealth Management | 16 | 0.00 | 2 | 0.00 | ||||
| 2025-08-11 | 13F | FSA Wealth Management LLC | 316 | 37 | ||||||
| 2025-08-14 | 13F | Fort Point Capital Partners LLC | 11,735 | 0.70 | 1,390 | 12.20 | ||||
| 2025-08-13 | 13F | Flow Traders U.s. Llc | 24,868 | 58.26 | 3 | 100.00 | ||||
| 2025-07-14 | 13F | Sowell Financial Services LLC | 2,330 | 0.00 | 276 | 11.34 | ||||
| 2025-08-08 | 13F | Capital Investment Advisory Services, LLC | 3,603 | 34.79 | 427 | 50.00 | ||||
| 2025-07-03 | 13F | Collective Family Office Llc | 11,657 | 8.05 | 1,381 | 20.31 | ||||
| 2025-08-06 | 13F | First Horizon Advisors, Inc. | 364 | -11.86 | 43 | 0.00 | ||||
| 2025-08-13 | 13F | Cerity Partners LLC | 2,443 | -31.01 | 289 | -23.14 | ||||
| 2025-08-13 | 13F | First Trust Advisors Lp | 1,968 | -61.05 | 233 | -56.61 | ||||
| 2025-05-15 | 13F | DZ BANK AG Deutsche Zentral Genossenschafts Bank, Frankfurt am Main | 0 | -100.00 | 0 | |||||
| 2025-06-27 | NP | DUBS - Aptus Large Cap Enhanced Yield ETF | 57,414 | 8.79 | 6,074 | -0.30 | ||||
| 2025-09-04 | 13F/A | Advisor Group Holdings, Inc. | 163,741 | 3.74 | 19,393 | 15.55 | ||||
| 2025-07-29 | NP | EBI - Longview Advantage ETF | 0 | -100.00 | 0 | -100.00 | ||||
| 2025-08-12 | 13F | CIBC Private Wealth Group, LLC | 150 | 0.00 | 18 | 21.43 | ||||
| 2025-08-14 | 13F | Fmr Llc | 14,719 | 250.20 | 1,743 | 290.81 | ||||
| 2025-07-17 | 13F | David Kennon Inc | 18,779 | 2.96 | 2,224 | 14.65 | ||||
| 2025-07-25 | 13F | Sequoia Financial Advisors, LLC | 1,840 | 218 | ||||||
| 2025-07-15 | 13F | Retirement Income Solutions, Inc | 7,460 | 0.00 | 883 | 11.35 | ||||
| 2025-08-12 | 13F | Wealthbridge Capital Management, Llc | 140,671 | 6.33 | 16,660 | 18.43 | ||||
| 2025-05-13 | 13F | Watchman Group, Inc. | 0 | -100.00 | 0 | |||||
| 2025-08-08 | 13F | Pnc Financial Services Group, Inc. | 350 | 0.00 | 41 | 10.81 | ||||
| 2025-08-11 | 13F | Principal Securities, Inc. | 4,229 | -0.94 | 501 | 4.60 | ||||
| 2025-07-14 | 13F | Sentinel Pension Advisors Inc | 852,649 | 2.00 | 100,979 | 13.62 | ||||
| 2025-08-15 | 13F/A | Symphony Financial, Ltd. Co. | 22,164 | 2,635 | ||||||
| 2025-08-14 | 13F | Principia Wealth Advisory, LLC | 13,521 | 1,601 | ||||||
| 2025-08-27 | 13F/A | Brinker Capital Investments, LLC | 9,230 | 1,093 | ||||||
| 2025-08-14 | 13F | Toroso Investments, LLC | 553,746 | -12.73 | 65,395 | -3.06 | ||||
| 2025-08-14 | 13F | Herold Advisors, Inc. | 14,526 | -17.23 | 1,720 | -7.77 | ||||
| 2025-07-31 | 13F | Cambridge Investment Research Advisors, Inc. | 2,337 | 16.04 | 0 | |||||
| 2025-08-08 | 13F | Cornerstone Advisors Asset Management, Inc | 14,300 | 0.00 | 1,694 | 11.38 | ||||
| 2025-08-14 | 13F | Bank Of America Corp /de/ | 6,592 | -1.36 | 781 | 9.86 | ||||
| 2025-07-29 | 13F | RPOA Advisors, Inc. | 12,726,372 | -2.40 | 1,507,184 | 8.72 | ||||
| 2025-08-04 | 13F | JDM Financial Group LLC | 235,158 | 10.22 | 27,850 | 22.78 | ||||
| 2025-08-14 | 13F | Old Mission Capital Llc | 3,009 | 356 | ||||||
| 2025-06-30 | NP | SMIDX - SMI Dynamic Allocation Fund | 8,460 | 895 | ||||||
| 2025-08-15 | 13F | Morgan Stanley | 110,223 | 275.36 | 13,054 | 318.10 | ||||
| 2025-08-13 | 13F | EverSource Wealth Advisors, LLC | 195 | 0.00 | 23 | 15.00 | ||||
| 2025-08-13 | 13F | Wills Financial Group LLC | 1,700 | -15.30 | 201 | -5.63 | ||||
| 2025-08-08 | 13F | Accredited Investors Inc. | 1,946 | 230 | ||||||
| 2025-08-14 | 13F | Royal Bank Of Canada | 5,040 | 26.16 | 597 | 40.47 | ||||
| 2025-08-14 | 13F | Hrt Financial Lp | 0 | -100.00 | 0 | |||||
| 2025-08-14 | 13F | McIlrath & Eck, LLC | 8 | 0.00 | 1 | |||||
| 2025-07-29 | 13F | ShoreHaven Wealth Partners, LLC | 4,020 | -3.55 | 476 | 7.45 | ||||
| 2025-08-07 | 13F | Wealth Forward, LLC | 20,232 | -0.08 | 2,396 | 11.34 | ||||
| 2025-07-28 | 13F | Harbour Investments, Inc. | 166 | 0.00 | 20 | 11.76 | ||||
| 2025-07-25 | 13F | Envestnet Portfolio Solutions, Inc. | 0 | -100.00 | 0 | |||||
| 2025-05-13 | 13F | Prime Capital Investment Advisors, LLC | 0 | -100.00 | 0 | |||||
| 2025-07-22 | 13F | Carolina Wealth Advisors, LLC | 894 | 106 | ||||||
| 2025-08-05 | 13F | Advisors Preferred, LLC | 89,643 | 0.00 | 10,607 | 10.57 | ||||
| 2025-07-22 | 13F | Duncan Williams Asset Management, LLC | 3,152 | 373 | ||||||
| 2025-07-25 | 13F | Concurrent Investment Advisors, LLC | 16,918 | 7.36 | 2,004 | 19.58 | ||||
| 2025-08-01 | 13F | Transcend Wealth Collective, Llc | 2,010 | 0.00 | 238 | 11.74 | ||||
| 2025-05-14 | 13F | Hill Investment Group Partners, LLC | 0 | -100.00 | 0 | |||||
| 2025-08-05 | 13F | Key FInancial Inc | 139 | 0.00 | 16 | 14.29 | ||||
| 2025-08-14 | 13F | Mercer Global Advisors Inc /adv | 6,421 | 0.34 | 760 | 11.76 | ||||
| 2025-08-14 | 13F | Mml Investors Services, Llc | 12,712 | 81.70 | 2 | |||||
| 2025-08-04 | 13F | Creekmur Asset Management LLC | 276 | 33 | ||||||
| 2025-07-24 | 13F | IFP Advisors, Inc | 63,259 | 139.90 | 7,492 | 167.25 | ||||
| 2025-07-22 | 13F | Kickstand Ventures, Llc. | 3,152 | -5.15 | 373 | 5.67 | ||||
| 2025-08-11 | 13F | HighTower Advisors, LLC | 3,556 | 0.28 | 421 | 11.67 | ||||
| 2025-08-12 | 13F | Insigneo Advisory Services, Llc | 7,869 | -0.54 | 932 | 10.70 | ||||
| 2025-07-17 | 13F | One Wealth Advisors, LLC | 3,347 | 19.62 | 396 | 33.33 | ||||
| 2025-08-14 | 13F | Betterment LLC | 4,120 | -30.63 | 0 | |||||
| 2025-08-14 | 13F | Stadion Money Management, LLC | 728,410 | -6.40 | 86,027 | 3.97 | ||||
| 2025-07-29 | 13F | Stratos Wealth Partners, LTD. | 14,746 | -46.78 | 1,746 | -40.73 | ||||
| 2025-08-12 | 13F | Global Retirement Partners, LLC | 617 | 26.43 | 73 | 35.19 | ||||
| 2025-08-04 | 13F | Mayflower Financial Advisors, LLC | 4,248 | 5.78 | 503 | 18.08 | ||||
| 2025-08-07 | 13F | BOK Financial Private Wealth, Inc. | 1,905 | 0.00 | 226 | 11.39 | ||||
| 2025-06-30 | NP | SMILX - SMI 50/40/10 Fund | 2,470 | 261 | ||||||
| 2025-08-01 | 13F | Belvedere Trading LLC | Call | 3,600 | 9.09 | 426 | 21.71 | |||
| 2025-07-17 | 13F | Clear Point Advisors Inc. | 3,058 | 12.55 | 362 | 25.69 | ||||
| 2025-08-01 | 13F | Belvedere Trading LLC | Put | 100 | 12 | |||||
| 2025-04-29 | 13F | Resources Investment Advisors, LLC. | 0 | -100.00 | 0 | |||||
| 2025-08-05 | 13F | Sigma Planning Corp | 14,876 | 1,762 | ||||||
| 2025-08-13 | 13F | GM Advisory Group, Inc. | 452,842 | 8.46 | 53,630 | 20.81 | ||||
| 2025-08-14 | 13F | Dean, Jacobson Financial Services, LLC | 3,646 | 432 | ||||||
| 2025-08-12 | 13F | Steward Partners Investment Advisory, Llc | 5,323 | 4.03 | 630 | 15.81 | ||||
| 2025-08-13 | 13F | M&t Bank Corp | 2,492 | -68.12 | 295 | -64.50 | ||||
| 2025-08-14 | 13F | Wells Fargo & Company/mn | 1,958 | -53.15 | 232 | -47.97 | ||||
| 2025-08-11 | 13F | Trajan Wealth LLC | 0 | -100.00 | 0 | |||||
| 2025-05-09 | 13F | Belvedere Trading LLC | 0 | -100.00 | 0 | -100.00 | ||||
| 2025-07-31 | 13F | GenTrust, LLC | 35,370 | 842.95 | 4,189 | 952.26 | ||||
| 2025-08-19 | 13F | Advisory Services Network, LLC | 16,022 | 1,951 | ||||||
| 2025-07-14 | 13F | Park Avenue Securities Llc | 10,768 | 1 | ||||||
| 2025-08-14 | 13F | Two Sigma Investments, Lp | 90,600 | 10,730 | ||||||
| 2025-05-02 | 13F | Wealthfront Advisers Llc | 0 | -100.00 | 0 | -100.00 |