Mga Batayang Estadistika
| Pemilik Institusional | 83 total, 83 long only, 0 short only, 0 long/short - change of 0.00% MRQ |
| Alokasi Portofolio Rata-rata | 0.1994 % - change of 37.84% MRQ |
| Saham Institusional (Jangka Panjang) | 12,388,498 (ex 13D/G) - change of 0.34MM shares 2.83% MRQ |
| Nilai Institusional (Jangka Panjang) | $ 167,559 USD ($1000) |
Kepemilikan Institusional dan Pemegang Saham
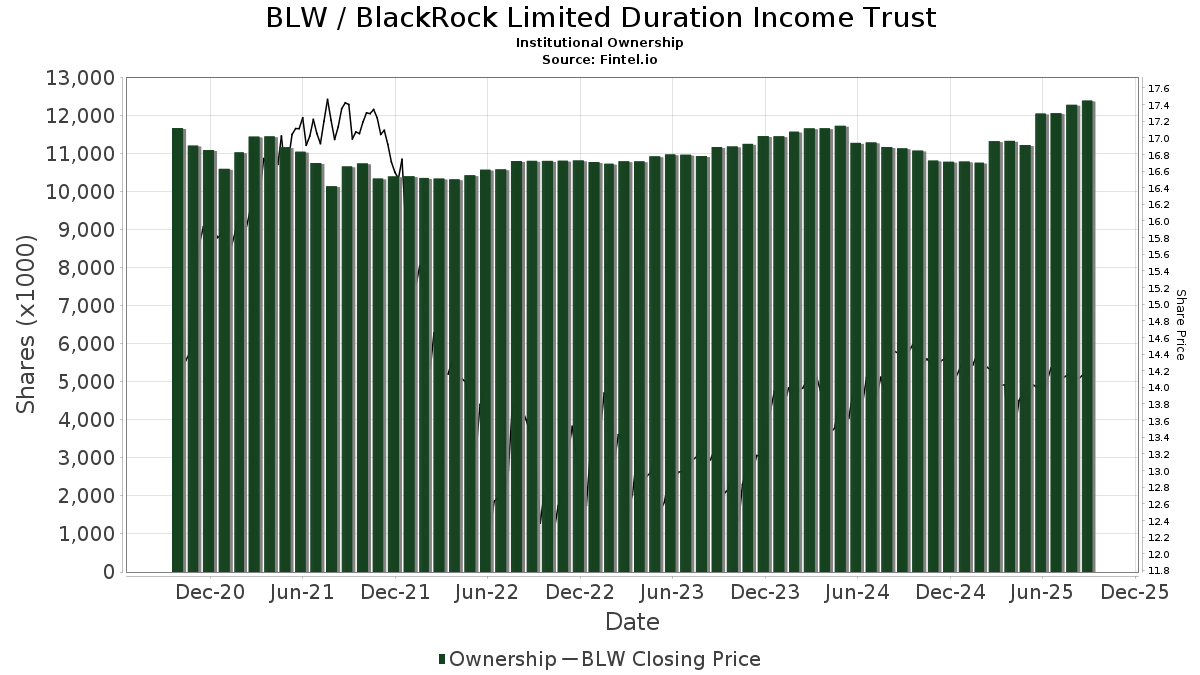
BlackRock Limited Duration Income Trust (US:BLW) memiliki 83 pemilik institusional dan pemegang saham yang telah mengajukan formulir 13D/G atau 13F kepada Komisi Bursa Efek (Securities Exchange Commission/SEC). Lembaga-lembaga ini memegang total 12,388,498 saham. Pemegang saham terbesar meliputi Morgan Stanley, Wells Fargo & Company/mn, Guggenheim Capital Llc, UBS Group AG, Venture Visionary Partners LLC, Cohen & Steers, Inc., Invesco Ltd., PCEF - Invesco CEF Income Composite ETF, Blue Zone Wealth Advisors, LLC, and Bank Of America Corp /de/ .
Struktur kepemilikan institusional BlackRock Limited Duration Income Trust (NYSE:BLW) menunjukkan posisi terkini di perusahaan oleh institusi dan dana, serta perubahan terbaru dalam ukuran posisi. Pemegang saham utama dapat mencakup investor individu, reksa dana, dana lindung nilai, atau institusi. Jadwal 13D menunjukkan bahwa investor memegang (atau pernah memegang) lebih dari 5% saham perusahaan dan bermaksud (atau pernah bermaksud) untuk secara aktif mengejar perubahan strategi bisnis. Jadwal 13G menunjukkan investasi pasif lebih dari 5%.
The share price as of September 5, 2025 is 14.15 / share. Previously, on September 9, 2024, the share price was 14.53 / share. This represents a decline of 2.62% over that period.
Skor Sentimen Dana
Skor Sentimen Dana (sebelumnya dikenal sebagai Skor Akumulasi Kepemilikan) menemukan saham-saham yang paling banyak dibeli oleh dana. Ini adalah hasil dari model kuantitatif multi-faktor yang canggih yang mengidentifikasi perusahaan dengan tingkat akumulasi institusional tertinggi. Model penilaian menggunakan kombinasi dari total peningkatan pemilik yang diungkapkan, perubahan dalam alokasi portofolio pada pemilik tersebut, dan metrik lainnya. Angka berkisar dari 0 hingga 100, dengan angka yang lebih tinggi menunjukkan tingkat akumulasi yang lebih tinggi dibandingkan dengan perusahaan sejenisnya, dan 50 adalah rata-ratanya.
Frekuensi Pembaruan: Setiap Hari
Lihat Ownership Explorer, yang menyediakan daftar perusahaan dengan peringkat tertinggi.
Rasio Put/Call Institusional
Selain melaporkan isu ekuitas dan utang standar, institusi dengan aset di bawah manajemen lebih dari 100 juta dolar AS juga harus mengungkapkan kepemilikan opsi put dan call mereka. Karena opsi put umumnya menunjukkan sentimen negatif, dan opsi call menunjukkan sentimen positif, kita dapat mengetahui sentimen institusional secara keseluruhan dengan memplot rasio put terhadap call. Grafik di sebelah kanan memplot rasio put/call historis untuk instrumen ini.
Menggunakan Rasio Put/Call sebagai indikator sentimen investor mengatasi salah satu kekurangan utama dari penggunaan total kepemilikan institusional, yaitu sejumlah besar aset yang dikelola diinvestasikan secara pasif untuk melacak indeks. Dana yang dikelola secara pasif biasanya tidak membeli opsi, sehingga indikator rasio put/call lebih akurat dalam melacak sentimen dana yang dikelola secara aktif.
Pengajuan 13F dan NPORT
Detail pada pengajuan 13F tersedia gratis. Detail pada pengajuan NP memerlukan keanggotaan premium. Baris berwarna hijau menunjukkan posisi baru. Baris berwarna merah menunjukkan posisi yang sudah ditutup. Klik tautan ini ikon untuk melihat riwayat transaksi selengkapnya.
Tingkatkan
untuk membuka data premium dan mengekspor ke Excel ![]() .
.
| Tanggal File | Sumber | Investor | Ketik | Presyo ng Avg (Silangan) |
Saham | Δ Saham (%) |
Dilaporkan Nilai ($1000) |
Nilai Δ (%) |
Alokasi Port (%) |
|
|---|---|---|---|---|---|---|---|---|---|---|
| 2025-07-31 | 13F | Jackson Hole Capital Partners, LLC | 15,624 | 222 | ||||||
| 2025-08-14 | 13F | Raymond James Financial Inc | 242,705 | 0.27 | 3,442 | 0.56 | ||||
| 2025-08-01 | 13F | Envestnet Asset Management Inc | 145,410 | 3.52 | 2,062 | 3.78 | ||||
| 2025-08-07 | 13F | Montag A & Associates Inc | 1,410 | 0.00 | 20 | 0.00 | ||||
| 2025-08-14 | 13F | BTG Pactual Asset Management US LLC | 37,630 | 0.00 | 534 | 0.19 | ||||
| 2025-08-19 | 13F | Newbridge Financial Services Group, Inc. | 2,979 | 42 | ||||||
| 2025-07-10 | 13F | Oliver Lagore Vanvalin Investment Group | 3,300 | 0.00 | 47 | 0.00 | ||||
| 2025-07-30 | NP | HYIN - WisdomTree Alternative Income Fund N/A | 127,977 | 285.67 | 1,789 | 284.73 | ||||
| 2025-07-17 | 13F/A | Capital Investment Advisors, LLC | 154,069 | -3.57 | 2,185 | -3.32 | ||||
| 2025-07-15 | 13F | Missouri Trust & Investment Co | 1,244 | 3.32 | 18 | 0.00 | ||||
| 2025-08-07 | 13F | Fountainhead AM, LLC | 69,536 | 1.18 | 986 | 1.54 | ||||
| 2025-07-18 | 13F | Consolidated Portfolio Review Corp | 21,590 | -22.81 | 306 | -22.53 | ||||
| 2025-08-08 | 13F | Capital Investment Advisory Services, LLC | 11,138 | 158 | ||||||
| 2025-08-14 | 13F | Comerica Bank | 51,909 | 9.61 | 736 | 10.01 | ||||
| 2025-04-01 | NP | CVY - Invesco Zacks Multi-Asset Income ETF This fund is a listed as child fund of Invesco Ltd. and if that institution has disclosed ownership in this security, then these positions will not be double counted when calculating total shares and total value | 24,513 | 5.97 | 352 | -11.81 | ||||
| 2025-08-14 | 13F | Papamarkou Wellner Asset Management inc. | 10,000 | 0.00 | 142 | 1.44 | ||||
| 2025-07-22 | 13F | Fortitude Advisory Group L.L.C. | 14,853 | 0.00 | 211 | 6.06 | ||||
| 2025-08-13 | 13F | Beacon Pointe Advisors, LLC | 21,195 | -0.77 | 301 | -0.66 | ||||
| 2025-08-05 | 13F | Pointe Capital Management LLC | 26,565 | 0.00 | 377 | 0.27 | ||||
| 2025-08-06 | 13F | Round Rock Advisors, LLC | 35,345 | 4.47 | 501 | 4.81 | ||||
| 2025-07-28 | 13F | Harbour Investments, Inc. | 190 | 0.00 | 3 | 0.00 | ||||
| 2025-08-07 | 13F | Samalin Investment Counsel, LLC | 0 | -100.00 | 0 | |||||
| 2025-07-25 | 13F | Concurrent Investment Advisors, LLC | 17,942 | 15.18 | 254 | 15.45 | ||||
| 2025-08-14 | 13F | Ameriprise Financial Inc | 13,677 | -27.28 | 194 | -27.17 | ||||
| 2025-07-18 | 13F | Bartlett & Co. Wealth Management Llc | 1,900 | 0.00 | 27 | 0.00 | ||||
| 2025-08-14 | 13F | Royal Bank Of Canada | 158,862 | -2.98 | 2,252 | -2.72 | ||||
| 2025-07-11 | 13F | Annex Advisory Services, LLC | 15,407 | 0.00 | 218 | 0.46 | ||||
| 2025-08-12 | 13F | LPL Financial LLC | 166,907 | 7.97 | 2,367 | 8.28 | ||||
| 2025-09-04 | 13F/A | Advisor Group Holdings, Inc. | 114,125 | 3.62 | 1,618 | 3.92 | ||||
| 2025-07-17 | 13F | Janney Montgomery Scott LLC | 26,199 | -2.01 | 0 | |||||
| 2025-07-08 | 13F | Nbc Securities, Inc. | 68,759 | 11.72 | 1 | |||||
| 2025-08-12 | 13F | MAI Capital Management | 15,475 | 0.68 | 219 | 0.92 | ||||
| 2025-08-08 | 13F | Fiera Capital Corp | 112,432 | -1.88 | 1,594 | -1.60 | ||||
| 2025-08-14 | 13F | UBS Group AG | 596,345 | -1.82 | 8,456 | -1.54 | ||||
| 2025-06-27 | NP | Calamos ETF Trust - Calamos CEF Income & Arbitrage ETF | 16,631 | 230 | ||||||
| 2025-08-05 | 13F | Verity Asset Management, Inc. | 54,438 | -0.44 | 772 | -0.26 | ||||
| 2025-08-14 | 13F | Wells Fargo & Company/mn | 1,005,137 | 1.62 | 14,253 | 1.91 | ||||
| 2025-08-14 | 13F | GWM Advisors LLC | 45,760 | -1.51 | 649 | -1.22 | ||||
| 2025-08-05 | 13F | Peregrine Asset Advisers, Inc. | 58,983 | 0.02 | 836 | 0.36 | ||||
| 2025-08-04 | 13F | Waterfront Wealth Inc. | 26,786 | -13.28 | 380 | -13.07 | ||||
| 2025-08-15 | 13F | Morgan Stanley | 4,565,087 | 1.25 | 64,733 | 1.53 | ||||
| 2025-07-24 | 13F | IFP Advisors, Inc | 2,439 | 2.09 | 35 | 3.03 | ||||
| 2025-06-25 | NP | VPC - Virtus Private Credit Strategy ETF | 59,263 | 4.35 | 820 | 0.61 | ||||
| 2025-07-16 | 13F | Moisand Fitzgerald Tamayo, LLC | 500 | 0.00 | 7 | 0.00 | ||||
| 2025-08-08 | 13F | Wealth Alliance | 55,701 | 1.99 | 790 | 2.20 | ||||
| 2025-05-14 | 13F | Virtus ETF Advisers LLC | 0 | -100.00 | 0 | |||||
| 2025-07-21 | 13F | Crews Bank & Trust | 1,350 | 0.00 | 19 | 0.00 | ||||
| 2025-07-25 | 13F | Atria Wealth Solutions, Inc. | 0 | -100.00 | 0 | |||||
| 2025-07-30 | 13F | Cullen/frost Bankers, Inc. | 0 | -100.00 | 0 | |||||
| 2025-08-08 | 13F | Cetera Investment Advisers | 67,743 | 13.33 | 961 | 13.61 | ||||
| 2025-08-08 | 13F | Pnc Financial Services Group, Inc. | 2,860 | 2.44 | 41 | 2.56 | ||||
| 2025-08-11 | 13F | Principal Securities, Inc. | 172,147 | -19.15 | 2,441 | -18.85 | ||||
| 2025-08-12 | 13F | Jefferies Financial Group Inc. | 145,210 | -0.59 | 2,059 | -0.29 | ||||
| 2025-08-18 | 13F | Geneos Wealth Management Inc. | 991 | 0.00 | 14 | 0.00 | ||||
| 2025-05-19 | 13F | Smith Asset Management Co., LLC | 53,006 | 0.64 | 750 | 0.67 | ||||
| 2025-08-15 | 13F | Kestra Advisory Services, LLC | 27,317 | 130.68 | 387 | 131.74 | ||||
| 2025-07-24 | 13F | Us Bancorp \de\ | 19,900 | 0.00 | 282 | 0.36 | ||||
| 2025-07-24 | 13F | Blue Zone Wealth Advisors, LLC | 309,458 | 2.60 | 4,388 | 2.91 | ||||
| 2025-08-14 | 13F | Mml Investors Services, Llc | 15,852 | 1.40 | 0 | |||||
| 2025-04-16 | 13F | Fortitude Family Office, LLC | 0 | -100.00 | 0 | |||||
| 2025-08-11 | 13F | Elequin Capital Lp | 0 | -100.00 | 0 | |||||
| 2025-07-28 | NP | PCEF - Invesco CEF Income Composite ETF This fund is a listed as child fund of Invesco Ltd. and if that institution has disclosed ownership in this security, then these positions will not be double counted when calculating total shares and total value | 316,086 | 3.54 | 4,419 | 1.63 | ||||
| 2025-07-30 | 13F | Bogart Wealth, LLC | 1,618 | 0.00 | 23 | 0.00 | ||||
| 2025-08-06 | 13F | Prospera Financial Services Inc | 14,764 | -2.35 | 209 | -1.88 | ||||
| 2025-08-13 | 13F | Virtus Investment Advisers, Inc. | 48,452 | -25.32 | 687 | -25.08 | ||||
| 2025-08-13 | 13F | Baird Financial Group, Inc. | 130,779 | 2.01 | 1,854 | 2.32 | ||||
| 2025-07-24 | 13F | Ronald Blue Trust, Inc. | 1,309 | 0.00 | 19 | 0.00 | ||||
| 2025-08-29 | NP | GraniteShares ETF Trust - GraniteShares HIPS US High Income ETF | 198,414 | 6.66 | 2,814 | 6.96 | ||||
| 2025-08-14 | 13F | Cura Wealth Advisors, Llc | 95,238 | 0.00 | 1,350 | 0.30 | ||||
| 2025-08-14 | 13F | CoreCap Advisors, LLC | 2,351 | -29.31 | 33 | -29.79 | ||||
| 2025-08-11 | 13F | Shufro Rose & Co Llc | 25,900 | 0.00 | 366 | 0.00 | ||||
| 2025-08-06 | 13F | Commonwealth Equity Services, Llc | 38,935 | 7.77 | 1 | |||||
| 2025-08-07 | 13F | Allworth Financial LP | 1,306 | 1.08 | 19 | 5.88 | ||||
| 2025-08-12 | 13F | Proequities, Inc. | 0 | 0 | ||||||
| 2025-08-14 | 13F | Stifel Financial Corp | 12,459 | 0.00 | 177 | 0.00 | ||||
| 2025-05-08 | 13F | Plante Moran Financial Advisors, LLC | 0 | -100.00 | 0 | |||||
| 2025-07-17 | 13F | Venture Visionary Partners LLC | 539,864 | 15.00 | 7,655 | 15.34 | ||||
| 2025-08-13 | 13F | Orleans Capital Management Corp/la | 40,500 | 0.00 | 574 | 0.35 | ||||
| 2025-07-17 | 13F | GraniteShares Advisors LLC | 198,414 | 6.66 | 2,814 | 6.96 | ||||
| 2025-08-13 | 13F | Guggenheim Capital Llc | 825,295 | 8.47 | 11,703 | 8.77 | ||||
| 2025-08-14 | 13F | Bank Of America Corp /de/ | 279,343 | 6.02 | 3,961 | 6.34 | ||||
| 2025-07-15 | 13F | North Star Investment Management Corp. | 500 | 0.00 | 7 | 0.00 | ||||
| 2025-08-18 | 13F | Hollencrest Capital Management | 3,500 | 0.00 | 50 | 0.00 | ||||
| 2025-07-14 | 13F | Hoey Investments, Inc | 171 | 0.00 | 2 | 0.00 | ||||
| 2025-08-06 | 13F | Ethos Financial Group, LLC | 137,197 | -13.27 | 1,945 | -13.01 | ||||
| 2025-08-14 | 13F | Cohen & Steers, Inc. | 371,801 | 0.00 | 5 | 0.00 | ||||
| 2025-07-31 | 13F | Cambridge Investment Research Advisors, Inc. | 44,338 | -1.04 | 1 | |||||
| 2025-07-24 | 13F | WMG Financial Advisors, LLC | 10,575 | 0.00 | 150 | 0.00 | ||||
| 2025-08-12 | 13F | Pathstone Holdings, LLC | 14,175 | 2.47 | 201 | 3.08 | ||||
| 2025-08-13 | 13F | Invesco Ltd. | 328,224 | -0.46 | 4,654 | -0.17 | ||||
| 2025-08-08 | 13F | ProVise Management Group, LLC | 13,818 | 0.00 | 196 | 0.00 |