Mga Batayang Estadistika
| Pemilik Institusional | 147 total, 147 long only, 0 short only, 0 long/short - change of 8.82% MRQ |
| Alokasi Portofolio Rata-rata | 0.3862 % - change of 2.75% MRQ |
| Saham Institusional (Jangka Panjang) | 35,508,789 (ex 13D/G) - change of 7.65MM shares 27.45% MRQ |
| Nilai Institusional (Jangka Panjang) | $ 840,362 USD ($1000) |
Kepemilikan Institusional dan Pemegang Saham
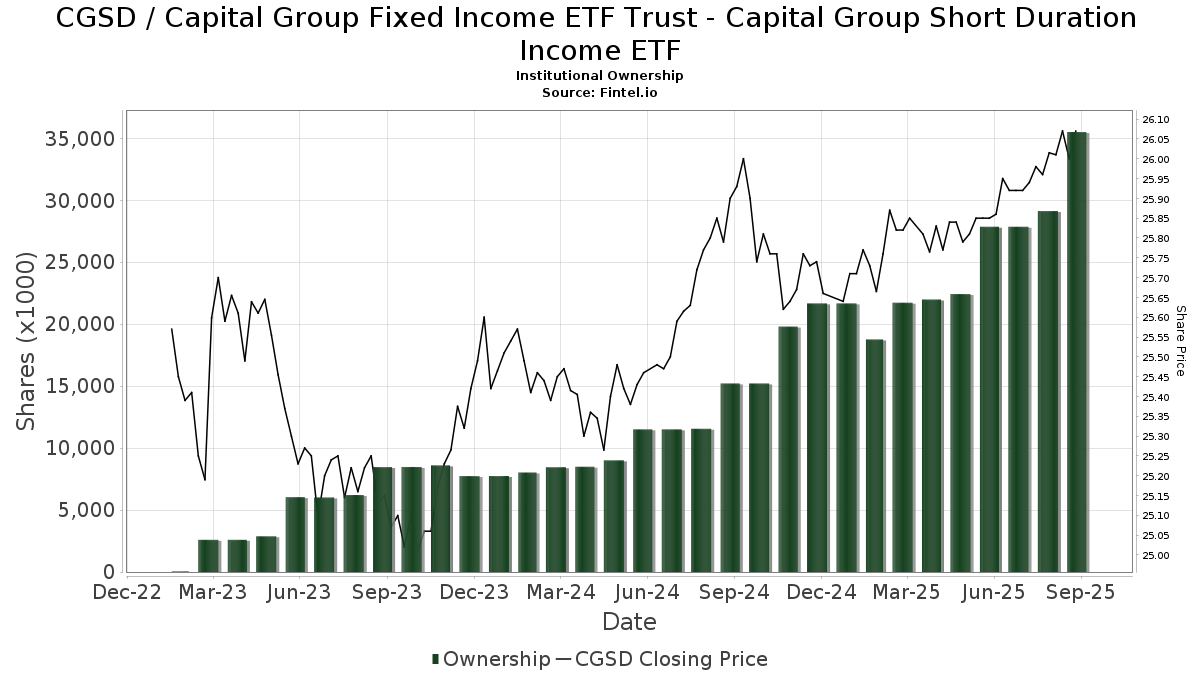
Capital Group Fixed Income ETF Trust - Capital Group Short Duration Income ETF (US:CGSD) memiliki 147 pemilik institusional dan pemegang saham yang telah mengajukan formulir 13D/G atau 13F kepada Komisi Bursa Efek (Securities Exchange Commission/SEC). Lembaga-lembaga ini memegang total 35,508,789 saham. Pemegang saham terbesar meliputi Morgan Stanley, LPL Financial LLC, Capital Group Private Client Services, Inc., Commonwealth Equity Services, Llc, Cetera Investment Advisers, McIlrath & Eck, LLC, Advisor Group Holdings, Inc., Envestnet Asset Management Inc, WNY Asset Management, LLC, and Raymond James Financial Inc .
Struktur kepemilikan institusional Capital Group Fixed Income ETF Trust - Capital Group Short Duration Income ETF (ARCA:CGSD) menunjukkan posisi terkini di perusahaan oleh institusi dan dana, serta perubahan terbaru dalam ukuran posisi. Pemegang saham utama dapat mencakup investor individu, reksa dana, dana lindung nilai, atau institusi. Jadwal 13D menunjukkan bahwa investor memegang (atau pernah memegang) lebih dari 5% saham perusahaan dan bermaksud (atau pernah bermaksud) untuk secara aktif mengejar perubahan strategi bisnis. Jadwal 13G menunjukkan investasi pasif lebih dari 5%.
The share price as of September 5, 2025 is 26.05 / share. Previously, on September 9, 2024, the share price was 25.88 / share. This represents an increase of 0.64% over that period.
Skor Sentimen Dana
Skor Sentimen Dana (sebelumnya dikenal sebagai Skor Akumulasi Kepemilikan) menemukan saham-saham yang paling banyak dibeli oleh dana. Ini adalah hasil dari model kuantitatif multi-faktor yang canggih yang mengidentifikasi perusahaan dengan tingkat akumulasi institusional tertinggi. Model penilaian menggunakan kombinasi dari total peningkatan pemilik yang diungkapkan, perubahan dalam alokasi portofolio pada pemilik tersebut, dan metrik lainnya. Angka berkisar dari 0 hingga 100, dengan angka yang lebih tinggi menunjukkan tingkat akumulasi yang lebih tinggi dibandingkan dengan perusahaan sejenisnya, dan 50 adalah rata-ratanya.
Frekuensi Pembaruan: Setiap Hari
Lihat Ownership Explorer, yang menyediakan daftar perusahaan dengan peringkat tertinggi.
Rasio Put/Call Institusional
Selain melaporkan isu ekuitas dan utang standar, institusi dengan aset di bawah manajemen lebih dari 100 juta dolar AS juga harus mengungkapkan kepemilikan opsi put dan call mereka. Karena opsi put umumnya menunjukkan sentimen negatif, dan opsi call menunjukkan sentimen positif, kita dapat mengetahui sentimen institusional secara keseluruhan dengan memplot rasio put terhadap call. Grafik di sebelah kanan memplot rasio put/call historis untuk instrumen ini.
Menggunakan Rasio Put/Call sebagai indikator sentimen investor mengatasi salah satu kekurangan utama dari penggunaan total kepemilikan institusional, yaitu sejumlah besar aset yang dikelola diinvestasikan secara pasif untuk melacak indeks. Dana yang dikelola secara pasif biasanya tidak membeli opsi, sehingga indikator rasio put/call lebih akurat dalam melacak sentimen dana yang dikelola secara aktif.
Pengajuan 13F dan NPORT
Detail pada pengajuan 13F tersedia gratis. Detail pada pengajuan NP memerlukan keanggotaan premium. Baris berwarna hijau menunjukkan posisi baru. Baris berwarna merah menunjukkan posisi yang sudah ditutup. Klik tautan ini ikon untuk melihat riwayat transaksi selengkapnya.
Tingkatkan
untuk membuka data premium dan mengekspor ke Excel ![]() .
.
| Tanggal File | Sumber | Investor | Ketik | Presyo ng Avg (Silangan) |
Saham | Δ Saham (%) |
Dilaporkan Nilai ($1000) |
Nilai Δ (%) |
Alokasi Port (%) |
|
|---|---|---|---|---|---|---|---|---|---|---|
| 2025-07-30 | 13F | Cullen/frost Bankers, Inc. | 4,056 | 51.34 | 105 | 52.17 | ||||
| 2025-07-23 | 13F | Tcfg Wealth Management, Llc | 36,977 | 21.85 | 959 | 22.48 | ||||
| 2025-04-10 | 13F | TrueWealth Advisors, LLC | 0 | -100.00 | 0 | |||||
| 2025-09-04 | 13F/A | Advisor Group Holdings, Inc. | 1,106,573 | 20.07 | 28,695 | 20.64 | ||||
| 2025-07-11 | 13F | Petredis Investment Advisors Llc | 118,482 | 3,073 | ||||||
| 2025-07-15 | 13F | Garrett Investment Advisors LLC | 12,985 | -3.74 | 337 | -3.45 | ||||
| 2025-08-12 | 13F | SRS Capital Advisors, Inc. | 70 | 2 | ||||||
| 2025-08-13 | 13F | RFP Financial Group LLC | 25,544 | -11.76 | 662 | -11.38 | ||||
| 2025-07-16 | 13F | Signature Resources Capital Management, LLC | 2,284 | 197.40 | 59 | 210.53 | ||||
| 2025-08-04 | 13F | Arkadios Wealth Advisors | 8,238 | 214 | ||||||
| 2025-08-11 | 13F | Private Advisor Group, LLC | 317,271 | -6.49 | 8,228 | -6.03 | ||||
| 2025-08-14 | 13F | UBS Group AG | 881,595 | -0.50 | 22,864 | -0.01 | ||||
| 2025-07-24 | 13F | Stonebridge Financial Group, LLC | 40,202 | 61.96 | 1,043 | 62.81 | ||||
| 2025-07-25 | 13F | Envestnet Portfolio Solutions, Inc. | 12,910 | 335 | ||||||
| 2025-08-15 | 13F | Kestra Advisory Services, LLC | 171,688 | 3.96 | 4,453 | 4.46 | ||||
| 2025-08-11 | 13F | Principal Securities, Inc. | 8,300 | 0.00 | 215 | 1.42 | ||||
| 2025-08-12 | 13F | Lodestone Wealth Management LLC | 168,654 | -2.55 | 4,374 | -2.06 | ||||
| 2025-08-12 | 13F | Jpmorgan Chase & Co | 0 | 0 | ||||||
| 2025-08-14 | 13F | Susquehanna International Group, Llp | 0 | -100.00 | 0 | |||||
| 2025-08-13 | 13F | Townsquare Capital Llc | 0 | -100.00 | 0 | |||||
| 2025-08-14 | 13F | Citadel Advisors Llc | 207,589 | 30.45 | 5,384 | 31.07 | ||||
| 2025-07-22 | 13F | Merit Financial Group, LLC | 20,427 | 530 | ||||||
| 2025-08-11 | 13F | Inspire Advisors, LLC | 97,244 | 0.74 | 2,522 | 1.24 | ||||
| 2025-07-10 | 13F | Financial Management Network Inc | 147,558 | 10.21 | 3,817 | 10.51 | ||||
| 2025-07-28 | 13F | Sagespring Wealth Partners, Llc | 8,051 | 209 | ||||||
| 2025-04-11 | 13F | Fjell Capital, LLC | 0 | -100.00 | 0 | |||||
| 2025-04-30 | 13F | J Hagan Capital, Inc. | 176,837 | 4,534 | ||||||
| 2025-08-11 | 13F | Perennial Investment Advisors, LLC | 28,570 | 12.97 | 741 | 13.50 | ||||
| 2025-07-11 | 13F | LongView Wealth Management | 26,157 | -52.56 | 678 | -52.35 | ||||
| 2025-07-29 | 13F | International Assets Investment Management, Llc | 126,072 | -0.27 | 3,270 | 0.21 | ||||
| 2025-08-14 | 13F | GWM Advisors LLC | 263,378 | 52.81 | 6,831 | 53.55 | ||||
| 2025-07-16 | 13F | ORG Partners LLC | 581 | 15 | ||||||
| 2025-07-17 | 13F | Johnson Bixby & Associates, LLC | 7,779 | 0.00 | 202 | 0.50 | ||||
| 2025-07-29 | 13F | Burford Brothers, Inc. | 27,731 | -6.02 | 719 | -5.52 | ||||
| 2025-08-12 | 13F | NWF Advisory Services Inc. | 182,365 | 4,707 | ||||||
| 2025-07-22 | 13F | DAVENPORT & Co LLC | 24,066 | 1.35 | 624 | 1.96 | ||||
| 2025-04-21 | 13F | Beacon Capital Management, LLC | 0 | -100.00 | 0 | |||||
| 2025-07-15 | 13F | Hartmann Taylor Wealth Management, LLC | 11,125 | 11.25 | 289 | 11.63 | ||||
| 2025-08-06 | 13F | Cannon Financial Strategists, Inc. | 28,998 | 752 | ||||||
| 2025-08-14 | 13F | Clg Llc | 65,908 | 3.69 | 1,709 | 4.21 | ||||
| 2025-07-25 | 13F | We Are One Seven, LLC | 13,950 | -4.12 | 362 | -3.73 | ||||
| 2025-08-14 | 13F | Royal Bank Of Canada | 798,718 | 68.64 | 20,715 | 69.46 | ||||
| 2025-07-25 | 13F | Atria Wealth Solutions, Inc. | 123,450 | -3.59 | 3,194 | -3.36 | ||||
| 2025-07-09 | 13F | Dynamic Advisor Solutions LLC | 56,324 | 38.90 | 1,461 | 39.58 | ||||
| 2025-08-14 | 13F | Wiley Bros.-aintree Capital, Llc | 76,778 | 2,007 | ||||||
| 2025-08-04 | 13F | Bay Colony Advisory Group, Inc d/b/a Bay Colony Advisors | 25,153 | -23.83 | 652 | -23.47 | ||||
| 2025-08-15 | 13F | Captrust Financial Advisors | 877,337 | 18.77 | 22,754 | 19.34 | ||||
| 2025-07-24 | 13F | Cyndeo Wealth Partners, LLC | 33,023 | 2.10 | 856 | 2.64 | ||||
| 2025-05-14 | 13F | Flow Traders U.s. Llc | 0 | -100.00 | 0 | |||||
| 2025-08-07 | 13F | Kestra Private Wealth Services, Llc | 344,503 | 12.99 | 8,935 | 13.53 | ||||
| 2025-07-31 | 13F | Moloney Securities Asset Management, LLC | 0 | -100.00 | 0 | |||||
| 2025-08-04 | 13F | WNY Asset Management, LLC | 960,267 | 6.47 | 24,905 | 6.99 | ||||
| 2025-08-11 | 13F | Aptus Capital Advisors, LLC | 28,650 | 0.00 | 743 | 0.54 | ||||
| 2025-08-14 | 13F | Great Valley Advisor Group, Inc. | 328,320 | 11.42 | 8,515 | 11.97 | ||||
| 2025-08-27 | 13F/A | Brinker Capital Investments, LLC | 16,010 | 415 | ||||||
| 2025-08-13 | 13F | Gateway Wealth Partners, LLC | 0 | -100.00 | 0 | |||||
| 2025-08-18 | 13F/A | Kestra Investment Management, LLC | 202,348 | 1,313.64 | 5,248 | 1,321.95 | ||||
| 2025-07-22 | 13F | Beacon Financial Advisory LLC | 10,526 | 273 | ||||||
| 2025-08-14 | 13F | Guardian Wealth Advisors, Llc / Nc | 28,650 | 0.00 | 743 | 0.54 | ||||
| 2025-08-11 | 13F | Beta Wealth Group, Inc. | 493,239 | -1.07 | 12,792 | -0.58 | ||||
| 2025-07-30 | 13F | Bleakley Financial Group, LLC | 38,232 | -15.70 | 992 | -15.30 | ||||
| 2025-08-12 | 13F | Deutsche Bank Ag\ | 956 | 25 | ||||||
| 2025-08-14 | 13F | Mpwm Advisory Solutions, Llc | 6,642 | -47.47 | 172 | -47.24 | ||||
| 2025-08-04 | 13F | Bridgewealth Advisory Group, LLC | 787,980 | 745.30 | 20,436 | 749.73 | ||||
| 2025-08-06 | 13F | Souders Financial Advisors | 398,518 | 9.15 | 10,336 | 9.68 | ||||
| 2025-08-11 | 13F | Western Wealth Management, LLC | 44,348 | 1.66 | 1,150 | 2.22 | ||||
| 2025-08-13 | 13F | Baird Financial Group, Inc. | 37,110 | 0.00 | 962 | 0.52 | ||||
| 2025-07-28 | 13F | RFG Advisory, LLC | 26,973 | 6.57 | 700 | 7.04 | ||||
| 2025-05-09 | 13F | Delta Financial Group, Inc. | 11,671 | 4.72 | 0 | |||||
| 2025-07-08 | 13F | IAM Advisory, LLC | 523,928 | 13,588 | ||||||
| 2025-08-13 | 13F | Strategic Family Wealth Counselors, L.L.C. | 17,623 | 0.00 | 457 | 0.66 | ||||
| 2025-08-12 | 13F | Titleist Asset Management, Llc | 10,449 | 3.51 | 271 | 4.23 | ||||
| 2025-08-12 | 13F | Steward Partners Investment Advisory, Llc | 6,345 | -15.54 | 165 | -15.03 | ||||
| 2025-08-04 | 13F | Saxony Capital Management, LLC | 93,898 | 1.75 | 2,435 | 2.27 | ||||
| 2025-08-14 | 13F | Benjamin Edwards Inc | 145,255 | -7.51 | 3,767 | -7.06 | ||||
| 2025-07-28 | 13F | Harbour Investments, Inc. | 43,913 | 22.12 | 1,139 | 22.63 | ||||
| 2025-08-12 | 13F | Rather & Kittrell, Inc. | 7,781 | 0.00 | 202 | 0.50 | ||||
| 2025-08-12 | 13F | Global Retirement Partners, LLC | 29,810 | 6,675.00 | 773 | 6,927.27 | ||||
| 2025-07-24 | 13F | IFP Advisors, Inc | 879 | 1.15 | 23 | 0.00 | ||||
| 2025-07-29 | 13F | DeDora Capital, Inc. | 78,163 | 16.29 | 2,027 | 16.90 | ||||
| 2025-08-13 | 13F | StoneX Group Inc. | 143,466 | 0.86 | 3,721 | 1.33 | ||||
| 2025-08-14 | 13F | Raymond James Financial Inc | 939,933 | 44.98 | 24,377 | 45.68 | ||||
| 2025-08-11 | 13F | Nations Financial Group Inc, /ia/ /adv | 13,194 | 26.37 | 342 | 27.14 | ||||
| 2025-08-04 | 13F | Pensionmark Financial Group, Llc | 21,191 | 166.08 | 550 | 167.80 | ||||
| 2025-08-12 | 13F | Founders Financial Alliance, LLC | 44,934 | 115.00 | 1,165 | 116.14 | ||||
| 2025-07-14 | 13F | AdvisorNet Financial, Inc | 780 | 0.00 | 20 | 0.00 | ||||
| 2025-07-15 | 13F | Norden Group Llc | 558,923 | -5.45 | 14,496 | -4.99 | ||||
| 2025-08-13 | 13F | Capital International Investors | 91,002 | -1.08 | 2,360 | -0.59 | ||||
| 2025-08-14 | 13F | Jane Street Group, Llc | 41,133 | -68.07 | 1,067 | -67.93 | ||||
| 2025-07-24 | 13F | MSH Capital Advisors LLC | 19,134 | 144.15 | 496 | 145.54 | ||||
| 2025-07-10 | 13F | Exchange Traded Concepts, Llc | 1,905 | 49 | ||||||
| 2025-08-13 | 13F | Congress Wealth Management LLC / DE / | 25,376 | 8.71 | 658 | 9.30 | ||||
| 2025-08-14 | 13F | Bank Of America Corp /de/ | 1,905 | 49 | ||||||
| 2025-08-07 | 13F | Allworth Financial LP | 9,736 | -1.88 | 253 | -1.56 | ||||
| 2025-08-14 | 13F | Comerica Bank | 7,663 | 15.01 | 199 | 15.79 | ||||
| 2025-07-10 | 13F | Wealth Enhancement Advisory Services, Llc | 640,707 | 37.23 | 16,575 | 37.55 | ||||
| 2025-08-01 | 13F | Ashton Thomas Private Wealth, LLC | 9,752 | 0.00 | 253 | 0.40 | ||||
| 2025-08-12 | 13F | Wood Tarver Financial Group, LLC | 170,110 | 58.80 | 4 | -99.86 | ||||
| 2025-08-18 | 13F | Geneos Wealth Management Inc. | 106,406 | -2.33 | 2,760 | -1.81 | ||||
| 2025-07-31 | 13F | Oppenheimer & Co Inc | 8,821 | -0.05 | 229 | 0.44 | ||||
| 2025-07-24 | 13F | Us Bancorp \de\ | 0 | -100.00 | 0 | |||||
| 2025-08-13 | 13F | EverSource Wealth Advisors, LLC | 117 | 20.62 | 3 | 50.00 | ||||
| 2025-07-23 | 13F | Valmark Advisers, Inc. | 66,413 | 14.98 | 1,722 | 15.57 | ||||
| 2025-08-14 | 13F | Smartleaf Asset Management LLC | 5,023 | -2.16 | 130 | -1.52 | ||||
| 2025-05-07 | 13F | Trilogy Capital Inc. | 0 | -100.00 | 0 | |||||
| 2025-08-13 | 13F | Continuum Advisory, LLC | 21,181 | -5.53 | 549 | -5.02 | ||||
| 2025-07-16 | 13F | Freestate Advisors LLC | 28,854 | 197.74 | 748 | 199.20 | ||||
| 2025-08-08 | 13F | Cetera Investment Advisers | 1,839,269 | 21.20 | 47,701 | 21.78 | ||||
| 2025-08-04 | 13F | Assetmark, Inc | 514 | 13 | ||||||
| 2025-07-08 | 13F | Nbc Securities, Inc. | 1,574 | 0.00 | 0 | |||||
| 2025-08-06 | 13F | Prospera Financial Services Inc | 16,141 | -1.93 | 419 | -1.42 | ||||
| 2025-08-05 | 13F | Bank of New York Mellon Corp | 8,243 | 214 | ||||||
| 2025-08-15 | 13F | Morgan Stanley | 4,345,569 | 72.41 | 112,702 | 73.24 | ||||
| 2025-08-14 | 13F | Mml Investors Services, Llc | 408,059 | 3.86 | 11 | 0.00 | ||||
| 2025-07-17 | 13F | Janney Montgomery Scott LLC | 22,826 | 14.45 | 1 | |||||
| 2025-08-06 | 13F | Commonwealth Equity Services, Llc | 2,099,696 | 15.11 | 54 | 14.89 | ||||
| 2025-08-14 | 13F | Sei Investments Co | 40,945 | 1,062 | ||||||
| 2025-07-10 | 13F | Sovran Advisors, LLC | 117,239 | 122.87 | 3,034 | 123.42 | ||||
| 2025-07-30 | 13F | Smith Thornton Advisors LLC | 51,540 | 0.00 | 1,337 | 0.45 | ||||
| 2025-07-31 | 13F | Richards, Merrill & Peterson, Inc. | 84,763 | 12.59 | 2,198 | 13.12 | ||||
| 2025-07-21 | 13F | Ameritas Advisory Services, LLC | 14,253 | -32.22 | 370 | -31.92 | ||||
| 2025-08-05 | 13F | Aurdan Capital Management, LLC | 18,370 | 2.35 | 476 | 2.81 | ||||
| 2025-07-14 | 13F | Sowell Financial Services LLC | 33,217 | 112.44 | 861 | 113.65 | ||||
| 2025-08-13 | 13F | BlackDiamond Wealth Management Inc. | 114,890 | -1.38 | 2,977 | -0.97 | ||||
| 2025-07-18 | 13F | Truist Financial Corp | 35,558 | -6.50 | 922 | -6.01 | ||||
| 2025-07-31 | 13F | Cambridge Investment Research Advisors, Inc. | 241,240 | 21.20 | 6 | 20.00 | ||||
| 2025-05-14 | 13F | Oarsman Capital, Inc. | 0 | -100.00 | 0 | -100.00 | ||||
| 2025-08-13 | 13F | Capital Group Private Client Services, Inc. | 2,244,927 | 3.38 | 58,222 | 3.88 | ||||
| 2025-08-14 | 13F | Ausdal Financial Partners, Inc. | 16,719 | 8.37 | 434 | 8.79 | ||||
| 2025-07-22 | 13F | Confluence Wealth Services, Inc. | 38,086 | 0.62 | 988 | 1.23 | ||||
| 2025-08-13 | 13F | Capital Analysts, Inc. | 8,256 | 7.58 | 0 | |||||
| 2025-08-13 | 13F | Jones Financial Companies Lllp | 738,301 | 76.98 | 19,129 | 77.60 | ||||
| 2025-08-14 | 13F | Wells Fargo & Company/mn | 800,831 | 62.85 | 20,770 | 63.64 | ||||
| 2025-08-12 | 13F | Entruity Wealth, LLC | 228,480 | 0.13 | 5,926 | 0.61 | ||||
| 2025-07-16 | 13F | St Germain D J Co Inc | 2,900 | 0.00 | 75 | 1.35 | ||||
| 2025-08-14 | 13F | Stifel Financial Corp | 230,493 | 14.07 | 5,978 | 14.61 | ||||
| 2025-08-04 | 13F | Creekmur Asset Management LLC | 209,717 | 5,439 | ||||||
| 2025-07-29 | 13F | Stratos Wealth Partners, LTD. | 23,223 | 602 | ||||||
| 2025-07-09 | 13F | Pines Wealth Management, LLC | 29,761 | 15.87 | 770 | 16.34 | ||||
| 2025-07-28 | 13F | Mutual Advisors, LLC | 30,733 | -4.61 | 798 | -4.32 | ||||
| 2025-07-29 | 13F | Private Trust Co Na | 2,738 | 173.80 | 71 | 184.00 | ||||
| 2025-07-21 | 13F | Ameriflex Group, Inc. | 0 | -100.00 | 0 | |||||
| 2025-08-12 | 13F | LPL Financial LLC | 3,955,676 | 40.10 | 102,590 | 40.78 | ||||
| 2025-08-08 | 13F | New England Capital Financial Advisors LLC | 259,718 | 6.89 | 6,736 | 7.40 | ||||
| 2025-05-12 | 13F | Independent Advisor Alliance | 0 | -100.00 | 0 | |||||
| 2025-08-11 | 13F | Synergy Investment Management, LLC | 0 | -100.00 | 0 | |||||
| 2025-08-08 | 13F | Avantax Advisory Services, Inc. | 48,050 | 7.56 | 1,246 | 8.16 | ||||
| 2025-08-14 | 13F | Integrated Wealth Concepts LLC | 8,310 | 3.51 | 216 | 3.86 | ||||
| 2025-07-30 | 13F | Brookstone Capital Management | 25,366 | 36.03 | 658 | 36.59 | ||||
| 2025-07-28 | 13F | Eq Wealth Advisors, Llc | 159,264 | 24.85 | 4,131 | 25.46 | ||||
| 2025-07-14 | 13F | U.S. Capital Wealth Advisors, LLC | 10,970 | 0.00 | 285 | 0.35 | ||||
| 2025-08-11 | 13F | Rothschild Investment Llc | 162,502 | 1.62 | 4,214 | 2.11 | ||||
| 2025-08-15 | 13F | Equitable Holdings, Inc. | 14,539 | 21.27 | 377 | 22.01 | ||||
| 2025-08-14 | 13F | Mariner, LLC | 87,476 | 55.67 | 2,269 | 56.41 | ||||
| 2025-07-22 | 13F | SOL Capital Management CO | 137,435 | -4.46 | 4 | 0.00 | ||||
| 2025-08-04 | 13F | Spire Wealth Management | 4,958 | 1.12 | 129 | 1.59 | ||||
| 2025-07-10 | 13F | Global Financial Private Client, LLC | 8,215 | 0.00 | 213 | 0.47 | ||||
| 2025-08-14 | 13F | CoreCap Advisors, LLC | 193 | 0.00 | 5 | 25.00 | ||||
| 2025-08-12 | 13F | Proequities, Inc. | 0 | 0 | ||||||
| 2025-08-14 | 13F | McIlrath & Eck, LLC | 1,168,716 | -2.97 | 30,311 | -2.50 | ||||
| 2025-08-13 | 13F | Northwestern Mutual Wealth Management Co | 251,030 | 4.15 | 6,510 | 4.65 | ||||
| 2025-08-08 | 13F | Capital Investment Advisory Services, LLC | 190 | 0.00 | 5 | 0.00 | ||||
| 2025-08-01 | 13F | Envestnet Asset Management Inc | 1,035,466 | 21.35 | 26,855 | 21.94 |