Mga Batayang Estadistika
| Pemilik Institusional | 95 total, 95 long only, 0 short only, 0 long/short - change of 2.15% MRQ |
| Alokasi Portofolio Rata-rata | 0.8763 % - change of -3.81% MRQ |
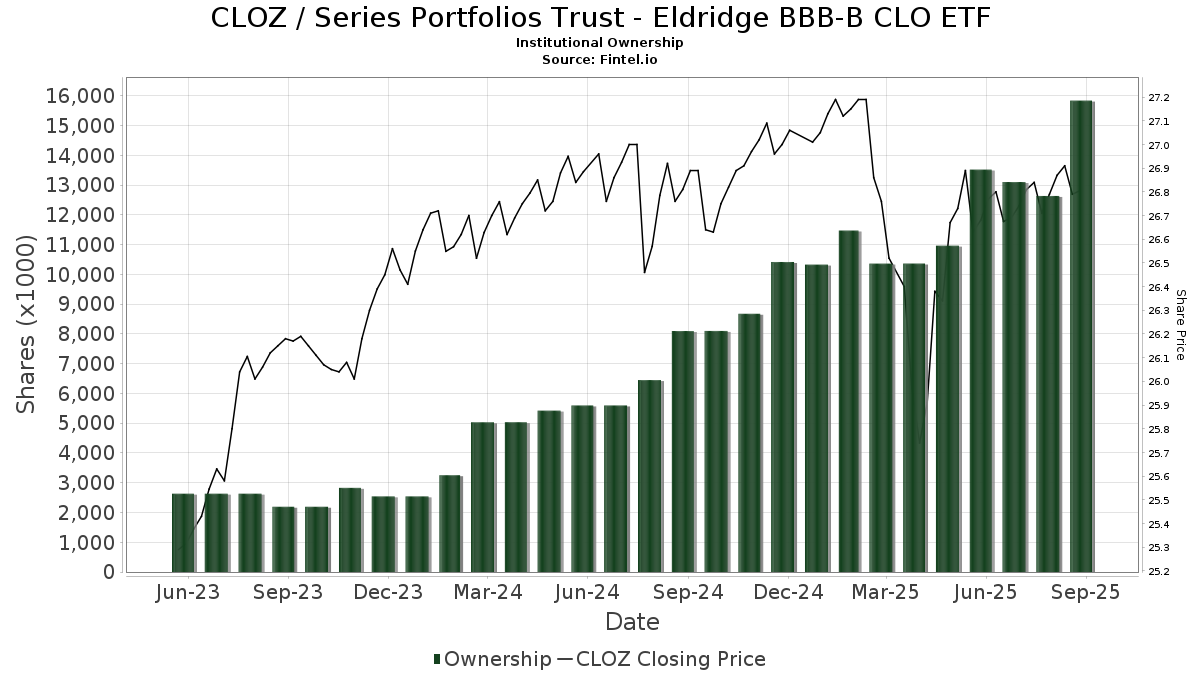
| Saham Institusional (Jangka Panjang) | 16,214,539 (ex 13D/G) - change of 2.69MM shares 19.90% MRQ |
| Nilai Institusional (Jangka Panjang) | $ 418,807 USD ($1000) |
Kepemilikan Institusional dan Pemegang Saham
Series Portfolios Trust - Eldridge BBB-B CLO ETF (US:CLOZ) memiliki 95 pemilik institusional dan pemegang saham yang telah mengajukan formulir 13D/G atau 13F kepada Komisi Bursa Efek (Securities Exchange Commission/SEC). Lembaga-lembaga ini memegang total 16,214,539 saham. Pemegang saham terbesar meliputi Security Benefit Life Insurance Co /ks/, Schechter Investment Advisors, LLC, SRS Capital Advisors, Inc., Goldman Sachs Group Inc, Kovitz Investment Group Partners, LLC, State of New Jersey Common Pension Fund D, Guardian Financial Partners, LLC, GFRAX - Goldman Sachs High Yield Floating Rate Fund Class A Shares, Gradient Investments LLC, and Black Swift Group, LLC .
Struktur kepemilikan institusional Series Portfolios Trust - Eldridge BBB-B CLO ETF (ARCA:CLOZ) menunjukkan posisi terkini di perusahaan oleh institusi dan dana, serta perubahan terbaru dalam ukuran posisi. Pemegang saham utama dapat mencakup investor individu, reksa dana, dana lindung nilai, atau institusi. Jadwal 13D menunjukkan bahwa investor memegang (atau pernah memegang) lebih dari 5% saham perusahaan dan bermaksud (atau pernah bermaksud) untuk secara aktif mengejar perubahan strategi bisnis. Jadwal 13G menunjukkan investasi pasif lebih dari 5%.
The share price as of September 5, 2025 is 26.77 / share. Previously, on September 6, 2024, the share price was 26.80 / share. This represents a decline of 0.11% over that period.
Skor Sentimen Dana
Skor Sentimen Dana (sebelumnya dikenal sebagai Skor Akumulasi Kepemilikan) menemukan saham-saham yang paling banyak dibeli oleh dana. Ini adalah hasil dari model kuantitatif multi-faktor yang canggih yang mengidentifikasi perusahaan dengan tingkat akumulasi institusional tertinggi. Model penilaian menggunakan kombinasi dari total peningkatan pemilik yang diungkapkan, perubahan dalam alokasi portofolio pada pemilik tersebut, dan metrik lainnya. Angka berkisar dari 0 hingga 100, dengan angka yang lebih tinggi menunjukkan tingkat akumulasi yang lebih tinggi dibandingkan dengan perusahaan sejenisnya, dan 50 adalah rata-ratanya.
Frekuensi Pembaruan: Setiap Hari
Lihat Ownership Explorer, yang menyediakan daftar perusahaan dengan peringkat tertinggi.
Rasio Put/Call Institusional
Selain melaporkan isu ekuitas dan utang standar, institusi dengan aset di bawah manajemen lebih dari 100 juta dolar AS juga harus mengungkapkan kepemilikan opsi put dan call mereka. Karena opsi put umumnya menunjukkan sentimen negatif, dan opsi call menunjukkan sentimen positif, kita dapat mengetahui sentimen institusional secara keseluruhan dengan memplot rasio put terhadap call. Grafik di sebelah kanan memplot rasio put/call historis untuk instrumen ini.
Menggunakan Rasio Put/Call sebagai indikator sentimen investor mengatasi salah satu kekurangan utama dari penggunaan total kepemilikan institusional, yaitu sejumlah besar aset yang dikelola diinvestasikan secara pasif untuk melacak indeks. Dana yang dikelola secara pasif biasanya tidak membeli opsi, sehingga indikator rasio put/call lebih akurat dalam melacak sentimen dana yang dikelola secara aktif.
Pengajuan 13F dan NPORT
Detail pada pengajuan 13F tersedia gratis. Detail pada pengajuan NP memerlukan keanggotaan premium. Baris berwarna hijau menunjukkan posisi baru. Baris berwarna merah menunjukkan posisi yang sudah ditutup. Klik tautan ini ikon untuk melihat riwayat transaksi selengkapnya.
Tingkatkan
untuk membuka data premium dan mengekspor ke Excel ![]() .
.
| Tanggal File | Sumber | Investor | Ketik | Presyo ng Avg (Silangan) |
Saham | Δ Saham (%) |
Dilaporkan Nilai ($1000) |
Nilai Δ (%) |
Alokasi Port (%) |
|
|---|---|---|---|---|---|---|---|---|---|---|
| 2025-07-25 | 13F | We Are One Seven, LLC | 37,101 | -0.24 | 992 | 0.40 | ||||
| 2025-08-19 | NP | GSHIX - Goldman Sachs High Yield Fund Institutional | 370,775 | 9,915 | ||||||
| 2025-07-23 | 13F | Vontobel Holding Ltd. | 8,000 | 0.00 | 214 | 0.47 | ||||
| 2025-08-19 | NP | GFRAX - Goldman Sachs High Yield Floating Rate Fund Class A Shares | 737,892 | 313.98 | 19,731 | 316.71 | ||||
| 2025-07-08 | 13F | Parallel Advisors, LLC | 3,600 | -10.00 | 96 | -9.43 | ||||
| 2025-08-14 | 13F | Mariner, LLC | 154,776 | -33.60 | 4,139 | -33.18 | ||||
| 2025-08-14 | 13F | Bienville Capital Management, LLC | 109,768 | 2,935 | ||||||
| 2025-08-15 | 13F | Morgan Stanley | 1,275 | -16.12 | 34 | -15.00 | ||||
| 2025-08-08 | 13F | Gts Securities Llc | 0 | -100.00 | 0 | |||||
| 2025-08-13 | 13F | Cresset Asset Management, LLC | 0 | -100.00 | 0 | |||||
| 2025-08-14 | 13F | Goldman Sachs Group Inc | 1,172,835 | 462.65 | 31,362 | 466.29 | ||||
| 2025-08-04 | 13F | Assetmark, Inc | 300 | -58.39 | 8 | -57.89 | ||||
| 2025-08-13 | 13F | Mount Yale Investment Advisors, LLC | 206 | 6 | ||||||
| 2025-07-15 | 13F | FLP Wealth Management, LLC | 0 | -100.00 | 0 | |||||
| 2025-08-19 | 13F | Newbridge Financial Services Group, Inc. | 18,246 | 127.11 | 488 | 128.64 | ||||
| 2025-08-26 | 13F | Claris Financial LLC | 34,463 | 922 | ||||||
| 2025-05-16 | 13F | Empowered Funds, LLC | 0 | -100.00 | 0 | |||||
| 2025-08-13 | 13F/A | Claudia M.p. Batlle, Crp (r) Llc | 34,882 | 11.58 | 933 | 12.29 | ||||
| 2025-07-10 | 13F | CWC Advisors, LLC. | 137,504 | 10.68 | 3,677 | 11.39 | ||||
| 2025-08-08 | 13F | Cedar Wealth Management, LLC | 94,596 | 6.46 | 2,529 | 7.16 | ||||
| 2025-08-19 | 13F | Hohimer Wealth Management, Llc | 10,000 | 0.00 | 267 | 0.75 | ||||
| 2025-08-12 | 13F | SRS Capital Advisors, Inc. | 1,423,147 | 38,055 | ||||||
| 2025-08-15 | 13F | Kestra Advisory Services, LLC | 66,335 | 1,774 | ||||||
| 2025-07-21 | 13F | Triad Wealth Partners, LLC | 7,584 | -5.87 | 203 | -5.61 | ||||
| 2025-08-04 | 13F | Bay Colony Advisory Group, Inc d/b/a Bay Colony Advisors | 0 | -100.00 | 0 | -100.00 | ||||
| 2025-08-13 | 13F | Natixis Advisors, L.p. | 150,380 | 16.84 | 4 | 33.33 | ||||
| 2025-07-16 | 13F | Perigon Wealth Management, LLC | 0 | -100.00 | 0 | |||||
| 2025-08-13 | 13F | Renaissance Technologies Llc | 103,527 | 2,768 | ||||||
| 2025-08-15 | 13F | Tower Research Capital LLC (TRC) | 143,824 | 29,251.84 | 3,846 | 29,476.92 | ||||
| 2025-07-24 | 13F | WMG Financial Advisors, LLC | 64,650 | 55.22 | 1,729 | 56.24 | ||||
| 2025-08-01 | 13F | Envestnet Asset Management Inc | 139,740 | -50.29 | 3,737 | -49.98 | ||||
| 2025-08-12 | 13F | Proequities, Inc. | 0 | 0 | ||||||
| 2025-08-14 | 13F/A | Barclays Plc | 318,582 | 448.80 | 9 | 700.00 | ||||
| 2025-08-14 | 13F | Old Mission Capital Llc | 119,928 | 171.38 | 3,207 | 173.08 | ||||
| 2025-07-24 | 13F | Baldwin Brothers Inc/ma | 28,812 | -6.85 | 770 | -6.21 | ||||
| 2025-08-14 | 13F | Mml Investors Services, Llc | 0 | -100.00 | 0 | |||||
| 2025-07-15 | 13F | Elevated Capital Advisors, LLC | 19,865 | 0.00 | 528 | 0.00 | ||||
| 2025-07-17 | 13F | Sound Income Strategies, LLC | 88,616 | 286.46 | 2,370 | 289.00 | ||||
| 2025-07-14 | 13F | Sowell Financial Services LLC | 149,931 | -49.16 | 4,009 | -48.84 | ||||
| 2025-07-25 | 13F | Almanack Investment Partners, LLC. | 96,888 | 278.53 | 2,591 | 280.88 | ||||
| 2025-08-28 | NP | SIRAX - Sierra Tactical All Asset Fund Class A | 174,600 | 4,669 | ||||||
| 2025-07-30 | 13F | Mid-American Wealth Advisory Group, Inc. | 8 | 0 | ||||||
| 2025-08-13 | 13F | Basso Capital Management, L.p. | 3,500 | 94 | ||||||
| 2025-08-13 | 13F | Flow Traders U.s. Llc | 0 | -100.00 | 0 | |||||
| 2025-08-14 | 13F | Hilltop Holdings Inc. | 29,850 | 141.02 | 798 | 142.55 | ||||
| 2025-05-01 | 13F | Schechter Investment Advisors, LLC | 1,623,358 | 20.94 | 43,133 | 19.23 | ||||
| 2025-08-11 | 13F | Nordwand Advisors, LLC | 22,600 | 0.00 | 604 | 0.67 | ||||
| 2025-08-28 | NP | Northern Lights Fund Trust - Sierra Tactical Risk Spectrum 70 Fund Investor Class | 14,900 | -31.34 | 398 | -31.85 | ||||
| 2025-08-08 | 13F | Fortis Group Advisors, LLC | 0 | -100.00 | 0 | |||||
| 2025-08-04 | 13F | Impact Partnership Wealth, LLC | 27,582 | 738 | ||||||
| 2025-07-31 | 13F | Guardian Financial Partners, LLC | 772,041 | 1.98 | 20,644 | 2.63 | ||||
| 2025-05-29 | NP | FLOAX - Power Floating Rate Index Fund Class A | 371,741 | 9,877 | ||||||
| 2025-05-06 | 13F | a16z Perennial Management, L.P. | 0 | -100.00 | 0 | -100.00 | ||||
| 2025-08-14 | 13F | Napa Wealth Management | 17,686 | -5.25 | 473 | -4.65 | ||||
| 2025-08-28 | NP | Northern Lights Fund Trust - Sierra Tactical Risk Spectrum 30 Fund Instl Class | 93,900 | 2,511 | ||||||
| 2025-05-29 | NP | SSIZX - Sierra Tactical Core Income Fund Class A Shares | 0 | -100.00 | 0 | -100.00 | ||||
| 2025-08-14 | 13F | Jane Street Group, Llc | 303,824 | 254.83 | 8,124 | 257.10 | ||||
| 2025-08-14 | 13F | Royal Bank Of Canada | 5,699 | -63.46 | 152 | -63.29 | ||||
| 2025-07-31 | 13F | Cambridge Investment Research Advisors, Inc. | 11,351 | -61.21 | 0 | |||||
| 2025-08-13 | 13F | Rockport Wealth LLC | 88,686 | 11.78 | 2,371 | 12.48 | ||||
| 2025-08-18 | 13F | Tactive Advisors, LLC | 12,352 | 330 | ||||||
| 2025-07-28 | 13F | Copia Wealth Management | 29,141 | -0.57 | 779 | 0.13 | ||||
| 2025-08-11 | 13F | Knott David M Jr | 47,807 | 0.00 | 1,278 | 0.63 | ||||
| 2025-05-30 | NP | GDMA - Gadsden Dynamic Multi-Asset ETF | 0 | -100.00 | 0 | -100.00 | ||||
| 2025-08-13 | 13F | VestGen Advisors, LLC | 9,903 | -34.75 | 265 | -34.49 | ||||
| 2025-08-14 | 13F | Hrt Financial Lp | 0 | -100.00 | 0 | |||||
| 2025-08-12 | 13F | Fortis Capital Management LLC | 0 | -100.00 | 0 | |||||
| 2025-07-28 | 13F | Naviter Wealth, LLC | 0 | -100.00 | 0 | |||||
| 2025-05-08 | 13F | Plante Moran Financial Advisors, LLC | 0 | -100.00 | 0 | |||||
| 2025-07-09 | 13F | Reyes Financial Architecture, Inc. | 1,653 | 44 | ||||||
| 2025-07-31 | 13F | Darden Wealth Group Inc | 18,550 | 496 | ||||||
| 2025-08-14 | 13F | Kovitz Investment Group Partners, LLC | 1,164,679 | 7.88 | 31,144 | 8.58 | ||||
| 2025-04-28 | 13F | Mutual Advisors, LLC | 0 | -100.00 | 0 | -100.00 | ||||
| 2025-07-07 | 13F | Insight Wealth Strategies, LLC | 9,718 | 2.11 | 260 | 3.17 | ||||
| 2025-08-12 | 13F | Jpmorgan Chase & Co | 0 | -100.00 | 0 | |||||
| 2025-08-07 | 13F | Nwam Llc | 0 | -100.00 | 0 | |||||
| 2025-08-11 | 13F | Wealthspire Advisors, LLC | 12,922 | 346 | ||||||
| 2025-08-12 | 13F | Steward Partners Investment Advisory, Llc | 500 | 13 | ||||||
| 2025-08-14 | 13F | Stifel Financial Corp | 139,571 | 3,732 | ||||||
| 2025-08-05 | 13F | Verity Asset Management, Inc. | 44,424 | -34.65 | 1,188 | -34.27 | ||||
| 2025-07-30 | NP | Northern Lights Fund Trust IV - Brookstone Yield ETF | 278,951 | 2.89 | 7,507 | 2.23 | ||||
| 2025-08-06 | 13F | Spurstone Advisory Services, LLC | 14 | 0.00 | 0 | |||||
| 2025-07-08 | 13F | Gradient Investments LLC | 494,630 | 1.51 | 13,226 | 2.15 | ||||
| 2025-07-14 | 13F | Chris Bulman Inc | 0 | -100.00 | 0 | |||||
| 2025-05-01 | 13F | Kerntke Otto McGlone Wealth Management Group | 0 | -100.00 | 0 | |||||
| 2025-08-14 | 13F | Bank Of America Corp /de/ | 9 | 0 | ||||||
| 2025-04-24 | 13F | Wright Fund Managment, LLC | 0 | -100.00 | 0 | |||||
| 2025-08-06 | 13F | AE Wealth Management LLC | 43,796 | -24.85 | 1,171 | -24.35 | ||||
| 2025-08-14 | 13F | UBS Group AG | 11,063 | -92.78 | 296 | -92.75 | ||||
| 2025-07-25 | 13F | Cwm, Llc | 197 | 0 | ||||||
| 2025-07-29 | 13F | Koshinski Asset Management, Inc. | 12,802 | 342 | ||||||
| 2025-08-06 | 13F | Commonwealth Equity Services, Llc | 10,825 | -67.01 | 0 | |||||
| 2025-08-14 | 13F | BI Asset Management Fondsmaeglerselskab A/S | 47,999 | 0.00 | 1 | 0.00 | ||||
| 2025-07-25 | 13F | Griffin Asset Management, Inc. | 20,996 | 561 | ||||||
| 2025-08-06 | 13F | New Millennium Group LLC | 35 | 0.00 | 1 | |||||
| 2025-04-22 | 13F | Castleview Partners, Llc | 0 | -100.00 | 0 | |||||
| 2025-05-19 | 13F/A | Advisory Alpha, LLC | 0 | -100.00 | 0 | -100.00 | ||||
| 2025-07-29 | 13F | Primoris Wealth Advisors, Llc | 23,500 | 128.16 | 628 | 130.04 | ||||
| 2025-08-11 | 13F | Principal Securities, Inc. | 737 | 20 | ||||||
| 2025-05-15 | 13F | Warren Averett Asset Management, LLC | 0 | -100.00 | 0 | -100.00 | ||||
| 2025-07-25 | 13F | Sequoia Financial Advisors, LLC | 11,964 | 2.10 | 320 | 2.57 | ||||
| 2025-04-15 | 13F | Transform Wealth, LLC | 138,314 | -18.76 | 3,675 | -20.40 | ||||
| 2025-08-11 | 13F | Pineridge Advisors LLC | 300 | 0.67 | 8 | 14.29 | ||||
| 2025-09-04 | 13F/A | Advisor Group Holdings, Inc. | 22,471 | -50.94 | 601 | -50.62 | ||||
| 2025-08-06 | 13F | Ethos Financial Group, LLC | 28,653 | 78.31 | 766 | 75.69 | ||||
| 2025-08-11 | 13F | HighTower Advisors, LLC | 118,769 | 289.67 | 3,176 | 292.46 | ||||
| 2025-08-07 | 13F | Security Benefit Life Insurance Co /ks/ | 1,625,576 | 0.00 | 43,468 | 0.64 | ||||
| 2025-08-12 | 13F | Gladstone Institutional Advisory LLC | 45,850 | -5.53 | 1,226 | -4.89 | ||||
| 2025-05-20 | 13F | Belpointe Asset Management LLC | 0 | -100.00 | 0 | -100.00 | ||||
| 2025-08-05 | 13F | Bank Of Montreal /can/ | 0 | -100.00 | 0 | |||||
| 2025-05-12 | 13F | Founders Financial Securities Llc | 0 | -100.00 | 0 | |||||
| 2025-07-22 | 13F | Valeo Financial Advisors, LLC | 123,764 | 0.00 | 3,309 | 0.64 | ||||
| 2025-08-11 | 13F | Inspire Advisors, LLC | 0 | -100.00 | 0 | |||||
| 2025-07-29 | 13F | Mattson Financial Services, LLC | 0 | -100.00 | 0 | |||||
| 2025-05-05 | 13F | Lindbrook Capital, Llc | 5,500 | -47.62 | 146 | -48.23 | ||||
| 2025-08-12 | 13F | Manchester Capital Management LLC | 4,000 | 0.00 | 107 | 0.00 | ||||
| 2025-07-31 | 13F | State of New Jersey Common Pension Fund D | 1,000,000 | 0.00 | 26,740 | 0.64 | ||||
| 2025-08-08 | 13F | Donoghue Forlines LLC | 0 | -100.00 | 0 | |||||
| 2025-08-28 | NP | Northern Lights Fund Trust - Sierra Tactical Risk Spectrum 50 Fund Investor Class | 119,600 | 3,198 | ||||||
| 2025-08-14 | 13F | Arete Wealth Advisors, LLC | 0 | -100.00 | 0 | |||||
| 2025-07-30 | 13F | Brookstone Capital Management | 421,192 | -0.07 | 11,263 | 0.56 | ||||
| 2025-08-14 | 13F | Susquehanna International Group, Llp | 0 | -100.00 | 0 | |||||
| 2025-08-06 | 13F | Black Swift Group, LLC | 433,340 | -14.94 | 11,588 | -14.40 | ||||
| 2025-08-12 | 13F | CIBC Private Wealth Group, LLC | 3,722 | 0.00 | 100 | 5.32 | ||||
| 2025-07-15 | 13F | Fifth Third Bancorp | 34,372 | 0.00 | 919 | 0.66 | ||||
| 2025-07-18 | 13F | Truist Financial Corp | 0 | -100.00 | 0 | |||||
| 2025-08-04 | 13F | Atria Investments Llc | 165,953 | -40.85 | 4,438 | -40.48 | ||||
| 2025-05-01 | 13F | Park Square Financial Group, LLC | 0 | -100.00 | 0 | |||||
| 2025-08-11 | 13F | Private Advisor Group, LLC | 0 | -100.00 | 0 | |||||
| 2025-08-14 | 13F | Citadel Advisors Llc | 51,614 | -33.14 | 1,380 | -32.72 | ||||
| 2025-07-28 | 13F | Harbour Investments, Inc. | 11,757 | 0.00 | 314 | 0.64 | ||||
| 2025-08-07 | 13F | Allworth Financial LP | 1,700 | 45 |