Mga Batayang Estadistika
| Pemilik Institusional | 130 total, 130 long only, 0 short only, 0 long/short - change of -5.00% MRQ |
| Alokasi Portofolio Rata-rata | 0.2904 % - change of -11.41% MRQ |
| Saham Institusional (Jangka Panjang) | 9,729,365 (ex 13D/G) - change of 1.09MM shares 12.66% MRQ |
| Nilai Institusional (Jangka Panjang) | $ 320,279 USD ($1000) |
Kepemilikan Institusional dan Pemegang Saham
iPath Bloomberg Commodity Index Total Return ETN - Structured Product (US:DJP) memiliki 130 pemilik institusional dan pemegang saham yang telah mengajukan formulir 13D/G atau 13F kepada Komisi Bursa Efek (Securities Exchange Commission/SEC). Lembaga-lembaga ini memegang total 9,729,365 saham. Pemegang saham terbesar meliputi BLB&B Advisors, LLC, Cassaday & Co Wealth Management LLC, Osborne Partners Capital Management, Llc, Wealth Enhancement Advisory Services, Llc, Dimension Capital Management Llc, Badgley Phelps Wealth Managers, LLC, Camden Capital, LLC, Heartland Bank & Trust Co, Legend Financial Advisors, Inc., and Unique Wealth, Llc .
Struktur kepemilikan institusional iPath Bloomberg Commodity Index Total Return ETN - Structured Product (ARCA:DJP) menunjukkan posisi terkini di perusahaan oleh institusi dan dana, serta perubahan terbaru dalam ukuran posisi. Pemegang saham utama dapat mencakup investor individu, reksa dana, dana lindung nilai, atau institusi. Jadwal 13D menunjukkan bahwa investor memegang (atau pernah memegang) lebih dari 5% saham perusahaan dan bermaksud (atau pernah bermaksud) untuk secara aktif mengejar perubahan strategi bisnis. Jadwal 13G menunjukkan investasi pasif lebih dari 5%.
The share price as of September 5, 2025 is 34.40 / share. Previously, on September 9, 2024, the share price was 29.91 / share. This represents an increase of 15.01% over that period.

Skor Sentimen Dana
Skor Sentimen Dana (sebelumnya dikenal sebagai Skor Akumulasi Kepemilikan) menemukan saham-saham yang paling banyak dibeli oleh dana. Ini adalah hasil dari model kuantitatif multi-faktor yang canggih yang mengidentifikasi perusahaan dengan tingkat akumulasi institusional tertinggi. Model penilaian menggunakan kombinasi dari total peningkatan pemilik yang diungkapkan, perubahan dalam alokasi portofolio pada pemilik tersebut, dan metrik lainnya. Angka berkisar dari 0 hingga 100, dengan angka yang lebih tinggi menunjukkan tingkat akumulasi yang lebih tinggi dibandingkan dengan perusahaan sejenisnya, dan 50 adalah rata-ratanya.
Frekuensi Pembaruan: Setiap Hari
Lihat Ownership Explorer, yang menyediakan daftar perusahaan dengan peringkat tertinggi.
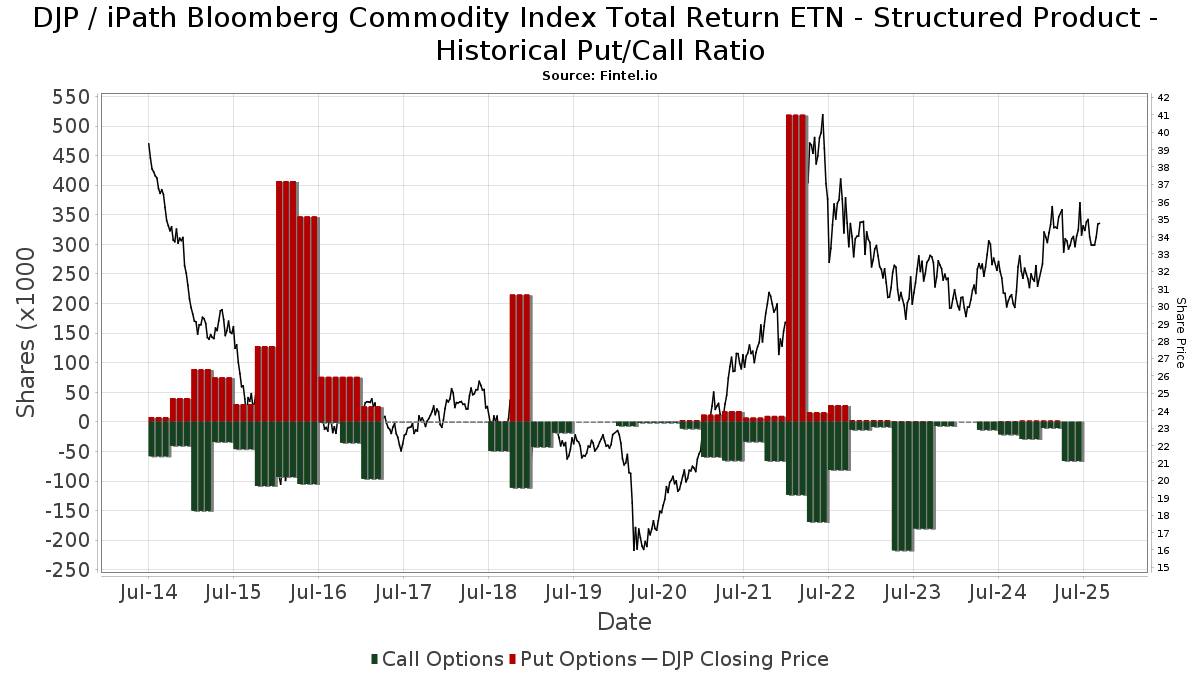
Rasio Put/Call Institusional
Selain melaporkan isu ekuitas dan utang standar, institusi dengan aset di bawah manajemen lebih dari 100 juta dolar AS juga harus mengungkapkan kepemilikan opsi put dan call mereka. Karena opsi put umumnya menunjukkan sentimen negatif, dan opsi call menunjukkan sentimen positif, kita dapat mengetahui sentimen institusional secara keseluruhan dengan memplot rasio put terhadap call. Grafik di sebelah kanan memplot rasio put/call historis untuk instrumen ini.
Menggunakan Rasio Put/Call sebagai indikator sentimen investor mengatasi salah satu kekurangan utama dari penggunaan total kepemilikan institusional, yaitu sejumlah besar aset yang dikelola diinvestasikan secara pasif untuk melacak indeks. Dana yang dikelola secara pasif biasanya tidak membeli opsi, sehingga indikator rasio put/call lebih akurat dalam melacak sentimen dana yang dikelola secara aktif.
Pengajuan 13F dan NPORT
Detail pada pengajuan 13F tersedia gratis. Detail pada pengajuan NP memerlukan keanggotaan premium. Baris berwarna hijau menunjukkan posisi baru. Baris berwarna merah menunjukkan posisi yang sudah ditutup. Klik tautan ini ikon untuk melihat riwayat transaksi selengkapnya.
Tingkatkan
untuk membuka data premium dan mengekspor ke Excel ![]() .
.
| Tanggal File | Sumber | Investor | Ketik | Presyo ng Avg (Silangan) |
Saham | Δ Saham (%) |
Dilaporkan Nilai ($1000) |
Nilai Δ (%) |
Alokasi Port (%) |
|
|---|---|---|---|---|---|---|---|---|---|---|
| 2025-07-14 | 13F | Matrix Trust Co | 4,219 | 0 | ||||||
| 2025-07-10 | 13F | Wealth Enhancement Advisory Services, Llc | 495,181 | -5.14 | 17,108 | -7.18 | ||||
| 2025-08-14 | 13F/A | Barclays Plc | 10,200 | 0.00 | 0 | |||||
| 2025-08-13 | 13F | Beacon Pointe Advisors, LLC | 11,983 | -21.09 | 407 | -24.07 | ||||
| 2025-08-14 | 13F | Raymond James Financial Inc | 2,296 | 78 | ||||||
| 2025-09-04 | 13F/A | Advisor Group Holdings, Inc. | 1,865 | -2.92 | 63 | -5.97 | ||||
| 2025-05-14 | 13F | Capital Wealth Alliance, LLC | 19 | |||||||
| 2025-05-07 | 13F | Tcw Group Inc | 0 | -100.00 | 0 | |||||
| 2025-07-25 | 13F | Cwm, Llc | 2,095 | 0.00 | 0 | |||||
| 2025-07-11 | 13F/A | Umb Bank N A/mo | 3,435 | 0.00 | 117 | -4.13 | ||||
| 2025-08-14 | 13F | Camden Capital, LLC | 204,390 | 0.00 | 6,945 | -3.77 | ||||
| 2025-08-13 | 13F | Flow Traders U.s. Llc | 0 | -100.00 | 0 | |||||
| 2025-07-24 | 13F | Us Bancorp \de\ | 8,051 | -12.22 | 274 | -15.48 | ||||
| 2025-08-14 | 13F | Susquehanna International Group, Llp | 16,132 | 548 | ||||||
| 2025-07-23 | 13F | Bear Mountain Capital, Inc. | 2 | 0.00 | 0 | |||||
| 2025-07-23 | 13F | Slow Capital, Inc. | 17,381 | -2.40 | 591 | -6.05 | ||||
| 2025-08-12 | 13F | Proequities, Inc. | 0 | 0 | ||||||
| 2025-08-14 | 13F | Susquehanna International Group, Llp | Call | 66,900 | 604.21 | 2,273 | 578.51 | |||
| 2025-07-29 | 13F | Liberty Square Wealth Partners Llc | 18,453 | -8.20 | 627 | -11.57 | ||||
| 2025-07-23 | 13F | Lansing Street Advisors | 14,727 | -41.51 | 500 | -43.76 | ||||
| 2025-07-28 | 13F | Kiker Wealth Management, LLC | 0 | -100.00 | 0 | |||||
| 2025-08-12 | 13F | PSI Advisors, LLC | 0 | -100.00 | 0 | |||||
| 2025-08-13 | 13F | Baker Avenue Asset Management, LP | 16,293 | 0.00 | 554 | -3.83 | ||||
| 2025-08-15 | 13F | Morgan Stanley | 55,700 | -60.50 | 1,893 | -62.00 | ||||
| 2025-07-30 | 13F | Patten Group, Inc. | 18,589 | 632 | ||||||
| 2025-08-12 | 13F | Blueprint Investment Partners LLC | 0 | -100.00 | 0 | |||||
| 2025-08-14 | 13F | CoreCap Advisors, LLC | 172,342 | 4.75 | 5,856 | 0.81 | ||||
| 2025-07-25 | 13F | Atria Wealth Solutions, Inc. | 0 | -100.00 | 0 | |||||
| 2025-08-08 | 13F | Pnc Financial Services Group, Inc. | 2,399 | 0.00 | 82 | -3.57 | ||||
| 2025-07-07 | 13F | Bangor Savings Bank | 6,050 | 32.36 | 206 | 27.33 | ||||
| 2025-07-31 | 13F | Cambridge Investment Research Advisors, Inc. | 129,601 | 19.40 | 4 | 33.33 | ||||
| 2025-04-16 | 13F | Wealth Enhancement Advisory Services, Llc | Call | 0 | -100.00 | 0 | -100.00 | |||
| 2025-08-14 | 13F | Dimension Capital Management Llc | 482,900 | -3.49 | 16,409 | -7.13 | ||||
| 2025-07-18 | 13F | Truist Financial Corp | 0 | -100.00 | 0 | |||||
| 2025-05-08 | 13F | Geneos Wealth Management Inc. | 0 | -100.00 | 0 | |||||
| 2025-08-14 | 13F | Main Street Financial Solutions, LLC | 14,905 | -25.95 | 506 | -28.73 | ||||
| 2025-08-13 | 13F | MONECO Advisors, LLC | 27,495 | 0.79 | 934 | -3.01 | ||||
| 2025-08-14 | 13F | Jane Street Group, Llc | 36,819 | 1,251 | ||||||
| 2025-08-14 | 13F | Stifel Financial Corp | 19,506 | 14.57 | 663 | 10.15 | ||||
| 2025-08-15 | 13F | Kestra Advisory Services, LLC | 0 | -100.00 | 0 | |||||
| 2025-08-05 | 13F | Huntington National Bank | 0 | |||||||
| 2025-08-01 | 13F | Rossby Financial, LCC | 47 | 0.00 | 2 | 0.00 | ||||
| 2025-08-05 | 13F | RiverGlades Family Offices LLC | 76,800 | 2.13 | 2,610 | -1.73 | ||||
| 2025-08-14 | 13F | Snowden Capital Advisors LLC | 19,560 | 0.00 | 665 | -3.77 | ||||
| 2025-08-13 | 13F | Measured Wealth Private Client Group, LLC | 8,364 | -0.49 | 284 | -4.05 | ||||
| 2025-07-23 | 13F | Peak Financial Management, Inc. | 49,081 | 7.36 | 1,668 | 3.28 | ||||
| 2025-07-25 | 13F | Concord Wealth Partners | 14 | 0.00 | 0 | |||||
| 2025-07-17 | 13F | Janney Montgomery Scott LLC | 24,602 | -16.42 | 1 | -100.00 | ||||
| 2025-08-13 | 13F | Idaho Trust Bank | 59,579 | -29.45 | 2,024 | -32.11 | ||||
| 2025-05-14 | 13F | Congress Wealth Management LLC / DE / | 0 | -100.00 | 0 | |||||
| 2025-08-14 | 13F | Transamerica Financial Advisors, Inc. | 23 | 0.00 | 1 | |||||
| 2025-08-13 | 13F | Jones Financial Companies Lllp | 0 | -100.00 | 0 | |||||
| 2025-08-07 | 13F | Proficio Capital Partners LLC | 100,575 | 3,418 | ||||||
| 2025-08-15 | 13F | CI Private Wealth, LLC | 12,440 | 11.42 | 423 | 7.11 | ||||
| 2025-08-19 | 13F | Advisory Services Network, LLC | 25,340 | -12.67 | 855 | -16.50 | ||||
| 2025-07-16 | 13F | MontVue Capital Management, Inc. | 15,480 | 1.53 | 526 | -2.23 | ||||
| 2025-08-14 | 13F | Alliancebernstein L.p. | 6,911 | 0.00 | 235 | -4.10 | ||||
| 2025-08-14 | 13F | Citadel Advisors Llc | Call | 0 | -100.00 | 0 | ||||
| 2025-08-15 | 13F | Captrust Financial Advisors | 27,120 | -5.30 | 922 | -8.90 | ||||
| 2025-08-08 | 13F | Cornerstone Advisors Asset Management, Inc | 0 | -100.00 | 0 | |||||
| 2025-08-14 | 13F | Boston Private Wealth Llc | 0 | -100.00 | 0 | |||||
| 2025-08-12 | 13F | Belmont Capital, LLC | 747 | 0.00 | 25 | -3.85 | ||||
| 2025-05-14 | 13F | Kayne Anderson Rudnick Investment Management Llc | 0 | -100.00 | 0 | -100.00 | ||||
| 2025-08-14 | 13F | First Foundation Advisors | 108,347 | -1.27 | 3,682 | -4.98 | ||||
| 2025-07-08 | 13F | Cultivar Capital, Inc. | 139,255 | 7.39 | 4,732 | 3.34 | ||||
| 2025-04-11 | 13F | Insight Advisors, LLC/ PA | 0 | -100.00 | 0 | |||||
| 2025-07-24 | 13F | Acima Private Wealth, Llc | 163,502 | -1.10 | 5,556 | -4.83 | ||||
| 2025-07-29 | 13F | JTC Employer Solutions Trusteee Ltd | 22,690 | 0.00 | 1 | |||||
| 2025-08-04 | 13F | Clear Investment Research, Llc | 5,265 | 0.27 | 179 | -3.78 | ||||
| 2025-08-01 | 13F | Bank of Jackson Hole Trust | 162 | 0.00 | 6 | 0.00 | ||||
| 2025-08-06 | 13F | Ironwood Wealth Management, LLC. | 91,169 | -26.88 | 3,098 | -29.65 | ||||
| 2025-08-13 | 13F | Global Endowment Management, LP | 108,550 | 101.02 | 3,689 | 93.49 | ||||
| 2025-07-24 | 13F/A | McElhenny Sheffield Capital Management, LLC | 7,382 | -62.26 | 251 | -63.77 | ||||
| 2025-08-13 | 13F | Continuum Advisory, LLC | 0 | -100.00 | 0 | |||||
| 2025-08-04 | 13F | Atria Investments Llc | 25,491 | -4.42 | 866 | -7.97 | ||||
| 2025-08-14 | 13F | GWM Advisors LLC | 110 | -31.25 | 4 | -40.00 | ||||
| 2025-07-28 | 13F | BRYN MAWR TRUST Co | 2,682 | -9.58 | 91 | -12.50 | ||||
| 2025-05-13 | 13F | NFP Retirement, Inc. | 0 | -100.00 | 0 | |||||
| 2025-08-12 | 13F | Coldstream Capital Management Inc | 13,479 | 0.00 | 458 | -3.58 | ||||
| 2025-08-14 | 13F | UBS Group AG | 1,662 | 0.00 | 56 | -3.45 | ||||
| 2025-08-12 | 13F | Steward Partners Investment Advisory, Llc | 400 | 0.00 | 14 | -7.14 | ||||
| 2025-07-24 | 13F | IFP Advisors, Inc | 16 | 0.00 | 1 | |||||
| 2025-08-12 | 13F | CIBC Private Wealth Group, LLC | 1,809 | 0.00 | 61 | 7.02 | ||||
| 2025-08-19 | 13F | National Asset Management, Inc. | 68,919 | -16.59 | 2,342 | -11.69 | ||||
| 2025-08-12 | 13F | Osborne Partners Capital Management, Llc | 743,208 | -1.30 | 25,254 | -5.02 | ||||
| 2025-07-15 | 13F | Capstone Wealth Management Group LLC | 7,285 | 0.00 | 248 | -3.89 | ||||
| 2025-08-08 | 13F | Bailard, Inc. | 22,000 | 0.00 | 748 | -3.74 | ||||
| 2025-08-12 | 13F | Associated Banc-corp | 15,867 | -1.18 | 539 | -4.77 | ||||
| 2025-05-16 | 13F | Coppell Advisory Solutions LLC | 0 | -100.00 | 0 | |||||
| 2025-07-24 | 13F | Forefront Analytics, LLC | 40,273 | 558.06 | 1,368 | 533.33 | ||||
| 2025-08-06 | 13F | First Horizon Advisors, Inc. | 8,688 | -27.47 | 295 | -30.09 | ||||
| 2025-08-12 | 13F | MAI Capital Management | 5,485 | -17.17 | 186 | -20.17 | ||||
| 2025-07-25 | 13F | Heartland Bank & Trust Co | 202,834 | -0.54 | 6,892 | -4.28 | ||||
| 2025-08-08 | 13F | Cetera Investment Advisers | 10,542 | -0.61 | 358 | -4.28 | ||||
| 2025-08-07 | 13F | Topel & Distasi Wealth Management, LLC | 20,989 | -24.51 | 713 | -27.32 | ||||
| 2025-08-07 | 13F | Allworth Financial LP | 260 | 0.00 | 9 | 0.00 | ||||
| 2025-07-11 | 13F | Farther Finance Advisors, LLC | 346 | -30.38 | 12 | -35.29 | ||||
| 2025-08-14 | 13F | Citadel Advisors Llc | 15,831 | -34.32 | 538 | -36.90 | ||||
| 2025-07-31 | 13F | Brighton Jones Llc | 8,817 | 0.00 | 300 | -3.86 | ||||
| 2025-08-11 | 13F | Cornerstone Planning Group LLC | 0 | -100.00 | 0 | |||||
| 2025-08-12 | 13F | LPL Financial LLC | 35,314 | 0.12 | 1,200 | -3.69 | ||||
| 2025-08-14 | 13F | Cardiff Park Advisors, Llc | 7,072 | 11.18 | 240 | 7.14 | ||||
| 2025-07-15 | 13F | Patriot Investment Management Inc. | 17,570 | 0.00 | 597 | -3.71 | ||||
| 2025-07-23 | 13F | Colony Family Offices, LLC | 6,494 | 0.00 | 221 | -3.93 | ||||
| 2025-07-22 | 13F | Unique Wealth, Llc | 196,598 | 3.55 | 6,680 | -0.36 | ||||
| 2025-07-25 | 13F | Envestnet Portfolio Solutions, Inc. | 32,969 | -39.26 | 1,120 | -41.54 | ||||
| 2025-08-06 | 13F | Washington Trust Bank | 60,378 | -16.57 | 2,052 | -19.73 | ||||
| 2025-07-29 | 13F | Lyell Wealth Management, Lp | 6,350 | 216 | ||||||
| 2025-08-08 | 13F | Croban | 40,273 | 4.72 | 1,368 | 0.81 | ||||
| 2025-06-26 | NP | TGPNX - TCW Conservative Allocation Fund Class N Shares | 7,060 | -31.92 | 235 | -32.76 | ||||
| 2025-08-19 | 13F/A | Pitcairn Co | 11,902 | 0.00 | 404 | -3.81 | ||||
| 2025-08-14 | 13F | Hancock Whitney Corp | 86,276 | -20.47 | 2,932 | -23.47 | ||||
| 2025-04-22 | 13F | FSC Wealth Advisors, LLC | 0 | -100.00 | 0 | |||||
| 2025-07-16 | 13F | Legend Financial Advisors, Inc. | 196,620 | -0.65 | 6,681 | -4.39 | ||||
| 2025-07-23 | 13F | Vontobel Holding Ltd. | 20,399 | -0.06 | 693 | -3.75 | ||||
| 2025-08-06 | 13F | Commonwealth Equity Services, Llc | 119,289 | 4 | ||||||
| 2025-08-13 | 13F | Northwestern Mutual Wealth Management Co | 146 | 5 | ||||||
| 2025-08-05 | 13F | Cassaday & Co Wealth Management LLC | 1,301,137 | 44,213 | ||||||
| 2025-07-09 | 13F | Bruce G. Allen Investments, LLC | 97,508 | -3.26 | 3,313 | -6.91 | ||||
| 2025-08-14 | 13F | Goldman Sachs Group Inc | 92,024 | -1.82 | 3,127 | -5.53 | ||||
| 2025-08-06 | 13F | Nvwm, Llc | 17,245 | -70.67 | 586 | -71.81 | ||||
| 2025-08-15 | 13F | WFA of San Diego, LLC | 195 | 0.00 | 7 | 0.00 | ||||
| 2025-05-14 | 13F | Caitlin John, LLC | 0 | -100.00 | 0 | |||||
| 2025-08-14 | 13F | Bank Of America Corp /de/ | 117 | -5.69 | ||||||
| 2025-07-08 | 13F | Parallel Advisors, LLC | 340 | 0.00 | 12 | -8.33 | ||||
| 2025-08-14 | 13F | Fort Point Capital Partners LLC | 0 | -100.00 | 0 | |||||
| 2025-08-11 | 13F | HighTower Advisors, LLC | 11,253 | 0.00 | 382 | -3.78 | ||||
| 2025-08-07 | 13F | Apeiron RIA LLC | 8,298 | 1.05 | 282 | -2.77 | ||||
| 2025-08-12 | 13F | Deutsche Bank Ag\ | 155 | 0.00 | 5 | 0.00 | ||||
| 2025-08-12 | 13F | Jpmorgan Chase & Co | 13,990 | -8.15 | 475 | -11.55 | ||||
| 2025-08-14 | 13F | Wells Fargo & Company/mn | 2,268 | 126.57 | 77 | 120.00 | ||||
| 2025-07-28 | 13F | Harbour Investments, Inc. | 86 | -80.50 | 3 | -86.67 | ||||
| 2025-07-16 | 13F | Strategic Investment Solutions, Inc. /IL | 330 | 0.00 | 11 | 0.00 | ||||
| 2025-07-30 | 13F | Whittier Trust Co | 110 | 0.00 | 4 | 0.00 | ||||
| 2025-08-04 | 13F | BLB&B Advisors, LLC | 2,102,164 | 2.48 | 71,432 | -1.38 | ||||
| 2025-08-04 | 13F | Mesirow Financial Investment Management, Inc. | 8,050 | 0.00 | 274 | -3.87 | ||||
| 2025-08-14 | 13F | Citadel Advisors Llc | Put | 0 | -100.00 | 0 | ||||
| 2025-08-08 | 13F | Empower Advisory Group, LLC | 12,968 | -3.58 | 441 | -7.17 | ||||
| 2025-07-31 | 13F | Sharper & Granite LLC | 57,233 | -8.67 | 1,981 | -10.49 | ||||
| 2025-07-28 | 13F | Sagace Wealth Management LLC | 6,235 | -86.72 | 212 | -87.27 | ||||
| 2025-08-19 | 13F | MRP Capital Investments, LLC | 0 | -100.00 | 0 | |||||
| 2025-07-29 | 13F | Chicago Partners Investment Group LLC | 77,785 | 1.08 | 2,720 | 5.55 | ||||
| 2025-08-14 | 13F | Federation des caisses Desjardins du Quebec | 0 | -100.00 | 0 | |||||
| 2025-08-14 | 13F | Royal Bank Of Canada | 12,860 | 2.17 | 437 | -1.80 | ||||
| 2025-08-14 | 13F | RMB Capital Management, LLC | 9,168 | 3.22 | 312 | -0.64 | ||||
| 2025-08-13 | 13F | Cerity Partners LLC | 30,568 | -0.47 | 1,039 | -4.24 | ||||
| 2025-07-16 | 13F | Badgley Phelps Wealth Managers, LLC | 473,935 | 0.69 | 16,104 | -3.10 | ||||
| 2025-08-06 | 13F | Rialto Wealth Management, LLC | 157 | 0.00 | 5 | 0.00 | ||||
| 2025-08-01 | 13F | Envestnet Asset Management Inc | 18,538 | -33.97 | 630 | -36.53 | ||||
| 2025-08-05 | 13F | Plante Moran Financial Advisors, LLC | 57 | 2 | ||||||
| 2025-08-14 | 13F | AllSquare Wealth Management LLC | 34,125 | 0.11 | 1,160 | -3.66 | ||||
| 2025-07-24 | 13F | PDS Planning, Inc | 8,067 | 0.00 | 274 | -3.52 | ||||
| 2025-08-14 | 13F | EP Wealth Advisors, Inc. | 26,164 | 168.10 | 889 | 158.43 | ||||
| 2025-07-02 | 13F | Boston Standard Wealth Management, LLC | 8,716 | 20.37 | 296 | 27.59 | ||||
| 2025-07-01 | 13F | Stonehearth Capital Management, LLC | 0 | -100.00 | 0 | |||||
| 2025-07-09 | 13F | Camelot Technology Advisors, Inc. | 14,634 | -7.45 | 497 | -10.93 | ||||
| 2025-08-07 | 13F | Parkside Financial Bank & Trust | 10,344 | 16.85 | 351 | 12.50 | ||||
| 2025-07-18 | 13F | SOA Wealth Advisors, LLC. | 45 | 0.00 | 2 | 0.00 | ||||
| 2025-08-13 | 13F | Lido Advisors, LLC | 34,408 | 0.00 | 1,169 | -3.71 | ||||
| 2025-08-01 | 13F | Bessemer Group Inc | 870 | -87.24 | 0 | |||||
| 2025-08-18 | 13F | Front Row Advisors LLC | 221 | 0.00 | 8 | 0.00 | ||||
| 2025-07-15 | 13F | Evanson Asset Management, LLC | 0 | -100.00 | 0 | |||||
| 2025-07-25 | 13F | Ackerman Capital Advisors, LLC | 113,095 | 3,843 | ||||||
| 2025-04-21 | 13F | Kingswood Wealth Advisors, Llc | 0 | -100.00 | 0 | |||||
| 2025-08-14 | 13F | Ameriprise Financial Inc | 196,302 | -2.34 | 6,670 | -6.00 |