Mga Batayang Estadistika
| Pemilik Institusional | 58 total, 58 long only, 0 short only, 0 long/short - change of 13.73% MRQ |
| Alokasi Portofolio Rata-rata | 0.0124 % - change of -29.49% MRQ |
| Saham Institusional (Jangka Panjang) | 443,377 (ex 13D/G) - change of -0.04MM shares -9.14% MRQ |
| Nilai Institusional (Jangka Panjang) | $ 13,502 USD ($1000) |
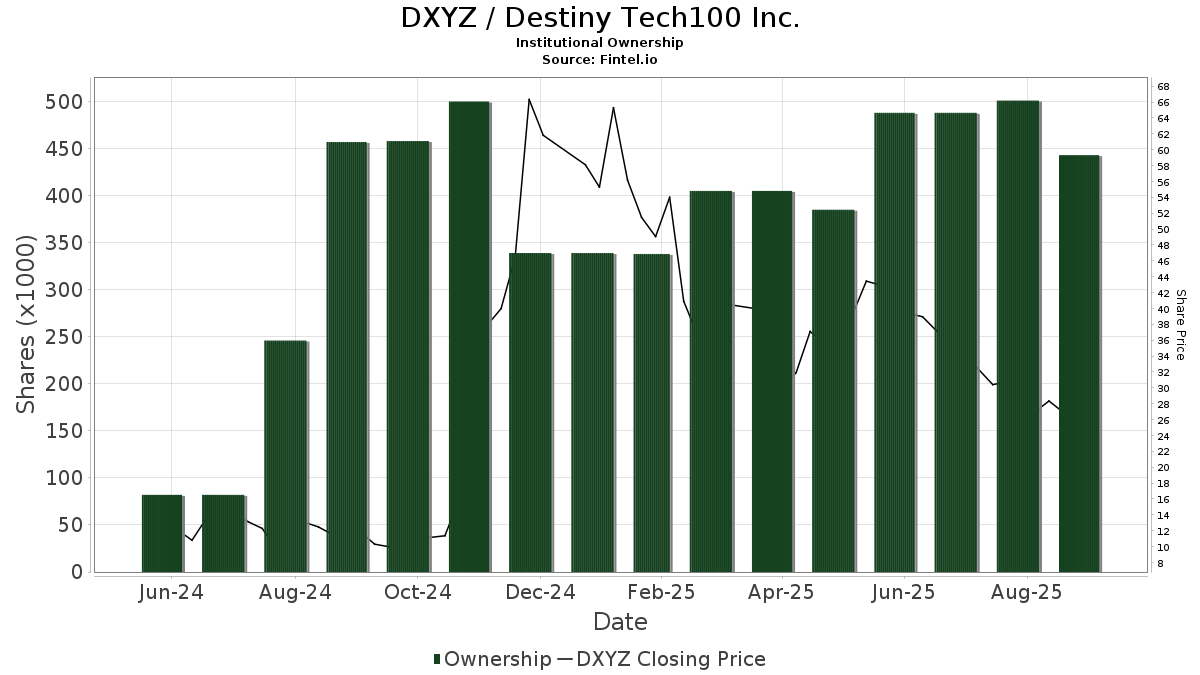
Kepemilikan Institusional dan Pemegang Saham
Destiny Tech100 Inc. (US:DXYZ) memiliki 58 pemilik institusional dan pemegang saham yang telah mengajukan formulir 13D/G atau 13F kepada Komisi Bursa Efek (Securities Exchange Commission/SEC). Lembaga-lembaga ini memegang total 443,377 saham. Pemegang saham terbesar meliputi Commonwealth Equity Services, Llc, Morgan Stanley, LPL Financial LLC, Kestra Advisory Services, LLC, UBS Group AG, PSP - Invesco Global Listed Private Equity ETF, Stifel Financial Corp, Invesco Ltd., Strategy Asset Managers Llc, and Mariner, LLC .
Struktur kepemilikan institusional Destiny Tech100 Inc. (NYSE:DXYZ) menunjukkan posisi terkini di perusahaan oleh institusi dan dana, serta perubahan terbaru dalam ukuran posisi. Pemegang saham utama dapat mencakup investor individu, reksa dana, dana lindung nilai, atau institusi. Jadwal 13D menunjukkan bahwa investor memegang (atau pernah memegang) lebih dari 5% saham perusahaan dan bermaksud (atau pernah bermaksud) untuk secara aktif mengejar perubahan strategi bisnis. Jadwal 13G menunjukkan investasi pasif lebih dari 5%.
The share price as of September 5, 2025 is 25.82 / share. Previously, on September 6, 2024, the share price was 10.26 / share. This represents an increase of 151.66% over that period.
Skor Sentimen Dana
Skor Sentimen Dana (sebelumnya dikenal sebagai Skor Akumulasi Kepemilikan) menemukan saham-saham yang paling banyak dibeli oleh dana. Ini adalah hasil dari model kuantitatif multi-faktor yang canggih yang mengidentifikasi perusahaan dengan tingkat akumulasi institusional tertinggi. Model penilaian menggunakan kombinasi dari total peningkatan pemilik yang diungkapkan, perubahan dalam alokasi portofolio pada pemilik tersebut, dan metrik lainnya. Angka berkisar dari 0 hingga 100, dengan angka yang lebih tinggi menunjukkan tingkat akumulasi yang lebih tinggi dibandingkan dengan perusahaan sejenisnya, dan 50 adalah rata-ratanya.
Frekuensi Pembaruan: Setiap Hari
Lihat Ownership Explorer, yang menyediakan daftar perusahaan dengan peringkat tertinggi.
Rasio Put/Call Institusional
Selain melaporkan isu ekuitas dan utang standar, institusi dengan aset di bawah manajemen lebih dari 100 juta dolar AS juga harus mengungkapkan kepemilikan opsi put dan call mereka. Karena opsi put umumnya menunjukkan sentimen negatif, dan opsi call menunjukkan sentimen positif, kita dapat mengetahui sentimen institusional secara keseluruhan dengan memplot rasio put terhadap call. Grafik di sebelah kanan memplot rasio put/call historis untuk instrumen ini.
Menggunakan Rasio Put/Call sebagai indikator sentimen investor mengatasi salah satu kekurangan utama dari penggunaan total kepemilikan institusional, yaitu sejumlah besar aset yang dikelola diinvestasikan secara pasif untuk melacak indeks. Dana yang dikelola secara pasif biasanya tidak membeli opsi, sehingga indikator rasio put/call lebih akurat dalam melacak sentimen dana yang dikelola secara aktif.
Pengajuan 13F dan NPORT
Detail pada pengajuan 13F tersedia gratis. Detail pada pengajuan NP memerlukan keanggotaan premium. Baris berwarna hijau menunjukkan posisi baru. Baris berwarna merah menunjukkan posisi yang sudah ditutup. Klik tautan ini ikon untuk melihat riwayat transaksi selengkapnya.
Tingkatkan
untuk membuka data premium dan mengekspor ke Excel ![]() .
.
| Tanggal File | Sumber | Investor | Ketik | Presyo ng Avg (Silangan) |
Saham | Δ Saham (%) |
Dilaporkan Nilai ($1000) |
Nilai Δ (%) |
Alokasi Port (%) |
|
|---|---|---|---|---|---|---|---|---|---|---|
| 2025-08-12 | 13F | Jpmorgan Chase & Co | 299 | 11 | ||||||
| 2025-07-07 | 13F | Nova Wealth Management, Inc. | 15 | 1 | ||||||
| 2025-07-28 | 13F | Harbour Investments, Inc. | 6,542 | 312.48 | 249 | 344.64 | ||||
| 2025-08-08 | 13F | Pnc Financial Services Group, Inc. | 92 | 0.00 | 4 | 0.00 | ||||
| 2025-08-14 | 13F/A | Barclays Plc | 683 | -34.83 | 0 | |||||
| 2025-05-12 | 13F | Sandy Spring Bank | 0 | -100.00 | 0 | |||||
| 2025-07-31 | 13F | Cambridge Investment Research Advisors, Inc. | 7,768 | 0 | ||||||
| 2025-08-07 | 13F | HighPoint Advisor Group LLC | 5,409 | 206 | ||||||
| 2025-08-08 | 13F | Avantax Advisory Services, Inc. | 0 | -100.00 | 0 | |||||
| 2025-08-11 | 13F | Private Advisor Group, LLC | 10,820 | -7.68 | 412 | -0.48 | ||||
| 2025-08-06 | 13F | Walkner Condon Financial Advisors LLC | 6,200 | 0.00 | 236 | 7.76 | ||||
| 2025-08-12 | 13F | Steward Partners Investment Advisory, Llc | 100 | 0.00 | 4 | 0.00 | ||||
| 2025-07-15 | 13F | Fifth Third Bancorp | 0 | -100.00 | 0 | |||||
| 2025-07-08 | 13F | Parallel Advisors, LLC | 10 | 0 | ||||||
| 2025-08-12 | 13F | Virtu Financial LLC | 0 | -100.00 | 0 | |||||
| 2025-07-14 | 13F | Toth Financial Advisory Corp | 40 | 2 | ||||||
| 2025-07-25 | 13F | Griffin Asset Management, Inc. | 6,780 | 0.00 | 258 | 7.95 | ||||
| 2025-08-18 | 13F/A | National Bank Of Canada /fi/ | 7 | 0.00 | 0 | |||||
| 2025-08-14 | 13F | Ancora Advisors, LLC | 150 | 6 | ||||||
| 2025-04-21 | 13F | PSI Advisors, LLC | 0 | -100.00 | 0 | |||||
| 2025-05-15 | 13F | Gordian Capital Singapore Pte Ltd | 0 | -100.00 | 0 | -100.00 | ||||
| 2025-08-14 | 13F | Jane Street Group, Llc | 15,868 | -40.58 | 604 | -36.08 | ||||
| 2025-08-07 | 13F | Montag A & Associates Inc | 0 | -100.00 | 0 | |||||
| 2025-09-04 | 13F/A | Advisor Group Holdings, Inc. | 6,230 | 5.38 | 237 | 13.40 | ||||
| 2025-05-13 | 13F | Intrepid Financial Planning Group LLC | 0 | -100.00 | 0 | |||||
| 2025-07-25 | 13F | Hazlett, Burt & Watson, Inc. | 3,900 | 44.44 | 0 | |||||
| 2025-08-15 | 13F | Morgan Stanley | 44,708 | -59.93 | 1,703 | -56.89 | ||||
| 2025-07-16 | 13F | Signaturefd, Llc | 510 | 0.00 | 19 | 5.56 | ||||
| 2025-05-14 | 13F | Credit Agricole S A | 2,600 | 92 | ||||||
| 2025-04-16 | 13F | Quintet Private Bank (Europe) S.A. | 0 | -100.00 | 0 | |||||
| 2025-07-24 | 13F | IFP Advisors, Inc | 0 | -100.00 | 0 | -100.00 | ||||
| 2025-05-13 | 13F | Adams Wealth Management | 0 | -100.00 | 0 | |||||
| 2025-08-06 | 13F | Commonwealth Equity Services, Llc | 58,497 | 8.52 | 2 | 100.00 | ||||
| 2025-07-18 | 13F | Bartlett & Co. Wealth Management Llc | 2,400 | 0.00 | 91 | 8.33 | ||||
| 2025-08-14 | 13F | Federation des caisses Desjardins du Quebec | 95 | -58.70 | 4 | -62.50 | ||||
| 2025-08-08 | 13F | Creative Planning | 7,405 | -11.91 | 282 | -5.05 | ||||
| 2025-08-14 | 13F | Stifel Financial Corp | 18,651 | 23.39 | 710 | 32.96 | ||||
| 2025-08-08 | 13F | Cetera Investment Advisers | 5,595 | -73.31 | 213 | -71.26 | ||||
| 2025-05-07 | 13F | Corton Capital Inc. | 0 | -100.00 | 0 | |||||
| 2025-04-16 | 13F | Twin Peaks Wealth Advisors, LLC | 0 | -100.00 | 0 | |||||
| 2025-07-25 | 13F | Cwm, Llc | 2,510 | 0.00 | 0 | |||||
| 2025-05-06 | 13F | Kovack Advisors, Inc. | 0 | -100.00 | 0 | |||||
| 2025-08-14 | 13F | Hrt Financial Lp | 0 | -100.00 | 0 | |||||
| 2025-08-19 | 13F | Anchor Investment Management, LLC | 640 | 0.00 | 24 | 9.09 | ||||
| 2025-08-11 | 13F | One Capital Management, LLC | 8,447 | 0.17 | 322 | 7.72 | ||||
| 2025-08-14 | 13F | Visionary Wealth Advisors | 6,267 | 239 | ||||||
| 2025-08-27 | NP | TIFF INVESTMENT PROGRAM - TIFF Multi-Asset Fund | 0 | -100.00 | 0 | -100.00 | ||||
| 2025-08-08 | 13F | SG Americas Securities, LLC | 0 | -100.00 | 0 | |||||
| 2025-08-13 | 13F | Cresset Asset Management, LLC | 5,803 | 221 | ||||||
| 2025-06-30 | NP | PSP - Invesco Global Listed Private Equity ETF This fund is a listed as child fund of Invesco Ltd. and if that institution has disclosed ownership in this security, then these positions will not be double counted when calculating total shares and total value | 18,826 | 69.27 | 698 | 14.80 | ||||
| 2025-07-29 | 13F | Tradewinds Capital Management, LLC | 25 | 0.00 | 1 | |||||
| 2025-08-12 | 13F | Global Retirement Partners, LLC | 380 | 347.06 | 14 | 180.00 | ||||
| 2025-08-15 | 13F | Tower Research Capital LLC (TRC) | 200 | 227.87 | 8 | 250.00 | ||||
| 2025-07-28 | 13F | WealthPlan Investment Management, LLC | 8,210 | 0.22 | 313 | 7.96 | ||||
| 2025-08-07 | 13F | Strategy Asset Managers Llc | 18,000 | 0.00 | 686 | 7.54 | ||||
| 2025-08-15 | 13F | Kestra Advisory Services, LLC | 25,017 | 53.52 | 953 | 65.28 | ||||
| 2025-05-15 | 13F | Balyasny Asset Management Llc | 0 | -100.00 | 0 | |||||
| 2025-07-21 | 13F | Ameritas Advisory Services, LLC | 90 | 3 | ||||||
| 2025-08-12 | 13F | Financial Advocates Investment Management | 9,959 | 2.86 | 379 | 10.82 | ||||
| 2025-08-14 | 13F | Bank Of America Corp /de/ | 1,350 | 35.00 | 51 | 45.71 | ||||
| 2025-08-12 | 13F | Proequities, Inc. | 0 | 0 | ||||||
| 2025-08-12 | 13F | CIBC Private Wealth Group, LLC | 25 | 1 | ||||||
| 2025-08-13 | 13F | Aristides Capital LLC | 0 | -100.00 | 0 | |||||
| 2025-08-14 | 13F | Royal Bank Of Canada | 750 | 1,400.00 | 28 | 1,300.00 | ||||
| 2025-08-13 | 13F | Mount Yale Investment Advisors, LLC | 193 | 7 | ||||||
| 2025-04-29 | 13F | Envestnet Asset Management Inc | 0 | -100.00 | 0 | |||||
| 2025-05-15 | 13F | Symmetry Investments LP | 0 | -100.00 | 0 | |||||
| 2025-05-13 | 13F | CacheTech Inc. | 0 | -100.00 | 0 | -100.00 | ||||
| 2025-08-08 | 13F | Hartland & Co., LLC | 102 | 4 | ||||||
| 2025-08-14 | 13F | Mariner, LLC | 16,954 | 182.52 | 646 | 204.25 | ||||
| 2025-08-06 | 13F | Wedbush Securities Inc | 15,295 | -9.34 | 1 | |||||
| 2025-08-14 | 13F | GWM Advisors LLC | 1,134 | 10.74 | 43 | 19.44 | ||||
| 2025-08-14 | 13F | Wells Fargo & Company/mn | 0 | -100.00 | 0 | |||||
| 2025-08-14 | 13F | Wiley Bros.-aintree Capital, Llc | 5,578 | 233 | ||||||
| 2025-07-15 | 13F | Evanson Asset Management, LLC | 15,000 | 0.00 | 571 | 7.74 | ||||
| 2025-08-11 | 13F | Strategic Wealth Partners, Ltd. | 20 | 1 | ||||||
| 2025-08-11 | 13F | TD Waterhouse Canada Inc. | 250 | 9 | ||||||
| 2025-08-13 | 13F | Invesco Ltd. | 18,021 | -9.20 | 686 | -2.28 | ||||
| 2025-08-14 | 13F | Raymond James Financial Inc | 1,235 | 47 | ||||||
| 2025-07-16 | 13F | ORG Partners LLC | 0 | -100.00 | 0 | |||||
| 2025-08-14 | 13F | UBS Group AG | 20,398 | 94.17 | 777 | 109.16 | ||||
| 2025-08-12 | 13F | LPL Financial LLC | 42,779 | 125.34 | 1,629 | 142.77 | ||||
| 2025-05-06 | 13F | Venturi Wealth Management, LLC | 0 | -100.00 | 0 | |||||
| 2025-04-07 | 13F | AdvisorNet Financial, Inc | 0 | -100.00 | 0 | -100.00 | ||||
| 2025-08-14 | 13F | Susquehanna International Group, Llp | 7,371 | 281 |