Mga Batayang Estadistika
| Pemilik Institusional | 94 total, 94 long only, 0 short only, 0 long/short - change of 2.15% MRQ |
| Alokasi Portofolio Rata-rata | 0.0927 % - change of -1.64% MRQ |
| Saham Institusional (Jangka Panjang) | 8,169,593 (ex 13D/G) - change of 0.60MM shares 7.95% MRQ |
| Nilai Institusional (Jangka Panjang) | $ 90,684 USD ($1000) |
Kepemilikan Institusional dan Pemegang Saham
Eaton Vance Senior Floating-Rate Trust (US:EFR) memiliki 94 pemilik institusional dan pemegang saham yang telah mengajukan formulir 13D/G atau 13F kepada Komisi Bursa Efek (Securities Exchange Commission/SEC). Lembaga-lembaga ini memegang total 8,169,593 saham. Pemegang saham terbesar meliputi Morgan Stanley, Bank Of America Corp /de/, Guggenheim Capital Llc, Invesco Ltd., Advisors Asset Management, Inc., Polar Asset Management Partners Inc., Wells Fargo & Company/mn, Ameriprise Financial Inc, White Pine Capital Llc, and Cambridge Investment Research Advisors, Inc. .
Struktur kepemilikan institusional Eaton Vance Senior Floating-Rate Trust (NYSE:EFR) menunjukkan posisi terkini di perusahaan oleh institusi dan dana, serta perubahan terbaru dalam ukuran posisi. Pemegang saham utama dapat mencakup investor individu, reksa dana, dana lindung nilai, atau institusi. Jadwal 13D menunjukkan bahwa investor memegang (atau pernah memegang) lebih dari 5% saham perusahaan dan bermaksud (atau pernah bermaksud) untuk secara aktif mengejar perubahan strategi bisnis. Jadwal 13G menunjukkan investasi pasif lebih dari 5%.
The share price as of September 5, 2025 is 11.63 / share. Previously, on September 9, 2024, the share price was 12.77 / share. This represents a decline of 8.93% over that period.

Skor Sentimen Dana
Skor Sentimen Dana (sebelumnya dikenal sebagai Skor Akumulasi Kepemilikan) menemukan saham-saham yang paling banyak dibeli oleh dana. Ini adalah hasil dari model kuantitatif multi-faktor yang canggih yang mengidentifikasi perusahaan dengan tingkat akumulasi institusional tertinggi. Model penilaian menggunakan kombinasi dari total peningkatan pemilik yang diungkapkan, perubahan dalam alokasi portofolio pada pemilik tersebut, dan metrik lainnya. Angka berkisar dari 0 hingga 100, dengan angka yang lebih tinggi menunjukkan tingkat akumulasi yang lebih tinggi dibandingkan dengan perusahaan sejenisnya, dan 50 adalah rata-ratanya.
Frekuensi Pembaruan: Setiap Hari
Lihat Ownership Explorer, yang menyediakan daftar perusahaan dengan peringkat tertinggi.
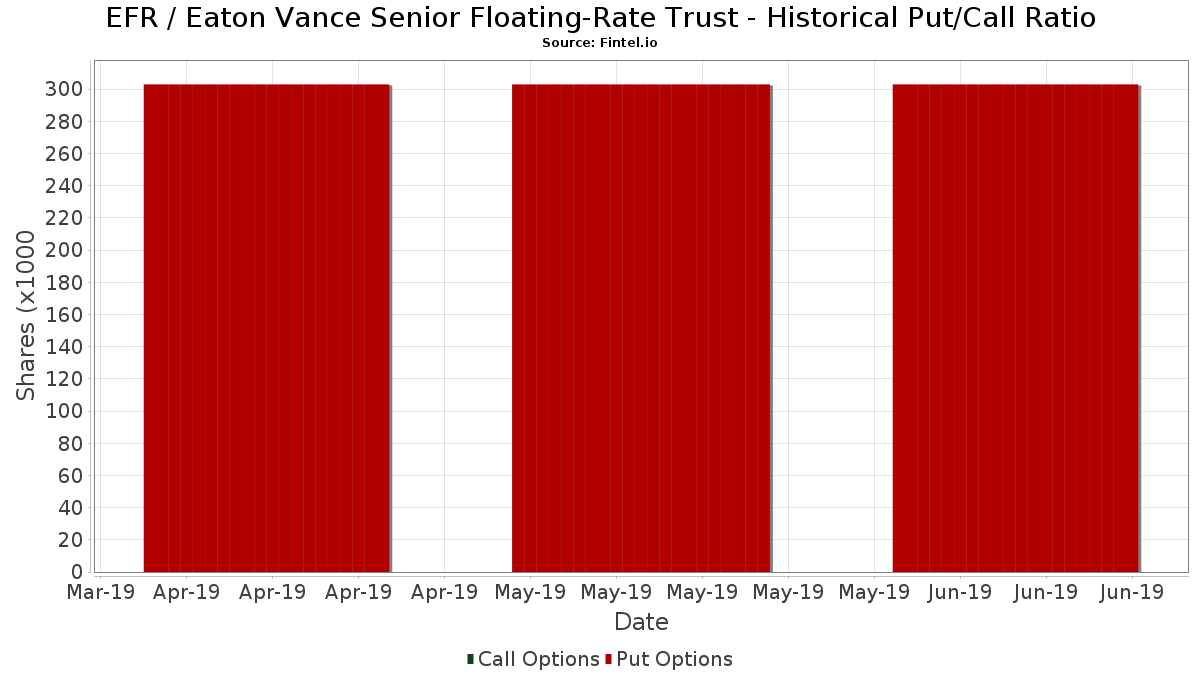
Rasio Put/Call Institusional
Selain melaporkan isu ekuitas dan utang standar, institusi dengan aset di bawah manajemen lebih dari 100 juta dolar AS juga harus mengungkapkan kepemilikan opsi put dan call mereka. Karena opsi put umumnya menunjukkan sentimen negatif, dan opsi call menunjukkan sentimen positif, kita dapat mengetahui sentimen institusional secara keseluruhan dengan memplot rasio put terhadap call. Grafik di sebelah kanan memplot rasio put/call historis untuk instrumen ini.
Menggunakan Rasio Put/Call sebagai indikator sentimen investor mengatasi salah satu kekurangan utama dari penggunaan total kepemilikan institusional, yaitu sejumlah besar aset yang dikelola diinvestasikan secara pasif untuk melacak indeks. Dana yang dikelola secara pasif biasanya tidak membeli opsi, sehingga indikator rasio put/call lebih akurat dalam melacak sentimen dana yang dikelola secara aktif.
Pengajuan 13F dan NPORT
Detail pada pengajuan 13F tersedia gratis. Detail pada pengajuan NP memerlukan keanggotaan premium. Baris berwarna hijau menunjukkan posisi baru. Baris berwarna merah menunjukkan posisi yang sudah ditutup. Klik tautan ini ikon untuk melihat riwayat transaksi selengkapnya.
Tingkatkan
untuk membuka data premium dan mengekspor ke Excel ![]() .
.
| Tanggal File | Sumber | Investor | Ketik | Presyo ng Avg (Silangan) |
Saham | Δ Saham (%) |
Dilaporkan Nilai ($1000) |
Nilai Δ (%) |
Alokasi Port (%) |
|
|---|---|---|---|---|---|---|---|---|---|---|
| 2025-09-04 | 13F/A | Advisor Group Holdings, Inc. | 37,966 | 38.12 | 460 | 36.90 | ||||
| 2025-07-29 | 13F | Salomon & Ludwin, LLC | 1,600 | 0.00 | 20 | 0.00 | ||||
| 2025-07-21 | 13F | Future Financial Wealth Managment LLC | 800 | 0.00 | 10 | 0.00 | ||||
| 2025-07-21 | 13F | Barrett & Company, Inc. | 2,000 | 0.00 | 24 | 0.00 | ||||
| 2025-08-14 | 13F | Comerica Bank | 5,500 | 83.33 | 67 | 83.33 | ||||
| 2025-07-10 | 13F | Piscataqua Savings Bank | 1,586 | 0.00 | 19 | 0.00 | ||||
| 2025-08-06 | 13F | Atlantic Union Bankshares Corp | 20,500 | 248 | ||||||
| 2025-08-07 | 13F | Altman Advisors, Inc. | 55,924 | 5.23 | 554 | 8.43 | ||||
| 2025-08-13 | 13F | Baird Financial Group, Inc. | 126,878 | 1,538 | ||||||
| 2025-08-14 | 13F | Beaird Harris Wealth Management, LLC | 34,919 | 43.76 | 423 | 42.42 | ||||
| 2025-04-30 | 13F | Stratos Wealth Partners, LTD. | 0 | -100.00 | 0 | |||||
| 2025-06-12 | 13F/A | Deutsche Bank Ag\ | 0 | -100.00 | 0 | |||||
| 2025-08-13 | 13F | Virtus Investment Advisers, Inc. | 65,479 | -14.92 | 794 | -15.82 | ||||
| 2025-08-06 | 13F | Commonwealth Equity Services, Llc | 11,309 | 0.48 | 0 | |||||
| 2025-05-14 | 13F | Orion Portfolio Solutions, LLC | 12,189 | 0.00 | 156 | 0.00 | ||||
| 2025-08-06 | 13F | Prospera Financial Services Inc | 18,739 | 7.28 | 227 | 6.57 | ||||
| 2025-08-11 | 13F | Private Advisor Group, LLC | 18,285 | 0.00 | 222 | -0.90 | ||||
| 2025-08-01 | 13F | Brinker Capital Investments, LLC | 0 | -100.00 | 0 | -100.00 | ||||
| 2025-07-09 | 13F | Sandy Cove Advisors, LLC | 26,248 | 0.12 | 318 | -0.93 | ||||
| 2025-07-31 | 13F | Cambridge Investment Research Advisors, Inc. | 320,881 | -30.41 | 4 | -40.00 | ||||
| 2025-08-14 | 13F | Polar Asset Management Partners Inc. | 423,654 | 5,135 | ||||||
| 2025-08-14 | 13F | Wells Fargo & Company/mn | 421,663 | -7.98 | 5,111 | -8.96 | ||||
| 2025-08-07 | 13F | WESCAP Management Group, Inc. | 24,303 | -35.36 | 295 | -36.09 | ||||
| 2025-07-21 | 13F | AEGON USA Investment Management, LLC | 14,765 | 179 | ||||||
| 2025-08-08 | 13F | Kane Investment Management, Inc. | 0 | -100.00 | 0 | |||||
| 2025-08-13 | 13F | Guggenheim Capital Llc | 547,365 | -14.54 | 6,634 | -15.45 | ||||
| 2025-07-25 | 13F | Cwm, Llc | 155 | 2.65 | 0 | |||||
| 2025-05-05 | 13F | Carnegie Lake Advisors LLC | 0 | -100.00 | 0 | |||||
| 2025-05-13 | 13F | SFI Advisors, LLC | 0 | -100.00 | 0 | |||||
| 2025-06-25 | NP | VPC - Virtus Private Credit Strategy ETF | 70,300 | 7.41 | 839 | -3.79 | ||||
| 2025-07-10 | 13F | Wealth Enhancement Advisory Services, Llc | 14,831 | 0.00 | 180 | -0.55 | ||||
| 2025-07-14 | 13F | GAMMA Investing LLC | 63 | 1 | ||||||
| 2025-08-14 | 13F | Colony Group, LLC | 14,533 | 1.88 | 176 | 1.15 | ||||
| 2025-08-13 | 13F | Invesco Ltd. | 534,797 | 26.65 | 6,482 | 25.31 | ||||
| 2025-08-14 | 13F | Balyasny Asset Management Llc | 10,508 | 127 | ||||||
| 2025-08-08 | 13F | Larson Financial Group LLC | 86 | 2.38 | 1 | 0.00 | ||||
| 2025-08-12 | 13F | Proequities, Inc. | 0 | 0 | ||||||
| 2025-08-06 | 13F | Adviser Investments LLC | 56,925 | -7.10 | 690 | -8.13 | ||||
| 2025-08-14 | 13F | Ameriprise Financial Inc | 392,383 | -3.05 | 4,756 | -4.08 | ||||
| 2025-08-05 | 13F | GPS Wealth Strategies Group, LLC | 550 | 0.00 | 7 | 0.00 | ||||
| 2025-08-11 | 13F | Shufro Rose & Co Llc | 25,700 | -3.75 | 315 | -3.98 | ||||
| 2025-08-06 | 13F | Ethos Financial Group, LLC | 245,137 | 1.39 | 2,971 | 0.34 | ||||
| 2025-08-14 | 13F | Cardiff Park Advisors, Llc | 19,883 | 0.00 | 241 | -1.23 | ||||
| 2025-08-14 | 13F | Stifel Financial Corp | 11,194 | -4.10 | 136 | -4.93 | ||||
| 2025-08-04 | 13F | Wolverine Asset Management Llc | 77,840 | 216.63 | 943 | 213.29 | ||||
| 2025-08-05 | 13F | Sigma Planning Corp | 14,295 | 0.68 | 173 | 0.00 | ||||
| 2025-08-27 | NP | RYMSX - Guggenheim Multi-Hedge Strategies Fund Class P | 155 | 2 | ||||||
| 2025-08-15 | 13F | Tower Research Capital LLC (TRC) | 1 | -85.71 | 0 | |||||
| 2025-08-13 | 13F | Northwestern Mutual Wealth Management Co | 181,169 | 4.93 | 2,196 | 3.78 | ||||
| 2025-05-14 | 13F | Virtus ETF Advisers LLC | 0 | -100.00 | 0 | |||||
| 2025-08-14 | 13F | Royal Bank Of Canada | 21,243 | 4.94 | 257 | 3.63 | ||||
| 2025-08-13 | 13F | Garner Asset Management Corp | 57,672 | -10.22 | 699 | -11.20 | ||||
| 2025-05-12 | 13F | Sandy Spring Bank | 20,500 | 0.00 | 251 | -4.20 | ||||
| 2025-07-29 | 13F | Koshinski Asset Management, Inc. | 0 | -100.00 | 0 | |||||
| 2025-08-12 | 13F | Advisors Asset Management, Inc. | 526,438 | 5.78 | 6,380 | 4.66 | ||||
| 2025-07-31 | 13F | Oppenheimer & Co Inc | 30,143 | 8.17 | 365 | 7.04 | ||||
| 2025-08-14 | 13F | Synovus Financial Corp | 10,702 | 0.00 | 130 | -1.53 | ||||
| 2025-08-12 | 13F | Horizon Kinetics Asset Management Llc | 27,801 | 0.00 | 337 | -1.18 | ||||
| 2025-08-28 | NP | Cohen & Steers Closed-end Opportunity Fund, Inc. | 182,258 | 5.81 | 2,209 | 4.64 | ||||
| 2025-07-08 | 13F | Ballew Advisors, Inc | 30,148 | -16.15 | 367 | -11.17 | ||||
| 2025-08-27 | NP | RYDEX VARIABLE TRUST - Multi-Hedge Strategies Fund Variable Annuity | 260 | 3 | ||||||
| 2025-08-18 | 13F | Tactive Advisors, LLC | 0 | -100.00 | 0 | |||||
| 2025-08-07 | 13F | Montag A & Associates Inc | 4,929 | 0.00 | 60 | -1.67 | ||||
| 2025-08-07 | 13F | Allworth Financial LP | 1,600 | 0.00 | 19 | 5.56 | ||||
| 2025-08-12 | 13F | Steward Partners Investment Advisory, Llc | 8,450 | 3.05 | 102 | 2.00 | ||||
| 2025-08-08 | 13F | Avantax Advisory Services, Inc. | 16,696 | -44.19 | 202 | -44.81 | ||||
| 2025-07-29 | 13F | JTC Employer Solutions Trusteee Ltd | 7,000 | 0.00 | 0 | |||||
| 2025-08-05 | 13F | Dunhill Financial, LLC | 5,780 | -14.75 | 70 | -15.66 | ||||
| 2025-07-25 | 13F | Concurrent Investment Advisors, LLC | 14,917 | 0.00 | 181 | -1.10 | ||||
| 2025-07-08 | 13F | Nbc Securities, Inc. | 2,075 | -12.63 | 0 | |||||
| 2025-08-14 | 13F | Wiley Bros.-aintree Capital, Llc | 12,012 | -1.85 | 146 | -2.68 | ||||
| 2025-08-07 | 13F | Hennion & Walsh Asset Management, Inc. | 64,881 | -1.67 | 786 | -2.72 | ||||
| 2025-05-09 | 13F | CoreCap Advisors, LLC | 0 | -100.00 | 0 | |||||
| 2025-08-11 | 13F | Elequin Capital Lp | 0 | -100.00 | 0 | |||||
| 2025-08-12 | 13F | Financial Advocates Investment Management | 0 | -100.00 | 0 | |||||
| 2025-08-15 | 13F | Morgan Stanley | 903,652 | 42.60 | 10,952 | 41.08 | ||||
| 2025-08-05 | 13F | Verity Asset Management, Inc. | 125,230 | -0.55 | 1,518 | -1.62 | ||||
| 2025-07-21 | 13F | Ameriflex Group, Inc. | 0 | -100.00 | 0 | |||||
| 2025-04-18 | 13F | Edge Financial Advisors LLC | 0 | -100.00 | 0 | |||||
| 2025-07-21 | 13F | Ameritas Advisory Services, LLC | 749 | 9 | ||||||
| 2025-05-05 | 13F | Hollencrest Capital Management | 0 | -100.00 | 0 | -100.00 | ||||
| 2025-08-05 | 13F | Aviance Capital Partners, LLC | 10,937 | 0.00 | 133 | -0.75 | ||||
| 2025-07-22 | 13F | Fortitude Advisory Group L.L.C. | 18,613 | 0.00 | 226 | 5.63 | ||||
| 2025-08-13 | 13F | Collar Capital Management, LLC | 128,645 | 2.96 | 1,559 | 1.90 | ||||
| 2025-07-15 | 13F | Oregon Pacific Wealth Management, LLC | 27,841 | -2.99 | 337 | -3.99 | ||||
| 2025-07-29 | 13F | Oxbow Advisors, LLC | 11,600 | -23.18 | 141 | -23.91 | ||||
| 2025-07-28 | 13F | Harbour Investments, Inc. | 1,732 | 0.00 | 21 | -4.76 | ||||
| 2025-07-24 | 13F | Us Bancorp \de\ | 1,500 | 0.00 | 18 | 0.00 | ||||
| 2025-08-18 | 13F/A | National Bank Of Canada /fi/ | 2,619 | -27.63 | 32 | -29.55 | ||||
| 2025-08-13 | 13F/A | StoneX Group Inc. | 10,460 | 114 | ||||||
| 2025-05-15 | 13F | Citadel Advisors Llc | 0 | -100.00 | 0 | |||||
| 2025-07-17 | 13F/A | Capital Investment Advisors, LLC | 49,263 | -5.62 | 597 | -6.57 | ||||
| 2025-08-14 | 13F | Susquehanna International Group, Llp | 0 | -100.00 | 0 | |||||
| 2025-08-13 | 13F | Cerity Partners LLC | 0 | -100.00 | 0 | |||||
| 2025-08-08 | 13F | Marble Harbor Investment Counsel, LLC | 38,500 | -9.69 | 467 | -10.73 | ||||
| 2025-07-28 | NP | PCEF - Invesco CEF Income Composite ETF This fund is a listed as child fund of Invesco Ltd. and if that institution has disclosed ownership in this security, then these positions will not be double counted when calculating total shares and total value | 254,608 | 3.28 | 3,048 | -4.33 | ||||
| 2025-08-08 | 13F | Cetera Investment Advisers | 10,733 | 130 | ||||||
| 2025-08-14 | 13F | Raymond James Financial Inc | 52,793 | 12.45 | 640 | 11.13 | ||||
| 2025-08-14 | 13F | Advisor OS, LLC | 0 | -100.00 | 0 | |||||
| 2025-08-14 | 13F | Cohen & Steers, Inc. | 317,902 | 3.25 | 4 | 0.00 | ||||
| 2025-08-14 | 13F | IHT Wealth Management, LLC | 10,490 | 0.00 | 127 | -0.78 | ||||
| 2025-08-01 | 13F | Envestnet Asset Management Inc | 10,702 | 0.00 | 130 | -1.53 | ||||
| 2025-08-06 | 13F | Wedbush Securities Inc | 14,040 | -26.66 | 0 | |||||
| 2025-07-09 | 13F | Fiduciary Alliance LLC | 70,845 | 859 | ||||||
| 2025-08-12 | 13F | LPL Financial LLC | 107,521 | -37.84 | 1,303 | -38.48 | ||||
| 2025-07-30 | 13F | Cullen/frost Bankers, Inc. | 10,000 | 0.00 | 121 | -0.82 | ||||
| 2025-08-14 | 13F | Bank Of America Corp /de/ | 774,558 | -7.85 | 9,388 | -8.84 | ||||
| 2025-08-14 | 13F | UBS Group AG | 52,900 | -2.79 | 641 | -3.75 | ||||
| 2025-08-05 | 13F | Huntington National Bank | 0 | |||||||
| 2025-08-12 | 13F | White Pine Capital Llc | 340,910 | -0.40 | 4,132 | -1.48 | ||||
| 2025-08-07 | 13F | Readystate Asset Management Lp | 55,411 | 109.91 | 672 | 107.74 | ||||
| 2025-08-15 | 13F | CI Private Wealth, LLC | 12,361 | -8.38 | 150 | -9.70 | ||||
| 2025-08-12 | 13F | MAI Capital Management | 25,726 | 1.47 | 312 | 0.32 | ||||
| 2025-04-16 | 13F | Union Bancaire Privee, UBP SA | 0 | -100.00 | 0 | |||||
| 2025-08-05 | 13F | Shaker Financial Services, LLC | 36,766 | 446 | ||||||
| 2025-08-08 | 13F | Calamos Advisors LLC | 26,031 | 315 | ||||||
| 2025-08-12 | 13F | J.w. Cole Advisors, Inc. | 0 | -100.00 | 0 |