Mga Batayang Estadistika
| Pemilik Institusional | 143 total, 143 long only, 0 short only, 0 long/short - change of 12.50% MRQ |
| Alokasi Portofolio Rata-rata | 0.2388 % - change of -8.89% MRQ |
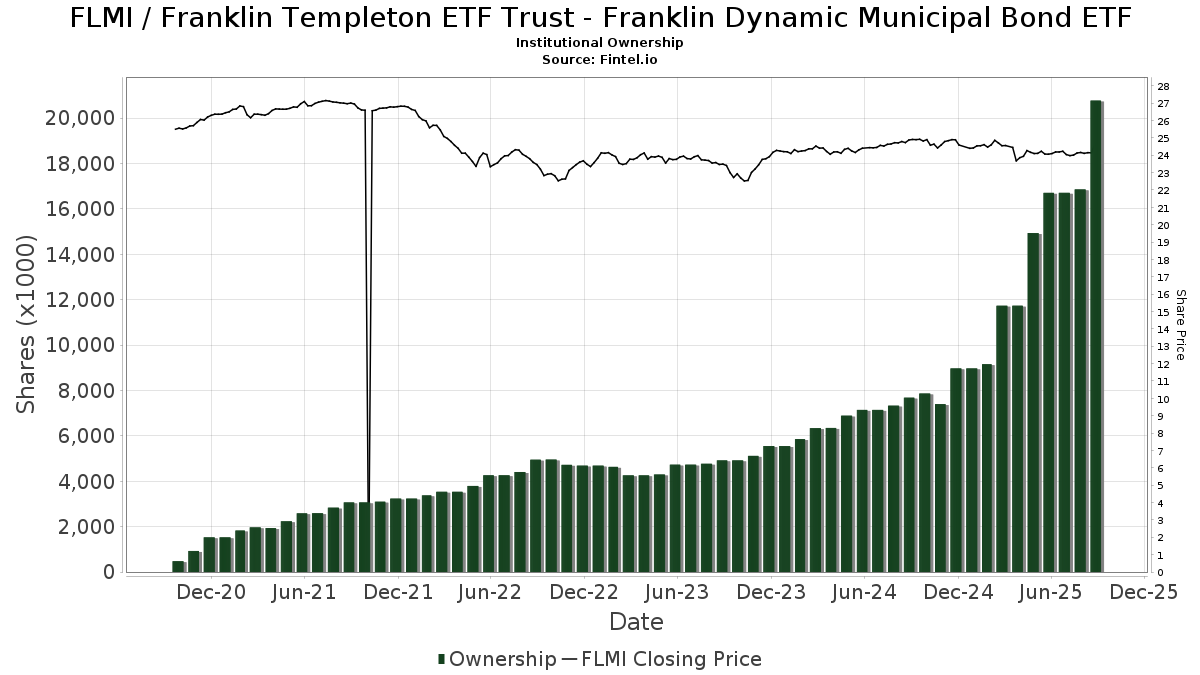
| Saham Institusional (Jangka Panjang) | 20,747,703 (ex 13D/G) - change of 4.04MM shares 24.17% MRQ |
| Nilai Institusional (Jangka Panjang) | $ 481,520 USD ($1000) |
Kepemilikan Institusional dan Pemegang Saham
Franklin Templeton ETF Trust - Franklin Dynamic Municipal Bond ETF (US:FLMI) memiliki 143 pemilik institusional dan pemegang saham yang telah mengajukan formulir 13D/G atau 13F kepada Komisi Bursa Efek (Securities Exchange Commission/SEC). Lembaga-lembaga ini memegang total 20,747,703 saham. Pemegang saham terbesar meliputi LPL Financial LLC, Cliftonlarsonallen Wealth Advisors, Llc, Meeder Advisory Services, Inc., Colony Group, LLC, Ameriprise Financial Inc, Raymond James Financial Inc, Central Bank & Trust Co, Cetera Investment Advisers, RFG Advisory, LLC, and Legacy CG, LLC .
Struktur kepemilikan institusional Franklin Templeton ETF Trust - Franklin Dynamic Municipal Bond ETF (ARCA:FLMI) menunjukkan posisi terkini di perusahaan oleh institusi dan dana, serta perubahan terbaru dalam ukuran posisi. Pemegang saham utama dapat mencakup investor individu, reksa dana, dana lindung nilai, atau institusi. Jadwal 13D menunjukkan bahwa investor memegang (atau pernah memegang) lebih dari 5% saham perusahaan dan bermaksud (atau pernah bermaksud) untuk secara aktif mengejar perubahan strategi bisnis. Jadwal 13G menunjukkan investasi pasif lebih dari 5%.
The share price as of September 5, 2025 is 24.37 / share. Previously, on September 9, 2024, the share price was 24.81 / share. This represents a decline of 1.77% over that period.
Skor Sentimen Dana
Skor Sentimen Dana (sebelumnya dikenal sebagai Skor Akumulasi Kepemilikan) menemukan saham-saham yang paling banyak dibeli oleh dana. Ini adalah hasil dari model kuantitatif multi-faktor yang canggih yang mengidentifikasi perusahaan dengan tingkat akumulasi institusional tertinggi. Model penilaian menggunakan kombinasi dari total peningkatan pemilik yang diungkapkan, perubahan dalam alokasi portofolio pada pemilik tersebut, dan metrik lainnya. Angka berkisar dari 0 hingga 100, dengan angka yang lebih tinggi menunjukkan tingkat akumulasi yang lebih tinggi dibandingkan dengan perusahaan sejenisnya, dan 50 adalah rata-ratanya.
Frekuensi Pembaruan: Setiap Hari
Lihat Ownership Explorer, yang menyediakan daftar perusahaan dengan peringkat tertinggi.
Rasio Put/Call Institusional
Selain melaporkan isu ekuitas dan utang standar, institusi dengan aset di bawah manajemen lebih dari 100 juta dolar AS juga harus mengungkapkan kepemilikan opsi put dan call mereka. Karena opsi put umumnya menunjukkan sentimen negatif, dan opsi call menunjukkan sentimen positif, kita dapat mengetahui sentimen institusional secara keseluruhan dengan memplot rasio put terhadap call. Grafik di sebelah kanan memplot rasio put/call historis untuk instrumen ini.
Menggunakan Rasio Put/Call sebagai indikator sentimen investor mengatasi salah satu kekurangan utama dari penggunaan total kepemilikan institusional, yaitu sejumlah besar aset yang dikelola diinvestasikan secara pasif untuk melacak indeks. Dana yang dikelola secara pasif biasanya tidak membeli opsi, sehingga indikator rasio put/call lebih akurat dalam melacak sentimen dana yang dikelola secara aktif.
Pengajuan 13F dan NPORT
Detail pada pengajuan 13F tersedia gratis. Detail pada pengajuan NP memerlukan keanggotaan premium. Baris berwarna hijau menunjukkan posisi baru. Baris berwarna merah menunjukkan posisi yang sudah ditutup. Klik tautan ini ikon untuk melihat riwayat transaksi selengkapnya.
Tingkatkan
untuk membuka data premium dan mengekspor ke Excel ![]() .
.
| Tanggal File | Sumber | Investor | Ketik | Presyo ng Avg (Silangan) |
Saham | Δ Saham (%) |
Dilaporkan Nilai ($1000) |
Nilai Δ (%) |
Alokasi Port (%) |
|
|---|---|---|---|---|---|---|---|---|---|---|
| 2025-08-14 | 13F | Jane Street Group, Llc | 112,339 | 148.10 | 2,725 | 146.38 | ||||
| 2025-08-28 | NP | STMYX - Sierra Tactical Municipal Fund Class Special Shares | 86,300 | -67.35 | 2,094 | -67.60 | ||||
| 2025-07-31 | 13F | Wright Fund Managment, LLC | 264,300 | 0.00 | 6,459 | 0.00 | ||||
| 2025-07-29 | 13F | International Assets Investment Management, Llc | 19,249 | -3.97 | 467 | -4.70 | ||||
| 2025-08-14 | 13F | Mml Investors Services, Llc | 30,625 | -60.65 | 1 | -100.00 | ||||
| 2025-07-07 | 13F | TruWealth Advisors, LLC | 220,265 | 2.39 | 5,344 | 1.64 | ||||
| 2025-08-14 | 13F | Colony Group, LLC | 1,309,758 | 1.70 | 31,775 | 0.95 | ||||
| 2025-08-07 | 13F | PFG Advisors | 8,652 | 1.00 | 210 | 0.00 | ||||
| 2025-08-05 | 13F | NewSquare Capital LLC | 12,870 | 2.79 | 312 | 1.96 | ||||
| 2025-07-10 | 13F | Secure Asset Management, LLC | 0 | -100.00 | 0 | |||||
| 2025-08-08 | 13F | Pnc Financial Services Group, Inc. | 14,637 | 58.67 | 355 | 57.78 | ||||
| 2025-07-24 | 13F | IFP Advisors, Inc | 12,201 | 104.34 | 296 | 104.14 | ||||
| 2025-08-12 | 13F | LPL Financial LLC | 2,896,998 | -6.08 | 70,281 | -6.77 | ||||
| 2025-07-28 | 13F | Harbour Investments, Inc. | 8,289 | -68.95 | 201 | -69.17 | ||||
| 2025-08-01 | 13F | Gwn Securities Inc. | 0 | -100.00 | 0 | |||||
| 2025-07-30 | 13F | D.a. Davidson & Co. | 18,354 | 27.87 | 445 | 27.14 | ||||
| 2025-08-12 | 13F | MAI Capital Management | 746 | 18 | ||||||
| 2025-08-11 | 13F | HighTower Advisors, LLC | 9,157 | -95.69 | 222 | -95.73 | ||||
| 2025-08-08 | 13F | Meridian Wealth Management, LLC | 38,451 | 933 | ||||||
| 2025-08-14 | 13F | Susquehanna International Group, Llp | 10,571 | 256 | ||||||
| 2025-07-25 | 13F | Landmark Wealth Management, LLC | 35,818 | -10.90 | 1 | |||||
| 2025-07-09 | 13F | Summit Financial Consulting LLC | 26,487 | 10.67 | 643 | 9.93 | ||||
| 2025-08-06 | 13F | AE Wealth Management LLC | 13,032 | 47.09 | 316 | 46.30 | ||||
| 2025-08-14 | 13F | Abound Financial, Llc | 110,361 | -2.02 | 2,677 | -2.73 | ||||
| 2025-08-06 | 13F | Commonwealth Equity Services, Llc | 162,092 | -0.19 | 4 | 0.00 | ||||
| 2025-07-25 | NP | FGTHX - Franklin Templeton SMACS: Series H Advisor Class | 17,000 | 0.00 | 411 | -2.84 | ||||
| 2025-08-14 | 13F | Certified Advisory Corp | 0 | -100.00 | 0 | |||||
| 2025-07-28 | 13F | SFG Wealth Management, LLC. | 0 | -100.00 | 0 | |||||
| 2025-08-08 | 13F | Creative Planning | 16,593 | -8.42 | 403 | -9.05 | ||||
| 2025-08-13 | 13F | Jones Financial Companies Lllp | 119,629 | 151.44 | 2,896 | 149.87 | ||||
| 2025-07-16 | 13F | Perigon Wealth Management, LLC | 12,500 | 303 | ||||||
| 2025-08-05 | 13F | GPS Wealth Strategies Group, LLC | 102 | 0.99 | 2 | 0.00 | ||||
| 2025-07-10 | 13F | Redhawk Wealth Advisors, Inc. | 27,245 | -66.25 | 661 | -66.53 | ||||
| 2025-08-14 | 13F | Visionary Wealth Advisors | 0 | -100.00 | 0 | |||||
| 2025-07-21 | 13F | Cliftonlarsonallen Wealth Advisors, Llc | 2,166,091 | 5.17 | 52,549 | 4.39 | ||||
| 2025-08-14 | 13F | Stifel Financial Corp | 64,770 | 73.65 | 1,571 | 72.45 | ||||
| 2025-05-15 | 13F/A | Morgan Stanley | 0 | -100.00 | 0 | |||||
| 2025-08-01 | 13F | Brookwood Investment Group LLC | 0 | -100.00 | 0 | |||||
| 2025-08-08 | 13F | Phoenix Wealth Advisors | 12,000 | 291 | ||||||
| 2025-08-04 | 13F | Leeward Financial Partners, LLC | 69,889 | 5.28 | 1,695 | 4.50 | ||||
| 2025-08-12 | 13F | Global Retirement Partners, LLC | 33,928 | 823 | ||||||
| 2025-08-12 | 13F | BlueStem Wealth Partners, LLC | 317,478 | -24.34 | 7,702 | -24.90 | ||||
| 2025-07-29 | 13F | AssuredPartners Investment Advisors, LLC | 15,346 | 372 | ||||||
| 2025-07-16 | 13F | Essex Financial Services, Inc. | 23,055 | -2.50 | 559 | -3.12 | ||||
| 2025-07-22 | 13F | DAVENPORT & Co LLC | 8,253 | 200 | ||||||
| 2025-08-13 | 13F | VestGen Advisors, LLC | 195,667 | 0.51 | 4,747 | -0.23 | ||||
| 2025-08-14 | 13F | Evergreen Wealth Solutions, LLC | 29,850 | 145.68 | 724 | 144.59 | ||||
| 2025-08-12 | 13F | Park Square Financial Group, LLC | 200 | 0.00 | 5 | 0.00 | ||||
| 2025-08-11 | 13F | Cornerstone Planning Group LLC | 907 | 1.11 | 22 | 0.00 | ||||
| 2025-07-22 | 13F | Legacy CG, LLC | 471,991 | -3.30 | 11,451 | -4.02 | ||||
| 2025-08-19 | 13F | Advisory Services Network, LLC | 11,996 | 288 | ||||||
| 2025-08-01 | 13F | Envestnet Asset Management Inc | 156,059 | -25.18 | 3,786 | -25.74 | ||||
| 2025-08-04 | 13F | Creekmur Asset Management LLC | 2,177 | 0.00 | 53 | -1.89 | ||||
| 2025-08-11 | 13F | Pineridge Advisors LLC | 3,582 | -9.41 | 87 | -10.42 | ||||
| 2025-08-13 | 13F | Continuum Advisory, LLC | 9,300 | 226 | ||||||
| 2025-07-29 | 13F | Crux Wealth Advisors | 14,076 | 1.10 | 341 | 0.29 | ||||
| 2025-08-14 | 13F | Raymond James Financial Inc | 826,544 | 38.22 | 20,052 | 37.20 | ||||
| 2025-04-23 | 13F | Sabal Trust CO | 44,410 | 1,085 | ||||||
| 2025-08-11 | 13F | Inspire Advisors, LLC | 8,851 | 0.00 | 215 | -0.93 | ||||
| 2025-08-14 | 13F | Acorn Wealth Advisors, LLC | 9,129 | -13.58 | 221 | -14.34 | ||||
| 2025-08-07 | 13F | Meeder Advisory Services, Inc. | 1,593,429 | 38,657 | ||||||
| 2025-08-12 | 13F | Proequities, Inc. | 0 | 0 | ||||||
| 2025-07-25 | 13F | Cwm, Llc | 116,827 | 29.08 | 3 | 0.00 | ||||
| 2025-08-19 | 13F | Anchor Investment Management, LLC | 0 | -100.00 | 0 | |||||
| 2025-08-06 | 13F | Golden State Wealth Management, LLC | 34,892 | 4.36 | 846 | 3.55 | ||||
| 2025-08-13 | 13F | Per Stirling Capital Management, LLC. | 21,590 | 117.09 | 524 | 115.23 | ||||
| 2025-08-06 | 13F | SOUTH STATE Corp | 4,532 | 31.21 | 110 | 29.76 | ||||
| 2025-08-14 | 13F | Benjamin Edwards Inc | 15,057 | 365 | ||||||
| 2025-08-12 | 13F | CIBC Private Wealth Group, LLC | 0 | 0 | ||||||
| 2025-07-28 | 13F | RFG Advisory, LLC | 555,398 | -0.77 | 13,474 | -1.51 | ||||
| 2025-08-12 | 13F | Steward Partners Investment Advisory, Llc | 117,720 | 26.38 | 2,856 | 25.44 | ||||
| 2025-08-14 | 13F | Ameriprise Financial Inc | 1,060,685 | 41.25 | 25,683 | 39.91 | ||||
| 2025-08-14 | 13F | GWM Advisors LLC | 97,976 | 2,289.66 | 2,377 | 2,276.00 | ||||
| 2025-05-13 | 13F | EverSource Wealth Advisors, LLC | 0 | -100.00 | 0 | |||||
| 2025-07-16 | 13F | Magnus Financial Group LLC | 0 | -100.00 | 0 | |||||
| 2025-07-29 | 13F | Members Advisory Group LLC | 11,352 | 32.96 | 275 | 32.21 | ||||
| 2025-07-24 | 13F | Forefront Analytics, LLC | 72,109 | 1,749 | ||||||
| 2025-08-13 | 13F | Flow Traders U.s. Llc | 0 | -100.00 | 0 | |||||
| 2025-08-12 | 13F | Wayfinding Financial, LLC | 80,348 | 71.74 | 2 | 0.00 | ||||
| 2025-05-12 | 13F | Independent Advisor Alliance | 0 | -100.00 | 0 | |||||
| 2025-07-29 | 13F | Latitude Advisors, LLC | 10,768 | 0.89 | 261 | 0.38 | ||||
| 2025-08-15 | 13F | First Heartland Consultants, Inc. | 15,309 | 371 | ||||||
| 2025-08-08 | 13F | Croban | 72,109 | 5.81 | 1,749 | 5.05 | ||||
| 2025-07-17 | 13F | Asio Capital, LLC | 243,270 | 5,902 | ||||||
| 2025-07-25 | 13F | Atria Wealth Solutions, Inc. | 24,886 | 111.06 | 603 | 109.38 | ||||
| 2025-07-07 | 13F | Wealth Alliance Advisory Group, LLC | 172,559 | 2.28 | 4,186 | 1.53 | ||||
| 2025-07-30 | 13F | Cullen/frost Bankers, Inc. | 15,403 | 16.37 | 374 | 15.48 | ||||
| 2025-08-08 | 13F | Crossmark Global Holdings, Inc. | 8,766 | -0.65 | 213 | -1.40 | ||||
| 2025-08-15 | 13F | Captrust Financial Advisors | 48,240 | -32.13 | 1,170 | -32.64 | ||||
| 2025-08-08 | 13F | Avantax Advisory Services, Inc. | 14,917 | 362 | ||||||
| 2025-07-29 | 13F | Private Trust Co Na | 18,142 | -0.87 | 440 | -1.57 | ||||
| 2025-07-25 | 13F | Bill Few Associates, Inc. | 15,302 | 0.00 | 371 | -0.54 | ||||
| 2025-08-07 | 13F | New England Private Wealth Advisors LLC | 82,230 | 1,974 | ||||||
| 2025-08-01 | 13F | Cedar Point Capital Partners, LLC | 37,765 | -3.31 | 916 | -3.98 | ||||
| 2025-08-14 | 13F | Mariner, LLC | 189,085 | 0.66 | 4,587 | -0.07 | ||||
| 2025-08-01 | 13F | American Financial & Tax Strategies Inc | 135,503 | 0.86 | 3,287 | 0.12 | ||||
| 2025-08-14 | 13F | Great Valley Advisor Group, Inc. | 18,545 | 33.49 | 450 | 32.45 | ||||
| 2025-07-14 | 13F | AdvisorNet Financial, Inc | 24,880 | 4,046.67 | 604 | 4,207.14 | ||||
| 2025-07-09 | 13F | Central Bank & Trust Co | 741,931 | 0.29 | 17,999 | -0.45 | ||||
| 2025-07-28 | 13F | Axxcess Wealth Management, Llc | 32,705 | 793 | ||||||
| 2025-08-05 | 13F | Bank of New York Mellon Corp | 278,032 | 5.57 | 6,745 | 4.80 | ||||
| 2025-08-04 | 13F | Econ Financial Services Corp | 26,622 | -10.26 | 646 | -11.03 | ||||
| 2025-07-03 | 13F | TrueWealth Advisors, LLC | 21,618 | -7.92 | 524 | -8.55 | ||||
| 2025-07-31 | 13F | Hanlon Investment Management, Inc. | 0 | -100.00 | 0 | |||||
| 2025-08-14 | 13F | Boothbay Fund Management, Llc | 50,000 | 1,213 | ||||||
| 2025-08-12 | 13F | Jpmorgan Chase & Co | 199,428 | -5.27 | 4,838 | -5.97 | ||||
| 2025-07-29 | 13F | Stratos Wealth Advisors, LLC | 83,324 | 4.75 | 2,021 | 3.96 | ||||
| 2025-08-14 | 13F | Integrated Wealth Concepts LLC | 21,748 | -34.67 | 528 | -35.18 | ||||
| 2025-08-14 | 13F | Wells Fargo & Company/mn | 419,902 | 1,012.06 | 10,187 | 1,004.77 | ||||
| 2025-08-27 | 13F/A | Brinker Capital Investments, LLC | 413,451 | 1,039.58 | 10,030 | 1,032.05 | ||||
| 2025-07-28 | 13F | BRYN MAWR TRUST Co | 18,657 | 453 | ||||||
| 2025-07-16 | 13F | Embree Financial Group | 27,158 | -5.03 | 659 | -5.73 | ||||
| 2025-08-18 | 13F | Geneos Wealth Management Inc. | 3,071 | -24.56 | 75 | -25.25 | ||||
| 2025-08-12 | 13F | Gladstone Institutional Advisory LLC | 31,266 | -27.33 | 759 | -27.88 | ||||
| 2025-08-15 | 13F | Equitable Holdings, Inc. | 58,791 | 70.72 | 1,426 | 69.56 | ||||
| 2025-08-18 | 13F/A | National Bank Of Canada /fi/ | 24,000 | 2,300.00 | 582 | 2,325.00 | ||||
| 2025-08-04 | 13F | Assetmark, Inc | 2,464 | 60 | ||||||
| 2025-08-12 | 13F | Financial Advocates Investment Management | 47,743 | -41.11 | 1,158 | -41.54 | ||||
| 2025-08-05 | 13F | Sigma Planning Corp | 16,617 | 74.71 | 403 | 73.71 | ||||
| 2025-07-11 | 13F | Mallini Complete Financial Planning LLC | 14,994 | 1.09 | 364 | 0.28 | ||||
| 2025-08-04 | 13F | Atria Investments Llc | 12,582 | -1.49 | 305 | -2.24 | ||||
| 2025-08-08 | 13F | Collaborative Wealth Managment Inc. | 33,796 | 8.78 | 820 | 7.91 | ||||
| 2025-07-22 | 13F | Wealthcare Advisory Partners LLC | 26,060 | 632 | ||||||
| 2025-07-25 | 13F | One Degree Advisors Inc | 96,988 | 26.34 | 2 | 100.00 | ||||
| 2025-07-17 | 13F | Janney Montgomery Scott LLC | 65,657 | 20.30 | 2 | 0.00 | ||||
| 2025-05-15 | 13F/A | Orion Portfolio Solutions, LLC | 36,281 | -16.17 | 887 | -16.18 | ||||
| 2025-08-13 | 13F | Capital Analysts, Inc. | 500 | 0.00 | 0 | |||||
| 2025-09-04 | 13F/A | Advisor Group Holdings, Inc. | 383,845 | 191.98 | 9,312 | 189.82 | ||||
| 2025-07-21 | 13F | Patriot Financial Group Insurance Agency, LLC | 84,392 | 2.98 | 2,047 | 2.25 | ||||
| 2025-08-14 | 13F | Hancock Whitney Corp | 93,847 | 2,277 | ||||||
| 2025-08-12 | 13F | Franklin Resources Inc | 43,795 | 135.19 | 1,062 | 133.41 | ||||
| 2025-08-15 | 13F | Kestra Advisory Services, LLC | 68,997 | 21.42 | 1,674 | 20.53 | ||||
| 2025-07-30 | 13F | Retirement Planning Group | 79,144 | 316.90 | 1,920 | 314.69 | ||||
| 2025-07-31 | 13F | Oppenheimer & Co Inc | 10,075 | 244 | ||||||
| 2025-08-11 | 13F | Private Advisor Group, LLC | 132,258 | 59.65 | 3,209 | 58.50 | ||||
| 2025-08-12 | 13F | Ameritas Investment Partners, Inc. | 3,419 | 8.61 | 83 | 7.89 | ||||
| 2025-07-29 | 13F | ShoreHaven Wealth Partners, LLC | 105,094 | -17.14 | 2,550 | -17.75 | ||||
| 2025-07-14 | 13F | Narus Financial Partners, LLC | 9,034 | 219 | ||||||
| 2025-08-07 | 13F | Kestra Private Wealth Services, Llc | 313,300 | 5.83 | 7,601 | 5.04 | ||||
| 2025-08-08 | 13F | Cetera Investment Advisers | 679,327 | 227.70 | 16,480 | 225.31 | ||||
| 2025-08-14 | 13F | Comerica Bank | 3,120 | 0.00 | 76 | -1.32 | ||||
| 2025-07-09 | 13F | Bowman & Co S.C. | 55,546 | 4.07 | 1,348 | 3.30 | ||||
| 2025-07-16 | 13F | ORG Partners LLC | 0 | -100.00 | 0 | |||||
| 2025-08-14 | 13F | Glenview Trust Co | 0 | -100.00 | 0 | |||||
| 2025-08-14 | 13F | Royal Bank Of Canada | 11,985 | 2.21 | 291 | 1.39 | ||||
| 2025-08-14 | 13F | Wiley Bros.-aintree Capital, Llc | 25,399 | 32.53 | 616 | 31.91 | ||||
| 2025-07-09 | 13F | Massmutual Trust Co Fsb/adv | 29,747 | -25.21 | 722 | -25.82 | ||||
| 2025-08-12 | 13F | Wulff, Hansen & Co. | 41,187 | 0.00 | 999 | -0.70 | ||||
| 2025-08-13 | 13F | Congress Wealth Management LLC / DE / | 13,943 | 338 | ||||||
| 2025-07-21 | 13F | Ameritas Advisory Services, LLC | 1,253 | 30 | ||||||
| 2025-07-24 | 13F | Us Bancorp \de\ | 0 | -100.00 | 0 | |||||
| 2025-07-14 | 13F | GAMMA Investing LLC | 8,786 | -85.03 | 213 | -85.15 | ||||
| 2025-07-18 | 13F | Truist Financial Corp | 62,084 | 56.06 | 1,506 | 54.94 | ||||
| 2025-07-31 | 13F | Cambridge Investment Research Advisors, Inc. | 150,844 | 8.07 | 4 | 0.00 | ||||
| 2025-08-06 | 13F | Prospera Financial Services Inc | 17,888 | 43.86 | 434 | 42.90 | ||||
| 2025-08-14 | 13F | Integrity Wealth Advisors, Inc. | 18,553 | -2.49 | 450 | -3.02 | ||||
| 2025-08-12 | 13F | J.w. Cole Advisors, Inc. | 15,907 | 386 | ||||||
| 2025-08-14 | 13F | Diversify Advisory Services, LLC | 81,990 | 1,982 | ||||||
| 2025-07-31 | 13F | Prentice Wealth Management LLC | 186,349 | 44.96 | 4,521 | 43.90 | ||||
| 2025-08-11 | 13F | Principal Securities, Inc. | 14,894 | 4,155.43 | 361 | 4,412.50 | ||||
| 2025-08-26 | 13F/A | Thrivent Financial For Lutherans | 156,551 | 4 |