Mga Batayang Estadistika
| Pemilik Institusional | 101 total, 101 long only, 0 short only, 0 long/short - change of 9.68% MRQ |
| Alokasi Portofolio Rata-rata | 0.1184 % - change of -1.63% MRQ |
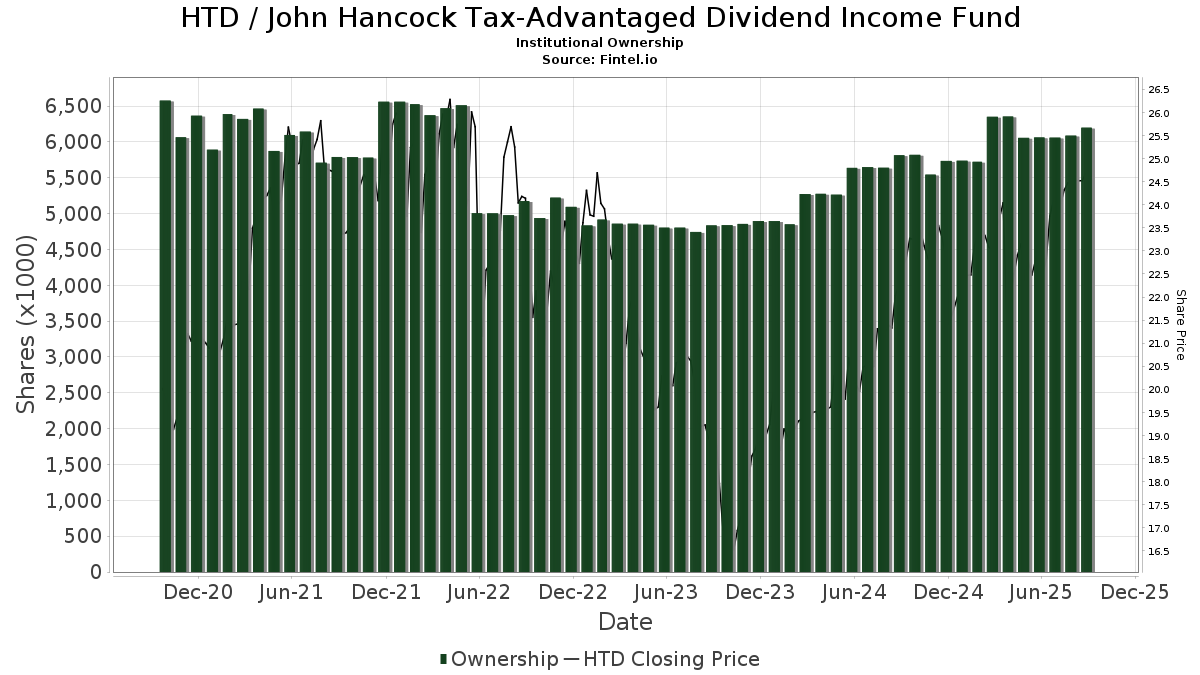
| Saham Institusional (Jangka Panjang) | 6,189,553 (ex 13D/G) - change of 0.13MM shares 2.06% MRQ |
| Nilai Institusional (Jangka Panjang) | $ 138,735 USD ($1000) |
Kepemilikan Institusional dan Pemegang Saham
John Hancock Tax-Advantaged Dividend Income Fund (US:HTD) memiliki 101 pemilik institusional dan pemegang saham yang telah mengajukan formulir 13D/G atau 13F kepada Komisi Bursa Efek (Securities Exchange Commission/SEC). Lembaga-lembaga ini memegang total 6,189,553 saham. Pemegang saham terbesar meliputi UBS Group AG, Invesco Ltd., PCEF - Invesco CEF Income Composite ETF, Captrust Financial Advisors, Morgan Stanley, Guggenheim Capital Llc, Raymond James Financial Inc, Bank Of America Corp /de/, LPL Financial LLC, and Wells Fargo & Company/mn .
Struktur kepemilikan institusional John Hancock Tax-Advantaged Dividend Income Fund (NYSE:HTD) menunjukkan posisi terkini di perusahaan oleh institusi dan dana, serta perubahan terbaru dalam ukuran posisi. Pemegang saham utama dapat mencakup investor individu, reksa dana, dana lindung nilai, atau institusi. Jadwal 13D menunjukkan bahwa investor memegang (atau pernah memegang) lebih dari 5% saham perusahaan dan bermaksud (atau pernah bermaksud) untuk secara aktif mengejar perubahan strategi bisnis. Jadwal 13G menunjukkan investasi pasif lebih dari 5%.
The share price as of September 5, 2025 is 24.50 / share. Previously, on September 6, 2024, the share price was 21.99 / share. This represents an increase of 11.41% over that period.
Skor Sentimen Dana
Skor Sentimen Dana (sebelumnya dikenal sebagai Skor Akumulasi Kepemilikan) menemukan saham-saham yang paling banyak dibeli oleh dana. Ini adalah hasil dari model kuantitatif multi-faktor yang canggih yang mengidentifikasi perusahaan dengan tingkat akumulasi institusional tertinggi. Model penilaian menggunakan kombinasi dari total peningkatan pemilik yang diungkapkan, perubahan dalam alokasi portofolio pada pemilik tersebut, dan metrik lainnya. Angka berkisar dari 0 hingga 100, dengan angka yang lebih tinggi menunjukkan tingkat akumulasi yang lebih tinggi dibandingkan dengan perusahaan sejenisnya, dan 50 adalah rata-ratanya.
Frekuensi Pembaruan: Setiap Hari
Lihat Ownership Explorer, yang menyediakan daftar perusahaan dengan peringkat tertinggi.
Rasio Put/Call Institusional
Selain melaporkan isu ekuitas dan utang standar, institusi dengan aset di bawah manajemen lebih dari 100 juta dolar AS juga harus mengungkapkan kepemilikan opsi put dan call mereka. Karena opsi put umumnya menunjukkan sentimen negatif, dan opsi call menunjukkan sentimen positif, kita dapat mengetahui sentimen institusional secara keseluruhan dengan memplot rasio put terhadap call. Grafik di sebelah kanan memplot rasio put/call historis untuk instrumen ini.
Menggunakan Rasio Put/Call sebagai indikator sentimen investor mengatasi salah satu kekurangan utama dari penggunaan total kepemilikan institusional, yaitu sejumlah besar aset yang dikelola diinvestasikan secara pasif untuk melacak indeks. Dana yang dikelola secara pasif biasanya tidak membeli opsi, sehingga indikator rasio put/call lebih akurat dalam melacak sentimen dana yang dikelola secara aktif.
Pengajuan 13F dan NPORT
Detail pada pengajuan 13F tersedia gratis. Detail pada pengajuan NP memerlukan keanggotaan premium. Baris berwarna hijau menunjukkan posisi baru. Baris berwarna merah menunjukkan posisi yang sudah ditutup. Klik tautan ini ikon untuk melihat riwayat transaksi selengkapnya.
Tingkatkan
untuk membuka data premium dan mengekspor ke Excel ![]() .
.
| Tanggal File | Sumber | Investor | Ketik | Presyo ng Avg (Silangan) |
Saham | Δ Saham (%) |
Dilaporkan Nilai ($1000) |
Nilai Δ (%) |
Alokasi Port (%) |
|
|---|---|---|---|---|---|---|---|---|---|---|
| 2025-08-08 | 13F | Cornerstone Advisors, LLC | 10,292 | 241 | ||||||
| 2025-07-08 | 13F | Nbc Securities, Inc. | 4,025 | 0.00 | 0 | |||||
| 2025-07-11 | 13F | Seacrest Wealth Management, Llc | 0 | -100.00 | 0 | |||||
| 2025-07-17 | 13F | Presper Financial Architects, LLC | 27,574 | 1 | ||||||
| 2025-08-01 | 13F | Envestnet Asset Management Inc | 20,014 | -11.60 | 468 | -13.49 | ||||
| 2025-07-11 | 13F | Farther Finance Advisors, LLC | 150 | 4 | ||||||
| 2025-07-21 | 13F | Ameriflex Group, Inc. | 500 | 0.00 | 11 | 0.00 | ||||
| 2025-08-14 | 13F | UBS Group AG | 717,942 | -0.79 | 16,793 | -3.03 | ||||
| 2025-07-29 | 13F | Private Trust Co Na | 2,000 | 0.00 | 47 | -2.13 | ||||
| 2025-08-27 | NP | RYDEX VARIABLE TRUST - Multi-Hedge Strategies Fund Variable Annuity | 135 | -19.16 | 3 | 0.00 | ||||
| 2025-08-07 | 13F | Allworth Financial LP | 2,303 | 1.19 | 54 | 3.92 | ||||
| 2025-08-04 | 13F | Wolverine Asset Management Llc | 8,036 | 188 | ||||||
| 2025-08-14 | 13F | Comerica Bank | 3,700 | -13.95 | 87 | -15.69 | ||||
| 2025-08-14 | 13F | Cnh Partners Llc | 119,615 | -24.38 | 2,798 | -25.91 | ||||
| 2025-08-19 | 13F | Newbridge Financial Services Group, Inc. | 96,535 | 2,258 | ||||||
| 2025-08-14 | 13F | Stifel Financial Corp | 127,526 | -0.86 | 2,983 | -3.12 | ||||
| 2025-08-08 | 13F | Avalon Trust Co | 897 | 21 | ||||||
| 2025-08-08 | 13F | Calamos Advisors LLC | 22,448 | -8.00 | 525 | -9.95 | ||||
| 2025-08-13 | 13F | Lido Advisors, LLC | 17,567 | 0.00 | 411 | -2.38 | ||||
| 2025-04-08 | 13F | Parallel Advisors, LLC | 0 | -100.00 | 0 | |||||
| 2025-05-08 | 13F | Endeavor Private Wealth, Inc. | 0 | -100.00 | 0 | |||||
| 2025-07-08 | 13F | Morris Retirement Advisors, LLC | 28,208 | -1.96 | 660 | -4.22 | ||||
| 2025-08-06 | 13F | Founders Financial Securities Llc | 18,915 | 0.00 | 442 | 3.27 | ||||
| 2025-08-13 | 13F | Walleye Capital LLC | 27,100 | 11.71 | 634 | 9.14 | ||||
| 2025-08-08 | 13F | Avantax Advisory Services, Inc. | 12,295 | -2.41 | 288 | -4.65 | ||||
| 2025-07-18 | 13F | PFG Investments, LLC | 14,960 | 24.12 | 350 | 21.18 | ||||
| 2025-08-04 | 13F | Live Oak Private Wealth LLC | 102,602 | 0.00 | 2,400 | -2.28 | ||||
| 2025-07-25 | 13F | Concord Wealth Partners | 83 | 0.00 | 2 | 0.00 | ||||
| 2025-08-22 | NP | Cornerstone Total Return Fund Inc | 6,589 | -40.61 | 154 | -31.25 | ||||
| 2025-04-29 | 13F | Truist Financial Corp | 0 | -100.00 | 0 | |||||
| 2025-08-14 | 13F | Royal Bank Of Canada | 159,735 | -3.56 | 3,736 | -5.75 | ||||
| 2025-07-28 | 13F | Mutual Advisors, LLC | 24,362 | 1.60 | 589 | 8.47 | ||||
| 2025-08-14 | 13F | McIlrath & Eck, LLC | 500 | 0.00 | 12 | 0.00 | ||||
| 2025-08-14 | 13F | Wells Fargo & Company/mn | 270,810 | -2.87 | 6,334 | -5.07 | ||||
| 2025-08-12 | 13F | Proequities, Inc. | 0 | 0 | ||||||
| 2025-07-28 | NP | PCEF - Invesco CEF Income Composite ETF This fund is a listed as child fund of Invesco Ltd. and if that institution has disclosed ownership in this security, then these positions will not be double counted when calculating total shares and total value | 487,719 | -0.71 | 11,247 | -2.56 | ||||
| 2025-08-05 | 13F | GPS Wealth Strategies Group, LLC | 7,502 | 0.00 | 175 | -2.23 | ||||
| 2025-08-08 | 13F | Kingsview Wealth Management, LLC | 12,868 | 1.40 | 301 | -0.99 | ||||
| 2025-08-14 | 13F | Bank Of America Corp /de/ | 295,497 | -1.50 | 6,912 | -3.72 | ||||
| 2025-05-13 | 13F | Elequin Capital Lp | 0 | -100.00 | 0 | |||||
| 2025-08-14 | 13F | 1607 Capital Partners, LLC | 24,431 | -14.97 | 571 | -16.89 | ||||
| 2025-07-31 | 13F | Cambridge Investment Research Advisors, Inc. | 22,705 | -26.09 | 1 | |||||
| 2025-08-12 | 13F | Global Retirement Partners, LLC | 1,764 | -72.79 | 41 | -71.13 | ||||
| 2025-08-14 | 13F | GWM Advisors LLC | 16,802 | 0.54 | 393 | -1.50 | ||||
| 2025-06-27 | NP | Calamos ETF Trust - Calamos CEF Income & Arbitrage ETF | 22,448 | -11.54 | 514 | -10.45 | ||||
| 2025-07-18 | 13F | Institute for Wealth Management, LLC. | 8,992 | 0.00 | 210 | -2.33 | ||||
| 2025-08-11 | 13F | Private Advisor Group, LLC | 13,633 | -0.21 | 319 | -2.45 | ||||
| 2025-08-18 | 13F | Geneos Wealth Management Inc. | 11,700 | 100.00 | 274 | 96.40 | ||||
| 2025-07-15 | 13F | North Star Investment Management Corp. | 1,000 | 0.00 | 23 | 0.00 | ||||
| 2025-07-17 | 13F | Janney Montgomery Scott LLC | 84,010 | 31.41 | 2 | 0.00 | ||||
| 2025-07-29 | 13F | First National Bank of Mount Dora, Trust Investment Services | 27,800 | 0.00 | 650 | -2.26 | ||||
| 2025-08-11 | 13F | Principal Securities, Inc. | 222 | -52.87 | 5 | -50.00 | ||||
| 2025-07-29 | 13F | Mezzasalma Advisors, LLC | 12,039 | 1.82 | 282 | -0.35 | ||||
| 2025-05-06 | 13F | Venturi Wealth Management, LLC | 0 | -100.00 | 0 | |||||
| 2025-09-04 | 13F/A | Advisor Group Holdings, Inc. | 166,155 | 29.95 | 3,887 | 27.03 | ||||
| 2025-08-13 | 13F | Northwestern Mutual Wealth Management Co | 1,517 | -59.87 | 35 | -61.11 | ||||
| 2025-08-12 | 13F | LPL Financial LLC | 275,252 | -5.61 | 6,438 | -7.74 | ||||
| 2025-08-15 | 13F | Captrust Financial Advisors | 476,855 | -2.93 | 11,154 | -5.12 | ||||
| 2025-07-21 | 13F | Ameritas Advisory Services, LLC | 522 | 12 | ||||||
| 2025-08-11 | 13F | Nations Financial Group Inc, /ia/ /adv | 22,090 | 3.51 | 517 | 1.18 | ||||
| 2025-08-14 | 13F | Ausdal Financial Partners, Inc. | 8,764 | -9.51 | 205 | -11.69 | ||||
| 2025-08-07 | 13F | Readystate Asset Management Lp | 26,741 | 625 | ||||||
| 2025-08-14 | 13F | Karpus Management, Inc. | 226,036 | -1.86 | 5,287 | -4.08 | ||||
| 2025-08-15 | 13F | Morgan Stanley | 395,174 | 0.04 | 9,243 | -2.21 | ||||
| 2025-04-09 | 13F | Capital CS Group, LLC | 0 | -100.00 | 0 | |||||
| 2025-07-22 | 13F | Powell Investment Advisors, LLC | 10,100 | 0.00 | 236 | -2.07 | ||||
| 2025-08-06 | 13F | Smh Capital Advisors Inc | 8,728 | -2.19 | 204 | -4.23 | ||||
| 2025-08-22 | NP | Cornerstone Strategic Value Fund Inc | 3,703 | -73.15 | 87 | -71.62 | ||||
| 2025-07-17 | 13F | Beacon Capital Management, LLC | 2,877 | 0.00 | 67 | -1.47 | ||||
| 2025-08-13 | 13F | Jones Financial Companies Lllp | 0 | -100.00 | 0 | |||||
| 2025-07-16 | 13F | St Germain D J Co Inc | 1,917 | 0.00 | 45 | -2.22 | ||||
| 2025-05-15 | 13F | WPG Advisers, LLC | 0 | -100.00 | 0 | |||||
| 2025-07-24 | 13F | Conning Inc. | 11,150 | 0.00 | 261 | -2.26 | ||||
| 2025-08-13 | 13F | Guggenheim Capital Llc | 363,179 | -10.68 | 8,495 | -12.70 | ||||
| 2025-05-13 | 13F | HighTower Advisors, LLC | 0 | -100.00 | 0 | |||||
| 2025-05-15 | 13F | Polar Asset Management Partners Inc. | 0 | -100.00 | 0 | |||||
| 2025-08-20 | NP | ADANX - AQR Diversified Arbitrage Fund Class N | 32,728 | -18.53 | 766 | -20.40 | ||||
| 2025-08-04 | 13F | Creative Financial Designs Inc /adv | 600 | 0.00 | 14 | 0.00 | ||||
| 2025-07-14 | 13F | Argentarii, LLC | 10,823 | 0.00 | 253 | -1.94 | ||||
| 2025-08-05 | 13F | Welch & Forbes Llc | 50,000 | 0.00 | 1,170 | -2.26 | ||||
| 2025-08-19 | 13F | Advisory Services Network, LLC | 9,164 | 0.00 | 222 | 1.37 | ||||
| 2025-08-08 | 13F | Pnc Financial Services Group, Inc. | 5,962 | -26.19 | 139 | -27.98 | ||||
| 2025-07-10 | 13F | Wealth Enhancement Advisory Services, Llc | 42,329 | 0.35 | 1,011 | 0.10 | ||||
| 2025-04-25 | 13F | WASHINGTON TRUST Co | 0 | -100.00 | 0 | |||||
| 2025-08-29 | 13F | Evolution Wealth Management Inc. | 670 | 16 | ||||||
| 2025-08-04 | 13F | Spire Wealth Management | 25,404 | 22.09 | 594 | 19.52 | ||||
| 2025-08-13 | 13F | Congress Wealth Management LLC / DE / | 29,728 | 17.87 | 695 | 15.26 | ||||
| 2025-08-14 | 13F | Cohen & Steers, Inc. | 72,835 | 0.00 | 2 | 0.00 | ||||
| 2025-08-07 | 13F | CENTRAL TRUST Co | 88,223 | 0.00 | 2,064 | -2.27 | ||||
| 2025-08-15 | 13F | Provenance Wealth Advisors, LLC | 0 | -100.00 | 0 | -100.00 | ||||
| 2025-08-14 | 13F | Ameriprise Financial Inc | 24,904 | -3.46 | 583 | -5.67 | ||||
| 2025-08-04 | 13F | Creekmur Asset Management LLC | 0 | 0 | ||||||
| 2025-08-14 | 13F | Wiley Bros.-aintree Capital, Llc | 17,717 | 414 | ||||||
| 2025-08-07 | 13F | Hennion & Walsh Asset Management, Inc. | 42,806 | -2.88 | 1,001 | -5.03 | ||||
| 2025-08-07 | 13F | Samalin Investment Counsel, LLC | 49,758 | -4.10 | 1,164 | -6.29 | ||||
| 2025-08-08 | 13F | Fortis Group Advisors, LLC | 9,090 | 221 | ||||||
| 2025-07-24 | 13F | Us Bancorp \de\ | 10,701 | 0.00 | 250 | -2.34 | ||||
| 2025-07-14 | 13F | Sowell Financial Services LLC | 9,519 | -2.08 | 223 | -4.31 | ||||
| 2025-07-25 | NP | FCEF - First Trust CEF Income Opportunity ETF This fund is a listed as child fund of First Trust Advisors Lp and if that institution has disclosed ownership in this security, then these positions will not be double counted when calculating total shares and total value | 62,098 | 4.86 | 1,432 | 2.88 | ||||
| 2025-08-14 | 13F | Abbot Financial Management, Inc. | 15,600 | 0.00 | 365 | -2.41 | ||||
| 2025-08-13 | 13F | First Trust Advisors Lp | 120,175 | 2.28 | 2,811 | -0.04 | ||||
| 2025-08-05 | 13F | Shaker Financial Services, LLC | 23,443 | 548 | ||||||
| 2025-08-12 | 13F | Steward Partners Investment Advisory, Llc | 7,500 | 1.69 | 175 | -0.57 | ||||
| 2025-08-06 | 13F | Commonwealth Equity Services, Llc | 46,577 | 1.38 | 1 | 0.00 | ||||
| 2025-04-28 | 13F | Redmont Wealth Advisors Llc | 2,612 | 63 | ||||||
| 2025-07-17 | 13F | Oakworth Capital, Inc. | 1,500 | 0.00 | 35 | 0.00 | ||||
| 2025-08-27 | NP | RYMSX - Guggenheim Multi-Hedge Strategies Fund Class P | 80 | -37.50 | 2 | -66.67 | ||||
| 2025-07-21 | 13F | Kennebec Savings Bank | 1,155 | 0.00 | 27 | 0.00 | ||||
| 2025-08-13 | 13F | Invesco Ltd. | 545,627 | 5.18 | 12,762 | 2.81 | ||||
| 2025-07-15 | 13F | Fifth Third Bancorp | 3,958 | 6,724.14 | 93 | 9,100.00 | ||||
| 2025-07-25 | 13F | Cwm, Llc | 500 | 0.00 | 0 | |||||
| 2025-08-12 | 13F | Jpmorgan Chase & Co | 42 | -95.57 | 1 | -100.00 | ||||
| 2025-05-12 | 13F | Fmr Llc | 0 | -100.00 | 0 | |||||
| 2025-08-14 | 13F | Raymond James Financial Inc | 311,297 | 4.25 | 7,281 | 1.90 | ||||
| 2025-04-21 | 13F | ORG Partners LLC | 0 | -100.00 | 0 | |||||
| 2025-08-08 | 13F | Cetera Investment Advisers | 163,056 | 2.19 | 3,814 | -0.13 | ||||
| 2025-08-13 | 13F | Cheviot Value Management, LLC | 200 | 0.00 | 5 | 0.00 | ||||
| 2025-08-06 | 13F | North Capital, Inc. | 1,679 | 0.00 | 39 | -2.50 |