Mga Batayang Estadistika
| Pemilik Institusional | 119 total, 119 long only, 0 short only, 0 long/short - change of 10.19% MRQ |
| Alokasi Portofolio Rata-rata | 0.0914 % - change of 35.27% MRQ |
| Saham Institusional (Jangka Panjang) | 3,440,920 (ex 13D/G) - change of 0.48MM shares 16.34% MRQ |
| Nilai Institusional (Jangka Panjang) | $ 162,586 USD ($1000) |
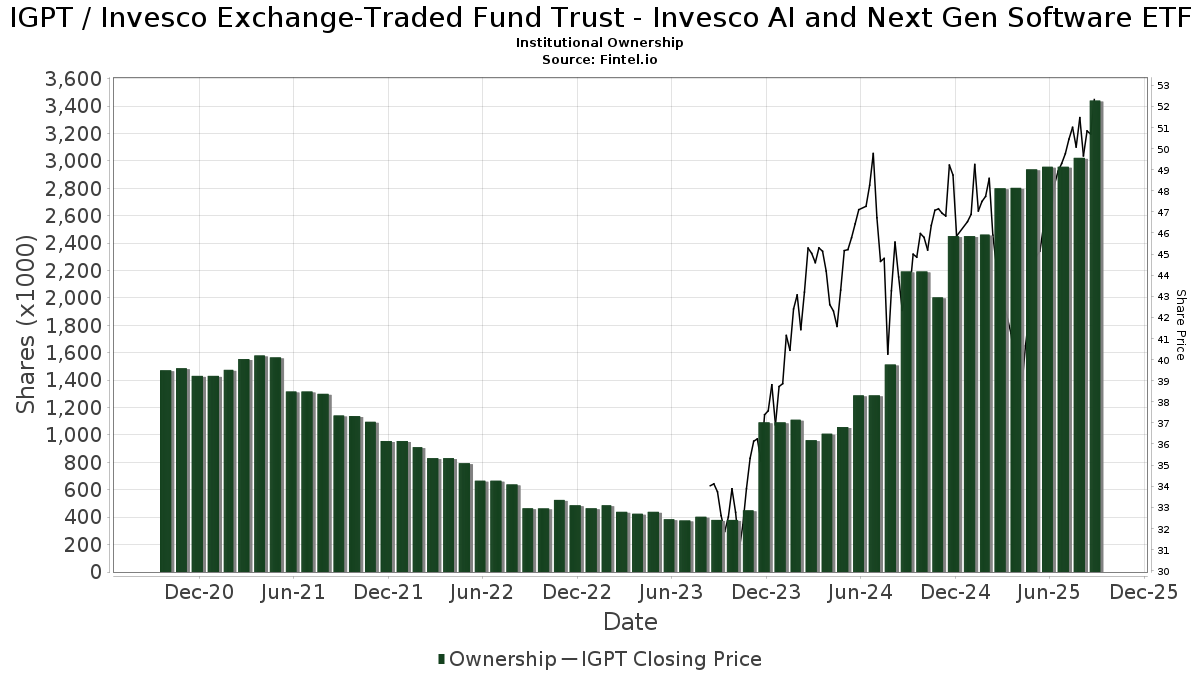
Kepemilikan Institusional dan Pemegang Saham
Invesco Exchange-Traded Fund Trust - Invesco AI and Next Gen Software ETF (US:IGPT) memiliki 119 pemilik institusional dan pemegang saham yang telah mengajukan formulir 13D/G atau 13F kepada Komisi Bursa Efek (Securities Exchange Commission/SEC). Lembaga-lembaga ini memegang total 3,440,920 saham. Pemegang saham terbesar meliputi UBS Group AG, LPL Financial LLC, Morgan Stanley, Journey Strategic Wealth Llc, Berkshire Money Management, Inc., Bank Of America Corp /de/, Members Advisory Group LLC, Advisor Group Holdings, Inc., Ameriprise Financial Inc, and Commonwealth Equity Services, Llc .
Struktur kepemilikan institusional Invesco Exchange-Traded Fund Trust - Invesco AI and Next Gen Software ETF (ARCA:IGPT) menunjukkan posisi terkini di perusahaan oleh institusi dan dana, serta perubahan terbaru dalam ukuran posisi. Pemegang saham utama dapat mencakup investor individu, reksa dana, dana lindung nilai, atau institusi. Jadwal 13D menunjukkan bahwa investor memegang (atau pernah memegang) lebih dari 5% saham perusahaan dan bermaksud (atau pernah bermaksud) untuk secara aktif mengejar perubahan strategi bisnis. Jadwal 13G menunjukkan investasi pasif lebih dari 5%.
The share price as of September 5, 2025 is 51.56 / share. Previously, on September 9, 2024, the share price was 41.66 / share. This represents an increase of 23.76% over that period.
Skor Sentimen Dana
Skor Sentimen Dana (sebelumnya dikenal sebagai Skor Akumulasi Kepemilikan) menemukan saham-saham yang paling banyak dibeli oleh dana. Ini adalah hasil dari model kuantitatif multi-faktor yang canggih yang mengidentifikasi perusahaan dengan tingkat akumulasi institusional tertinggi. Model penilaian menggunakan kombinasi dari total peningkatan pemilik yang diungkapkan, perubahan dalam alokasi portofolio pada pemilik tersebut, dan metrik lainnya. Angka berkisar dari 0 hingga 100, dengan angka yang lebih tinggi menunjukkan tingkat akumulasi yang lebih tinggi dibandingkan dengan perusahaan sejenisnya, dan 50 adalah rata-ratanya.
Frekuensi Pembaruan: Setiap Hari
Lihat Ownership Explorer, yang menyediakan daftar perusahaan dengan peringkat tertinggi.
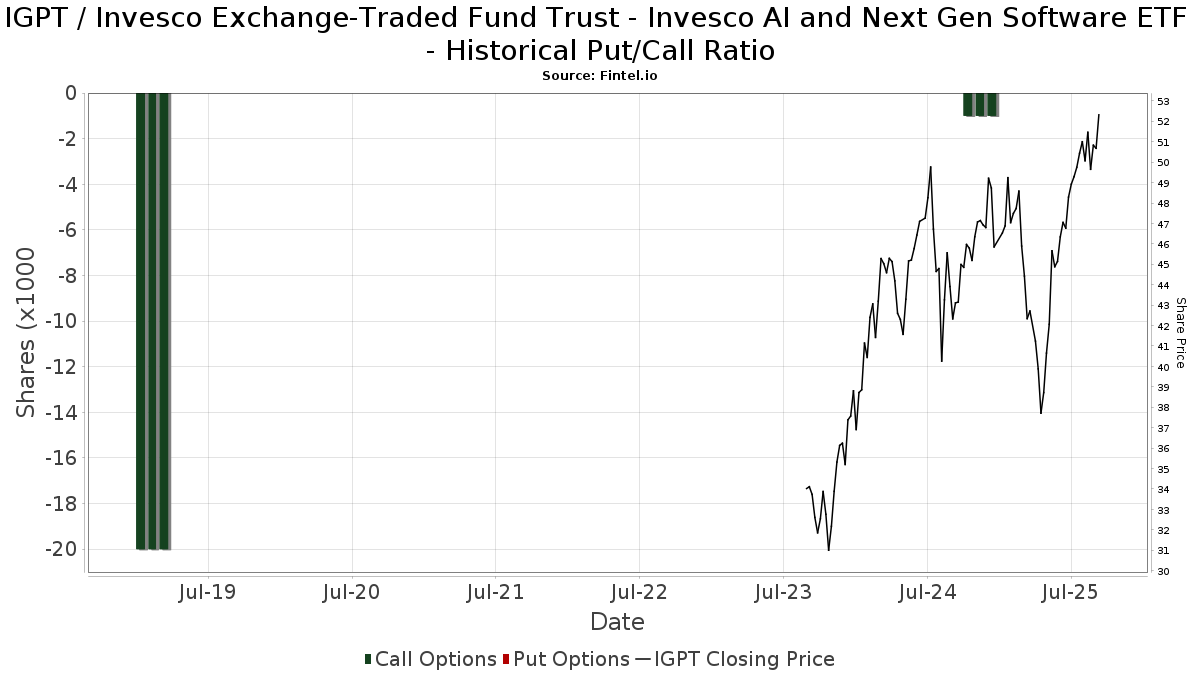
Rasio Put/Call Institusional
Selain melaporkan isu ekuitas dan utang standar, institusi dengan aset di bawah manajemen lebih dari 100 juta dolar AS juga harus mengungkapkan kepemilikan opsi put dan call mereka. Karena opsi put umumnya menunjukkan sentimen negatif, dan opsi call menunjukkan sentimen positif, kita dapat mengetahui sentimen institusional secara keseluruhan dengan memplot rasio put terhadap call. Grafik di sebelah kanan memplot rasio put/call historis untuk instrumen ini.
Menggunakan Rasio Put/Call sebagai indikator sentimen investor mengatasi salah satu kekurangan utama dari penggunaan total kepemilikan institusional, yaitu sejumlah besar aset yang dikelola diinvestasikan secara pasif untuk melacak indeks. Dana yang dikelola secara pasif biasanya tidak membeli opsi, sehingga indikator rasio put/call lebih akurat dalam melacak sentimen dana yang dikelola secara aktif.
Pengajuan 13F dan NPORT
Detail pada pengajuan 13F tersedia gratis. Detail pada pengajuan NP memerlukan keanggotaan premium. Baris berwarna hijau menunjukkan posisi baru. Baris berwarna merah menunjukkan posisi yang sudah ditutup. Klik tautan ini ikon untuk melihat riwayat transaksi selengkapnya.
Tingkatkan
untuk membuka data premium dan mengekspor ke Excel ![]() .
.
| Tanggal File | Sumber | Investor | Ketik | Presyo ng Avg (Silangan) |
Saham | Δ Saham (%) |
Dilaporkan Nilai ($1000) |
Nilai Δ (%) |
Alokasi Port (%) |
|
|---|---|---|---|---|---|---|---|---|---|---|
| 2025-08-11 | 13F | Strategic Wealth Partners, Ltd. | 600 | 29 | ||||||
| 2025-08-14 | 13F | GWM Advisors LLC | 490 | 0.00 | 24 | 26.32 | ||||
| 2025-08-14 | 13F | Wells Fargo & Company/mn | 118 | -91.49 | 6 | -91.07 | ||||
| 2025-07-10 | 13F | Wealth Enhancement Advisory Services, Llc | 10,375 | -3.59 | 510 | 17.24 | ||||
| 2025-07-23 | 13F | Clear Creek Financial Management, LLC | 18,086 | 9.69 | 889 | 33.13 | ||||
| 2025-07-09 | 13F | Orser Capital Management, Llc | 29,820 | 1,466 | ||||||
| 2025-07-11 | 13F | First PREMIER Bank | 125 | 0.00 | 0 | |||||
| 2025-07-30 | 13F | Pacific Sun Financial Corp | 10,310 | -4.63 | 507 | 15.79 | ||||
| 2025-08-07 | 13F | Atala Financial Inc | 0 | -100.00 | 0 | |||||
| 2025-07-18 | 13F | Truist Financial Corp | 8,155 | 8.07 | 401 | 31.15 | ||||
| 2025-08-07 | 13F | Addison Advisors LLC | 681 | 0.00 | 33 | 22.22 | ||||
| 2025-07-16 | 13F | Diversified Enterprises, LLC | 7,626 | -0.97 | 375 | 20.26 | ||||
| 2025-08-15 | 13F | Equitable Holdings, Inc. | 0 | -100.00 | 0 | |||||
| 2025-04-30 | 13F | Cerity Partners LLC | 0 | -100.00 | 0 | |||||
| 2025-08-14 | 13F | Two Sigma Investments, Lp | 0 | -100.00 | 0 | |||||
| 2025-05-14 | 13F | Flow Traders U.s. Llc | 0 | -100.00 | 0 | |||||
| 2025-08-14 | 13F | IHT Wealth Management, LLC | 5,863 | 288 | ||||||
| 2025-08-15 | 13F | Kestra Advisory Services, LLC | 4,879 | -40.16 | 240 | -27.58 | ||||
| 2025-08-08 | 13F | Cetera Investment Advisers | 47,068 | -0.98 | 2,313 | 20.22 | ||||
| 2025-07-16 | 13F | Signature Resources Capital Management, LLC | 154 | 0.00 | 8 | 16.67 | ||||
| 2025-08-04 | 13F | Creative Financial Designs Inc /adv | 154 | 0.00 | 8 | 16.67 | ||||
| 2025-08-05 | 13F | Westside Investment Management, Inc. | 680 | 33 | ||||||
| 2025-07-09 | 13F | Sandy Cove Advisors, LLC | 5,712 | -18.88 | 281 | -1.75 | ||||
| 2025-08-11 | 13F | HighTower Advisors, LLC | 4,399 | 216 | ||||||
| 2025-08-12 | 13F | Indie Asset Partners, LLC | 28,612 | -14.10 | 1,406 | 4.30 | ||||
| 2025-08-15 | 13F | CI Private Wealth, LLC | 28,414 | 6.27 | 1,396 | 29.02 | ||||
| 2025-08-18 | 13F | Geneos Wealth Management Inc. | 224 | 833.33 | 11 | |||||
| 2025-05-15 | 13F/A | Orion Portfolio Solutions, LLC | 7,719 | 313 | ||||||
| 2025-08-13 | 13F | Cresset Asset Management, LLC | 10,133 | 0.03 | 498 | 21.46 | ||||
| 2025-08-14 | 13F | Qube Research & Technologies Ltd | 200 | 0.00 | 10 | 12.50 | ||||
| 2025-08-04 | 13F | Flagship Harbor Advisors, Llc | 9,053 | 20.53 | 445 | 46.05 | ||||
| 2025-08-12 | 13F | Steward Partners Investment Advisory, Llc | 2,035 | 5.60 | 100 | 28.21 | ||||
| 2025-08-14 | 13F | Wiley Bros.-aintree Capital, Llc | 14,900 | 752 | ||||||
| 2025-07-24 | 13F | Ronald Blue Trust, Inc. | 426 | 0.00 | 21 | 17.65 | ||||
| 2025-08-14 | 13F | Brinker Capital Investments, LLC | 0 | -100.00 | 0 | |||||
| 2025-05-09 | 13F | TD Waterhouse Canada Inc. | 0 | -100.00 | 0 | -100.00 | ||||
| 2025-07-31 | 13F | CNB Bank | 283 | 0.00 | 14 | 18.18 | ||||
| 2025-08-06 | 13F | RFG - Bristol Wealth Advisors, LLC | 19,082 | 97.09 | 938 | 139.03 | ||||
| 2025-07-30 | 13F | Wbh Advisory Inc | 4,551 | 224 | ||||||
| 2025-08-14 | 13F | Ancora Advisors, LLC | 137 | 0.00 | 7 | 20.00 | ||||
| 2025-07-22 | 13F | Chung Wu Investment Group, LLC | 1,240 | 61 | ||||||
| 2025-08-11 | 13F | Private Advisor Group, LLC | 18,169 | 0.01 | 893 | 21.36 | ||||
| 2025-08-07 | 13F | Proficio Capital Partners LLC | 6,000 | -77.76 | 295 | -73.08 | ||||
| 2025-07-15 | 13F | Bay Capital Advisors, LLC | 17,819 | 876 | ||||||
| 2025-07-30 | 13F | Evermay Wealth Management Llc | 1,200 | 0.00 | 59 | 20.83 | ||||
| 2025-08-14 | 13F | Fmr Llc | 3,449 | -2.27 | 170 | 19.01 | ||||
| 2025-08-06 | 13F | Aspect Partners, LLC | 29 | -19.44 | 1 | 0.00 | ||||
| 2025-08-12 | 13F | Bokf, Na | 1,260 | 0.00 | 62 | 19.61 | ||||
| 2025-08-13 | 13F | Northwestern Mutual Wealth Management Co | 9,104 | -5.03 | 447 | 15.21 | ||||
| 2025-07-22 | 13F | Berkshire Money Management, Inc. | 164,343 | 4.02 | 8,077 | 26.25 | ||||
| 2025-07-31 | 13F | Cambridge Investment Research Advisors, Inc. | 40,931 | 1.52 | 2 | 100.00 | ||||
| 2025-07-25 | 13F | Cwm, Llc | 1,215 | 0.00 | 0 | |||||
| 2025-05-09 | 13F | Belvedere Trading LLC | Call | 0 | -100.00 | 0 | ||||
| 2025-08-01 | 13F | Envestnet Asset Management Inc | 26,638 | 143.78 | 1,309 | 196.15 | ||||
| 2025-08-11 | 13F | Principal Securities, Inc. | 82 | 4 | ||||||
| 2025-05-09 | 13F | Belvedere Trading LLC | 0 | -100.00 | 0 | |||||
| 2025-07-09 | 13F | Dynamic Advisor Solutions LLC | 25,625 | 1,259 | ||||||
| 2025-07-29 | 13F | Wealthstream Advisors, Inc. | 5,700 | 0.00 | 280 | 21.74 | ||||
| 2025-08-06 | 13F | AE Wealth Management LLC | 3,082 | -3.14 | 151 | 17.97 | ||||
| 2025-08-12 | 13F | Journey Strategic Wealth Llc | 281,158 | 13,818 | ||||||
| 2025-07-14 | 13F | Park Avenue Securities Llc | 5,255 | 0 | ||||||
| 2025-05-12 | 13F | Founders Financial Alliance, LLC | 0 | -100.00 | 0 | -100.00 | ||||
| 2025-05-15 | 13F | Vermillion & White Wealth Management Group, LLC | 0 | -100.00 | 0 | |||||
| 2025-09-04 | 13F/A | Advisor Group Holdings, Inc. | 119,935 | 21.67 | 5,894 | 47.69 | ||||
| 2025-07-25 | 13F | Apollon Wealth Management, LLC | 5,463 | -4.46 | 268 | 16.02 | ||||
| 2025-07-07 | 13F | Thurston, Springer, Miller, Herd & Titak, Inc. | 679 | 0.00 | 33 | 22.22 | ||||
| 2025-07-29 | 13F | Members Advisory Group LLC | 147,451 | -24.00 | 7,248 | -7.74 | ||||
| 2025-08-14 | 13F | CoreCap Advisors, LLC | 0 | -100.00 | 0 | |||||
| 2025-08-06 | 13F | Prospera Financial Services Inc | 5,310 | 261 | ||||||
| 2025-07-21 | 13F | Ameriflex Group, Inc. | 35 | 2 | ||||||
| 2025-08-14 | 13F | Bank Of America Corp /de/ | 152,432 | -10.06 | 7,491 | 9.17 | ||||
| 2025-08-14 | 13F | Federation des caisses Desjardins du Quebec | 60 | 0.00 | 3 | 0.00 | ||||
| 2025-08-14 | 13F | Mpwm Advisory Solutions, Llc | 320 | 0.00 | 16 | 25.00 | ||||
| 2025-07-14 | 13F | Abound Wealth Management | 0 | -100.00 | 0 | |||||
| 2025-08-11 | 13F | Aptus Capital Advisors, LLC | 333 | 0.00 | 16 | 23.08 | ||||
| 2025-08-12 | 13F | Putnam Fl Investment Management Co | 4,350 | 214 | ||||||
| 2025-08-06 | 13F | Commonwealth Equity Services, Llc | 61,848 | -3.09 | 3 | 50.00 | ||||
| 2025-08-14 | 13F | Comerica Bank | 6,850 | 2,684.55 | 337 | 3,633.33 | ||||
| 2025-08-12 | 13F | Edmond De Rothschild Holding S.a. | 324 | 0.00 | 16 | 15.38 | ||||
| 2025-08-14 | 13F/A | Rockefeller Capital Management L.P. | 10,364 | -7.20 | 509 | 12.61 | ||||
| 2025-07-29 | 13F | Private Trust Co Na | 142 | 0.00 | 7 | 20.00 | ||||
| 2025-08-05 | 13F | Carolinas Wealth Consulting Llc | 0 | -100.00 | 0 | -100.00 | ||||
| 2025-08-15 | 13F | Captrust Financial Advisors | 8,926 | -2.98 | 439 | 17.74 | ||||
| 2025-08-14 | 13F | Sunbelt Securities, Inc. | 60 | 3 | ||||||
| 2025-07-25 | 13F | Concurrent Investment Advisors, LLC | 5,291 | -3.33 | 260 | 17.65 | ||||
| 2025-08-18 | 13F/A | National Bank Of Canada /fi/ | 50 | 0.00 | 2 | 0.00 | ||||
| 2025-07-01 | 13F | Harbor Investment Advisory, Llc | 48 | 0.00 | 2 | 100.00 | ||||
| 2025-08-12 | 13F | CIBC Private Wealth Group, LLC | 11,516 | 0.00 | 566 | 39.51 | ||||
| 2025-08-01 | 13F | Providence First Trust Co | 46,544 | -0.01 | 2,287 | 21.39 | ||||
| 2025-08-14 | 13F | Ameriprise Financial Inc | 95,227 | -7.77 | 4,680 | 12.12 | ||||
| 2025-08-05 | 13F | Bank Of Montreal /can/ | 1,750 | 0.00 | 86 | 22.86 | ||||
| 2025-08-04 | 13F | IFG Advisory, LLC | 9,589 | -5.21 | 471 | 15.16 | ||||
| 2025-07-25 | 13F | Stephens Consulting, LLC | 21 | 0.00 | 1 | |||||
| 2025-05-12 | 13F | Hirtle Callaghan & Co LLC | 0 | -100.00 | 0 | |||||
| 2025-07-14 | 13F | Armstrong Advisory Group, Inc | 20 | 1 | ||||||
| 2025-08-14 | 13F | UBS Group AG | 907,257 | 27.48 | 44,587 | 54.73 | ||||
| 2025-08-01 | 13F | Gwn Securities Inc. | 0 | -100.00 | 0 | |||||
| 2025-08-05 | 13F | GPS Wealth Strategies Group, LLC | 734 | 0.00 | 36 | 24.14 | ||||
| 2025-08-14 | 13F | Marshall Investment Management, Llc | 0 | -100.00 | 0 | |||||
| 2025-07-11 | 13F | Seacrest Wealth Management, Llc | 7,801 | -1.55 | 383 | 19.69 | ||||
| 2025-07-25 | 13F | LRI Investments, LLC | 3,855 | 0.00 | 189 | 21.15 | ||||
| 2025-08-12 | 13F | Jpmorgan Chase & Co | 899 | 0.00 | 44 | 22.22 | ||||
| 2025-08-14 | 13F | Susquehanna International Group, Llp | 0 | -100.00 | 0 | -100.00 | ||||
| 2025-08-13 | 13F | Hsbc Holdings Plc | 19,400 | 953 | ||||||
| 2025-05-13 | 13F | Claudia M.p. Batlle, Crp (r) Llc | 0 | -100.00 | 0 | |||||
| 2025-07-24 | 13F | Strengthening Families & Communities, LLC | 400 | 0.00 | 20 | 18.75 | ||||
| 2025-07-31 | 13F | Oppenheimer & Co Inc | 7,788 | -0.14 | 383 | 21.27 | ||||
| 2025-08-14 | 13F | Royal Bank Of Canada | 15,921 | 3.41 | 782 | 25.52 | ||||
| 2025-08-14 | 13F | EP Wealth Advisors, Inc. | 13,764 | -43.18 | 676 | -31.02 | ||||
| 2025-08-14 | 13F | Mariner, LLC | 4,942 | 243 | ||||||
| 2025-07-18 | 13F | Trust Co Of Vermont | 50 | 0.00 | 2 | 0.00 | ||||
| 2025-08-07 | 13F | Allworth Financial LP | 322 | 206.67 | 16 | 275.00 | ||||
| 2025-08-12 | 13F | Proequities, Inc. | 0 | 0 | ||||||
| 2025-08-08 | 13F | Pnc Financial Services Group, Inc. | 575 | 0.00 | 28 | 21.74 | ||||
| 2025-07-16 | 13F | TCI Wealth Advisors, Inc. | 8,413 | 0.00 | 413 | 21.47 | ||||
| 2025-07-29 | 13F | Harbor Asset Planning, Inc. | 586 | 29 | ||||||
| 2025-08-07 | 13F | Kestra Private Wealth Services, Llc | 34,831 | 3.48 | 1,712 | 25.62 | ||||
| 2025-08-12 | 13F | Archer Investment Corp | 50 | 0.00 | 2 | 0.00 | ||||
| 2025-04-15 | 13F | Collier Financial | 4,520 | 0.00 | 183 | -10.29 | ||||
| 2025-08-12 | 13F | Coston, McIsaac & Partners | 138 | 0.00 | 0 | |||||
| 2025-08-19 | 13F | Asset Dedication, LLC | 108 | 0.00 | 5 | 25.00 | ||||
| 2025-05-15 | 13F | Glenmede Trust Co Na | 3,000 | 0.00 | 121 | -10.37 | ||||
| 2025-07-08 | 13F | Parallel Advisors, LLC | 0 | -100.00 | 0 | |||||
| 2025-08-14 | 13F | Jane Street Group, Llc | 0 | -100.00 | 0 | |||||
| 2025-08-08 | 13F | Kingsview Wealth Management, LLC | 25,988 | -9.05 | 1,277 | 10.37 | ||||
| 2025-08-15 | 13F | Morgan Stanley | 282,317 | -4.71 | 13,875 | 15.66 | ||||
| 2025-05-01 | 13F | Steel Peak Wealth Management LLC | 0 | -100.00 | 0 | |||||
| 2025-07-28 | 13F | Harbour Investments, Inc. | 1,484 | 19.10 | 73 | 44.00 | ||||
| 2025-08-14 | 13F | Citadel Advisors Llc | 0 | -100.00 | 0 | |||||
| 2025-08-12 | 13F | Global Retirement Partners, LLC | 1,441 | -28.24 | 71 | -22.22 | ||||
| 2025-08-12 | 13F | LPL Financial LLC | 324,030 | 1.22 | 15,924 | 22.85 | ||||
| 2025-07-16 | 13F | Register Financial Advisors LLC | 330 | -23.26 | 16 | -5.88 | ||||
| 2025-08-14 | 13F | Mml Investors Services, Llc | 9,587 | 16.50 | 0 | |||||
| 2025-08-13 | 13F | Cheviot Value Management, LLC | 750 | 0.00 | 38 | 19.35 | ||||
| 2025-08-13 | 13F | M Holdings Securities, Inc. | 10,043 | 0 | ||||||
| 2025-08-14 | 13F | Glenmede Investment Management, LP | 3,000 | 147 | ||||||
| 2025-08-13 | 13F | Jones Financial Companies Lllp | 58,001 | 21.04 | 2,833 | 45.13 | ||||
| 2025-05-07 | 13F | Mitchell Sinkler & Starr/pa | 0 | -100.00 | 0 | |||||
| 2025-07-30 | 13F | Bogart Wealth, LLC | 0 | -100.00 | 0 | |||||
| 2025-07-16 | 13F | Crowley Wealth Management, Inc. | 3,160 | 86.98 | 160 | 135.29 | ||||
| 2025-05-08 | 13F | Us Bancorp \de\ | 0 | -100.00 | 0 | |||||
| 2025-08-14 | 13F | Raymond James Financial Inc | 36,688 | -15.83 | 1,803 | 2.21 | ||||
| 2025-08-08 | 13F | Avantax Advisory Services, Inc. | 35,989 | 10.57 | 1,769 | 34.24 | ||||
| 2025-08-15 | 13F | Semmax Financial Advisors Inc. | 2,563 | 0.00 | 129 | 18.52 | ||||
| 2025-08-14 | 13F | Stifel Financial Corp | 17,680 | -4.59 | 869 | 15.73 | ||||
| 2025-05-02 | 13F | Sigma Planning Corp | 0 | -100.00 | 0 | -100.00 | ||||
| 2025-07-10 | 13F | Focus Financial Network, Inc. | 4,214 | 207 | ||||||
| 2025-04-10 | 13F | Thrive Wealth Management, LLC | 0 | -100.00 | 0 |
Other Listings
| MX:IGPT |