Mga Batayang Estadistika
| Pemilik Institusional | 175 total, 175 long only, 0 short only, 0 long/short - change of 0.00% MRQ |
| Alokasi Portofolio Rata-rata | 0.1313 % - change of -69.20% MRQ |
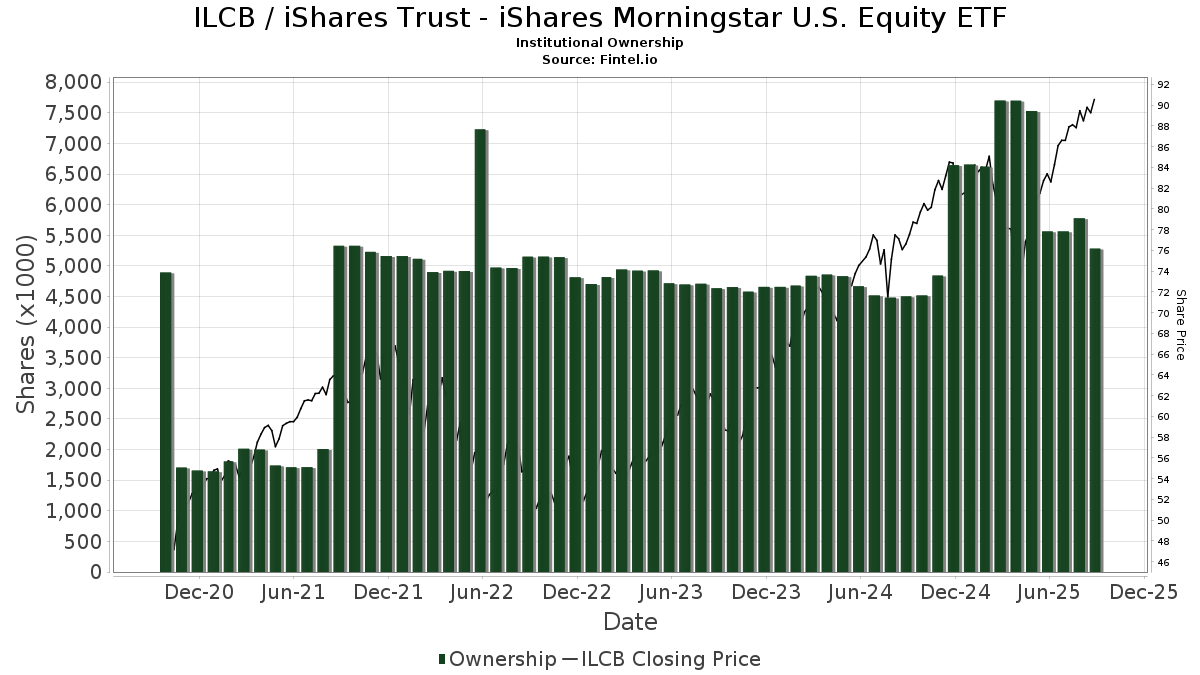
| Saham Institusional (Jangka Panjang) | 5,282,608 (ex 13D/G) - change of -0.28MM shares -5.05% MRQ |
| Nilai Institusional (Jangka Panjang) | $ 431,066 USD ($1000) |
Kepemilikan Institusional dan Pemegang Saham
iShares Trust - iShares Morningstar U.S. Equity ETF (US:ILCB) memiliki 175 pemilik institusional dan pemegang saham yang telah mengajukan formulir 13D/G atau 13F kepada Komisi Bursa Efek (Securities Exchange Commission/SEC). Lembaga-lembaga ini memegang total 5,282,608 saham. Pemegang saham terbesar meliputi Morgan Stanley, Ameriprise Financial Inc, Equitable Holdings, Inc., EQ ADVISORS TRUST - EQ/Large Cap Core Managed Volatility Portfolio Class IB, Exchange Traded Concepts, Llc, Advisor Group Holdings, Inc., LPL Financial LLC, Wealth Enhancement Advisory Services, Llc, Avantax Advisory Services, Inc., and Commonwealth Equity Services, Llc .
Struktur kepemilikan institusional iShares Trust - iShares Morningstar U.S. Equity ETF (ARCA:ILCB) menunjukkan posisi terkini di perusahaan oleh institusi dan dana, serta perubahan terbaru dalam ukuran posisi. Pemegang saham utama dapat mencakup investor individu, reksa dana, dana lindung nilai, atau institusi. Jadwal 13D menunjukkan bahwa investor memegang (atau pernah memegang) lebih dari 5% saham perusahaan dan bermaksud (atau pernah bermaksud) untuk secara aktif mengejar perubahan strategi bisnis. Jadwal 13G menunjukkan investasi pasif lebih dari 5%.
The share price as of September 5, 2025 is 89.77 / share. Previously, on September 9, 2024, the share price was 75.39 / share. This represents an increase of 19.07% over that period.
Skor Sentimen Dana
Skor Sentimen Dana (sebelumnya dikenal sebagai Skor Akumulasi Kepemilikan) menemukan saham-saham yang paling banyak dibeli oleh dana. Ini adalah hasil dari model kuantitatif multi-faktor yang canggih yang mengidentifikasi perusahaan dengan tingkat akumulasi institusional tertinggi. Model penilaian menggunakan kombinasi dari total peningkatan pemilik yang diungkapkan, perubahan dalam alokasi portofolio pada pemilik tersebut, dan metrik lainnya. Angka berkisar dari 0 hingga 100, dengan angka yang lebih tinggi menunjukkan tingkat akumulasi yang lebih tinggi dibandingkan dengan perusahaan sejenisnya, dan 50 adalah rata-ratanya.
Frekuensi Pembaruan: Setiap Hari
Lihat Ownership Explorer, yang menyediakan daftar perusahaan dengan peringkat tertinggi.
Rasio Put/Call Institusional
Selain melaporkan isu ekuitas dan utang standar, institusi dengan aset di bawah manajemen lebih dari 100 juta dolar AS juga harus mengungkapkan kepemilikan opsi put dan call mereka. Karena opsi put umumnya menunjukkan sentimen negatif, dan opsi call menunjukkan sentimen positif, kita dapat mengetahui sentimen institusional secara keseluruhan dengan memplot rasio put terhadap call. Grafik di sebelah kanan memplot rasio put/call historis untuk instrumen ini.
Menggunakan Rasio Put/Call sebagai indikator sentimen investor mengatasi salah satu kekurangan utama dari penggunaan total kepemilikan institusional, yaitu sejumlah besar aset yang dikelola diinvestasikan secara pasif untuk melacak indeks. Dana yang dikelola secara pasif biasanya tidak membeli opsi, sehingga indikator rasio put/call lebih akurat dalam melacak sentimen dana yang dikelola secara aktif.
Pengajuan 13F dan NPORT
Detail pada pengajuan 13F tersedia gratis. Detail pada pengajuan NP memerlukan keanggotaan premium. Baris berwarna hijau menunjukkan posisi baru. Baris berwarna merah menunjukkan posisi yang sudah ditutup. Klik tautan ini ikon untuk melihat riwayat transaksi selengkapnya.
Tingkatkan
untuk membuka data premium dan mengekspor ke Excel ![]() .
.
| Tanggal File | Sumber | Investor | Ketik | Presyo ng Avg (Silangan) |
Saham | Δ Saham (%) |
Dilaporkan Nilai ($1000) |
Nilai Δ (%) |
Alokasi Port (%) |
|
|---|---|---|---|---|---|---|---|---|---|---|
| 2025-09-04 | 13F/A | Advisor Group Holdings, Inc. | 269,313 | 5.93 | 23,098 | 17.58 | ||||
| 2025-07-29 | 13F | Elevation Capital Advisory, LLC | 82,157 | -6.69 | 7,047 | 3.60 | ||||
| 2025-08-12 | 13F | Coston, McIsaac & Partners | 614 | 0.33 | 0 | |||||
| 2025-08-14 | 13F | Money Concepts Capital Corp | 16,922 | -1.06 | 1,452 | 9.84 | ||||
| 2025-08-14 | 13F | Qube Research & Technologies Ltd | 0 | -100.00 | 0 | |||||
| 2025-08-13 | 13F | M&t Bank Corp | 6,595 | 44.95 | 566 | 60.97 | ||||
| 2025-08-14 | 13F | Ameriprise Financial Inc | 494,207 | 3.56 | 42,417 | 15.05 | ||||
| 2025-08-14 | 13F | UBS Group AG | 104,844 | -6.79 | 8,994 | 3.49 | ||||
| 2025-08-13 | 13F | Capital Analysts, Inc. | 485 | 0.21 | 0 | |||||
| 2025-08-14 | 13F | Diversify Advisory Services, LLC | 3,252 | -0.09 | 290 | 16.06 | ||||
| 2025-08-18 | 13F | Geneos Wealth Management Inc. | 2,415 | -24.72 | 207 | -16.19 | ||||
| 2025-07-15 | 13F | Evanson Asset Management, LLC | 2,500 | 214 | ||||||
| 2025-08-14 | 13F | Goldman Sachs Group Inc | 81,612 | 76.97 | 7,001 | 96.52 | ||||
| 2025-08-11 | 13F | HHM Wealth Advisors, LLC | 2,000 | 0.00 | 172 | 11.04 | ||||
| 2025-08-08 | 13F | Good Life Advisors, LLC | 6,541 | 0.05 | 561 | 11.09 | ||||
| 2025-07-17 | 13F | Janney Montgomery Scott LLC | 0 | -100.00 | 0 | |||||
| 2025-08-26 | NP | EQ ADVISORS TRUST - EQ/Large Cap Core Managed Volatility Portfolio Class IB | 348,108 | 0.00 | 29,861 | 11.03 | ||||
| 2025-07-10 | 13F | Rockland Trust Co | 9,895 | 0.00 | 849 | 10.99 | ||||
| 2025-07-22 | 13F | Siligmueller & Norvid Wealth Advisors LLC | 9,844 | 0.00 | 852 | 12.11 | ||||
| 2025-08-14 | 13F | Ancora Advisors, LLC | 136 | 0.00 | 12 | 10.00 | ||||
| 2025-05-15 | 13F | Prospera Financial Services Inc | 0 | -100.00 | 0 | |||||
| 2025-08-07 | 13F | Resources Investment Advisors, LLC. | 15,638 | 0.16 | 1,341 | 11.19 | ||||
| 2025-08-11 | 13F | Landaas & Co /wi /adv | 4,379 | -1.20 | 376 | 9.94 | ||||
| 2025-08-05 | 13F | GPS Wealth Strategies Group, LLC | 115 | 0.00 | 10 | 12.50 | ||||
| 2025-08-12 | 13F | Gladstone Institutional Advisory LLC | 87,228 | -0.42 | 7,482 | 10.57 | ||||
| 2025-05-28 | 13F | Intrua Financial, LLC | 0 | -100.00 | 0 | -100.00 | ||||
| 2025-07-10 | 13F | Wealth Enhancement Advisory Services, Llc | 166,562 | -7.19 | 14,448 | 4.20 | ||||
| 2025-08-11 | 13F | NewEdge Wealth, LLC | 7,265 | -0.71 | 638 | 12.74 | ||||
| 2025-08-12 | 13F | Proequities, Inc. | 0 | 0 | ||||||
| 2025-05-08 | 13F | Natixis Advisors, L.p. | 0 | -100.00 | 0 | |||||
| 2025-07-22 | 13F | Olistico Wealth, LLC | 516 | 0.00 | 44 | 12.82 | ||||
| 2025-07-08 | 13F | Richard P Slaughter Associates Inc | 5,056 | 0.00 | 434 | 11.03 | ||||
| 2025-07-24 | 13F | Us Bancorp \de\ | 461 | 0.00 | 40 | 11.43 | ||||
| 2025-07-10 | 13F | Exchange Traded Concepts, Llc | 272,912 | 23,410 | ||||||
| 2025-08-14 | 13F | Jane Street Group, Llc | 0 | -100.00 | 0 | |||||
| 2025-08-14 | 13F | Mml Investors Services, Llc | 24,363 | -11.08 | 2 | 0.00 | ||||
| 2025-07-28 | 13F | Harbour Investments, Inc. | 2,289 | -4.90 | 196 | 5.95 | ||||
| 2025-05-09 | 13F | Avalon Trust Co | 0 | -100.00 | 0 | |||||
| 2025-08-19 | 13F | National Asset Management, Inc. | 0 | -100.00 | 0 | |||||
| 2025-08-06 | 13F | AE Wealth Management LLC | 438 | -7.40 | 38 | 2.78 | ||||
| 2025-08-11 | 13F | Aptus Capital Advisors, LLC | 371 | 0.27 | 32 | 10.71 | ||||
| 2025-08-06 | 13F | Vantage Financial Partners, LLC | 7,339 | -3.41 | 630 | 7.16 | ||||
| 2025-07-25 | 13F | Commonwealth Financial Services, LLC | 16,356 | 11.67 | 1,403 | 24.05 | ||||
| 2025-08-12 | 13F | Choate Investment Advisors | 5,739 | 0.00 | 492 | 11.06 | ||||
| 2025-08-07 | 13F | Allworth Financial LP | 1,426 | 122 | ||||||
| 2025-07-29 | 13F | Portland Financial Advisors Inc | 3,974 | 0.00 | 341 | 10.75 | ||||
| 2025-08-15 | 13F | Asset Allocation Strategies LLC | 3,920 | 0.28 | 336 | 11.26 | ||||
| 2025-08-12 | 13F | Archer Investment Corp | 316 | 0.00 | 27 | 12.50 | ||||
| 2025-08-13 | 13F | Russell Investments Group, Ltd. | 360 | -8.63 | 31 | 0.00 | ||||
| 2025-08-14 | 13F | Royal Bank Of Canada | 42,348 | -11.17 | 3,633 | -1.36 | ||||
| 2025-07-25 | 13F | Envestnet Portfolio Solutions, Inc. | 2,630 | -18.60 | 226 | -9.64 | ||||
| 2025-08-05 | 13F | MidAtlantic Capital Management, Inc. | 3,667 | -6.09 | 315 | 4.32 | ||||
| 2025-08-06 | 13F | Commonwealth Equity Services, Llc | 139,146 | -0.85 | 12 | 10.00 | ||||
| 2025-08-14 | 13F | Stifel Financial Corp | 5,848 | 3.18 | 502 | 14.65 | ||||
| 2025-08-05 | 13F | Westside Investment Management, Inc. | 226 | 0.44 | 19 | 11.76 | ||||
| 2025-08-26 | NP | EQ ADVISORS TRUST - EQ/Large Cap Value Managed Volatility Portfolio Class IB | 5,416 | 0.00 | 465 | 11.00 | ||||
| 2025-07-07 | 13F | Thurston, Springer, Miller, Herd & Titak, Inc. | 1,877 | 25.47 | 161 | 40.00 | ||||
| 2025-08-04 | 13F | Wealth Management Associates, Inc. | 12,630 | -0.54 | 1,083 | 10.40 | ||||
| 2025-05-15 | 13F | Old Mission Capital Llc | 0 | -100.00 | 0 | |||||
| 2025-05-14 | 13F | TD Capital Management LLC | 0 | -100.00 | 0 | |||||
| 2025-08-14 | 13F | Bank Of America Corp /de/ | 109,584 | 1.39 | 9,400 | 12.57 | ||||
| 2025-08-05 | 13F | Crestwood Advisors Group LLC | 42,927 | -0.34 | 3,682 | 10.67 | ||||
| 2025-08-12 | 13F | MAI Capital Management | 80 | 0.00 | 7 | 0.00 | ||||
| 2025-08-11 | 13F | Greykasell Wealth Strategies, Inc. | 10,858 | -53.51 | 931 | -48.39 | ||||
| 2025-08-12 | 13F | Cornerstone Wealth Management, LLC | 3,270 | 0.00 | 281 | 11.11 | ||||
| 2025-07-02 | 13F | Dentgroup LLC | 14,242 | -0.62 | 1,222 | 10.30 | ||||
| 2025-07-11 | 13F | SILVER OAK SECURITIES, Inc | 4,310 | -14.21 | 370 | -4.40 | ||||
| 2025-07-22 | 13F | Red Tortoise LLC | 7,315 | 0.00 | 627 | 10.97 | ||||
| 2025-07-30 | 13F | Financial Perspectives, Inc | 273 | 0.37 | 23 | 9.52 | ||||
| 2025-07-23 | 13F | Kingswood Wealth Advisors, Llc | 2,850 | 0.00 | 245 | 10.91 | ||||
| 2025-07-16 | 13F | Perigon Wealth Management, LLC | 4,153 | 0.17 | 356 | 11.25 | ||||
| 2025-08-13 | 13F | Northwestern Mutual Wealth Management Co | 18,205 | 106.34 | 1,562 | 129.22 | ||||
| 2025-07-29 | 13F | Lutz Financial Services LLC | 3,356 | 0.00 | 288 | 10.81 | ||||
| 2025-08-11 | 13F | Tidemark, LLC | 608 | 0.00 | 52 | 13.04 | ||||
| 2025-08-15 | 13F | CI Private Wealth, LLC | 89,866 | -53.28 | 7,709 | -48.13 | ||||
| 2025-08-12 | 13F | Tableaux Llc | 24,000 | 24 | ||||||
| 2025-04-10 | 13F | Trinity Wealth Management, LLC | 0 | -100.00 | 0 | |||||
| 2025-08-15 | 13F | Equitable Holdings, Inc. | 384,122 | 0.03 | 32,950 | 11.06 | ||||
| 2025-08-13 | 13F | Dana Investment Advisors, Inc. | 5,948 | 0.00 | 510 | 11.11 | ||||
| 2025-08-18 | 13F | Tyler-Stone Wealth Management | 9,346 | 5.16 | 802 | 16.76 | ||||
| 2025-08-12 | 13F/A | Brightwater Advisory LLC | 6,888 | 0.00 | 591 | 10.90 | ||||
| 2025-07-22 | 13F | Merit Financial Group, LLC | 71,150 | 7.31 | 6,103 | 19.15 | ||||
| 2025-07-24 | 13F | Aurora Private Wealth, Inc. | 3,661 | -1.45 | 0 | |||||
| 2025-08-14 | 13F | Federation des caisses Desjardins du Quebec | 508 | 0.00 | 44 | 10.26 | ||||
| 2025-08-14 | 13F | Arete Wealth Advisors, LLC | 2,698 | -80.87 | 0 | -100.00 | ||||
| 2025-08-14 | 13F | Mariner, LLC | 14,050 | 3.65 | 1,205 | 15.09 | ||||
| 2025-08-08 | 13F | Pnc Financial Services Group, Inc. | 4,408 | 626.19 | 378 | 721.74 | ||||
| 2025-07-30 | 13F | TFB Advisors LLC | 4,158 | 0.22 | 357 | 11.25 | ||||
| 2025-08-14 | 13F | Colony Group, LLC | 0 | -100.00 | 0 | |||||
| 2025-09-03 | 13F | American Trust | 17,226 | 1,478 | ||||||
| 2025-08-12 | 13F | CIBC Private Wealth Group, LLC | 1,480 | 0.00 | 127 | 24.75 | ||||
| 2025-07-17 | 13F | HCR Wealth Advisors | 2,536 | 218 | ||||||
| 2025-07-25 | 13F | Atria Wealth Solutions, Inc. | 21,006 | -23.84 | 1,802 | -15.49 | ||||
| 2025-07-23 | 13F | Capital Management Associates, Inc | 7,219 | -49.89 | 619 | -44.38 | ||||
| 2025-08-11 | 13F | Principal Securities, Inc. | 399 | 1.79 | 34 | 9.68 | ||||
| 2025-07-31 | 13F | Blue Sky Capital Consultants Group, Inc. | 2,487 | -9.03 | 213 | 0.95 | ||||
| 2025-08-15 | 13F | Captrust Financial Advisors | 4,666 | 0.04 | 400 | 11.11 | ||||
| 2025-08-12 | 13F | Laurel Wealth Advisors LLC | 4,118 | 8,479.17 | 0 | -100.00 | ||||
| 2025-03-12 | 13F/A | Private Capital Management Llc | 0 | -100.00 | 0 | -100.00 | ||||
| 2025-08-12 | 13F | J.w. Cole Advisors, Inc. | 28,281 | 0.02 | 2,426 | 11.03 | ||||
| 2025-08-01 | 13F | Envestnet Asset Management Inc | 40,590 | -10.77 | 3,482 | -0.94 | ||||
| 2025-08-13 | 13F | Cerity Partners LLC | 19,972 | 287.81 | 1,713 | 331.49 | ||||
| 2025-07-31 | 13F | City State Bank | 1,268 | 0.00 | 109 | 11.34 | ||||
| 2025-08-11 | 13F | Citigroup Inc | 11,984 | 12.25 | 1,028 | 24.64 | ||||
| 2025-07-18 | 13F | Liberty Capital Management, Inc. | 12,260 | 0.00 | 1,052 | 10.98 | ||||
| 2025-08-05 | 13F | Tsfg, Llc | 1,109 | 0.00 | 0 | |||||
| 2025-07-21 | 13F | Creative Capital Management Investments LLC | 800 | 0.00 | 69 | 11.48 | ||||
| 2025-07-02 | 13F | Helen Stephens Group, LLC | 4,910 | 0.29 | 421 | 11.38 | ||||
| 2025-08-14 | 13F | Wells Fargo & Company/mn | 90,917 | -4.03 | 7,799 | 6.54 | ||||
| 2025-07-14 | 13F | Signature Securities Group Corporation | 4,143 | -3.92 | 355 | 6.61 | ||||
| 2025-08-15 | 13F | Morgan Stanley | 526,156 | 1.58 | 45,134 | 12.79 | ||||
| 2025-07-10 | 13F | Focus Financial Network, Inc. | 4,918 | 0.31 | 422 | 11.38 | ||||
| 2025-07-30 | 13F | Pacific Sun Financial Corp | 7,920 | 0.00 | 679 | 11.13 | ||||
| 2025-08-08 | 13F | Cetera Investment Advisers | 45,275 | 3.03 | 3,884 | 14.37 | ||||
| 2025-08-14 | 13F | Mercer Global Advisors Inc /adv | 105,849 | 9,080 | ||||||
| 2025-08-12 | 13F | LPL Financial LLC | 183,668 | -2.62 | 15,755 | 8.12 | ||||
| 2025-08-14 | 13F | Financial Engines Advisors L.L.C. | 34,179 | 994.08 | 2,932 | 1,116.60 | ||||
| 2025-08-04 | 13F | Jim Saulnier & Associates, Llc | 39,098 | -6.11 | 3,354 | 4.23 | ||||
| 2025-08-12 | 13F | Global Retirement Partners, LLC | 28,666 | -3.43 | 2,459 | 2.08 | ||||
| 2025-08-26 | NP | EQ ADVISORS TRUST - EQ/Large Cap Growth Managed Volatility Portfolio Class IB | 15,692 | 0.00 | 1,346 | 11.06 | ||||
| 2025-04-23 | 13F | Wealthquest Corp | 0 | -100.00 | 0 | |||||
| 2025-08-11 | 13F | HighTower Advisors, LLC | 15,632 | -8.93 | 1,341 | 1.06 | ||||
| 2025-07-11 | 13F | Farther Finance Advisors, LLC | 242 | -3.59 | 21 | 5.26 | ||||
| 2025-05-15 | 13F/A | Orion Portfolio Solutions, LLC | 19,946 | 7.10 | 1,541 | 1.99 | ||||
| 2025-07-18 | 13F | Benchmark Wealth Management, LLC | 64,536 | 0.07 | 5,536 | 11.10 | ||||
| 2025-07-25 | 13F | Cwm, Llc | 8,323 | -1.30 | 1 | |||||
| 2025-07-25 | 13F | PrairieView Partners, LLC | 36 | 0.00 | 0 | |||||
| 2025-08-05 | 13F | Optivise Advisory Services LLC | 3,671 | -1.63 | 315 | 9.03 | ||||
| 2025-08-12 | 13F | Jpmorgan Chase & Co | 129,462 | -5.57 | 11,105 | 4.85 | ||||
| 2025-07-25 | 13F | Apollon Wealth Management, LLC | 10,220 | 0.00 | 877 | 11.03 | ||||
| 2025-08-14 | 13F | Susquehanna International Group, Llp | 36,581 | 175.71 | 3,138 | 206.05 | ||||
| 2025-08-13 | 13F | Baird Financial Group, Inc. | 4,845 | 0.00 | 416 | 10.96 | ||||
| 2025-08-05 | 13F | Bank Of Montreal /can/ | 0 | -100.00 | 0 | |||||
| 2025-07-22 | 13F | Wealthcare Advisory Partners LLC | 2,350 | 202 | ||||||
| 2025-08-14 | 13F | Integrated Wealth Concepts LLC | 2,769 | 0.00 | 238 | 11.27 | ||||
| 2025-08-08 | 13F | Avantax Advisory Services, Inc. | 150,982 | -2.90 | 12,951 | 7.81 | ||||
| 2025-07-18 | 13F | Bartlett & Co. Wealth Management Llc | 180 | 0.00 | 15 | 15.38 | ||||
| 2025-08-14 | 13F | Raymond James Financial Inc | 35,557 | -34.96 | 3,050 | -27.78 | ||||
| 2025-07-22 | 13F | Coastal Investment Advisors, Inc. | 892 | 0.00 | 77 | 11.76 | ||||
| 2025-07-28 | 13F | Morris Financial Concepts, Inc. | 300 | 0.00 | 26 | 8.70 | ||||
| 2025-07-21 | 13F | Ameritas Advisory Services, LLC | 1,555 | -79.37 | 133 | -78.12 | ||||
| 2025-07-15 | 13F | Mather Group, Llc. | 0 | -100.00 | 0 | |||||
| 2025-08-14 | 13F | Kovitz Investment Group Partners, LLC | 12,154 | -0.30 | 1,043 | 10.73 | ||||
| 2025-08-14 | 13F | IHT Wealth Management, LLC | 7,040 | 0.23 | 604 | 11.25 | ||||
| 2025-07-22 | 13F | Cedar Mountain Advisors, LLC | 313 | 0.00 | 27 | 8.33 | ||||
| 2025-08-27 | 13F/A | Brinker Capital Investments, LLC | 18,531 | -7.09 | 1,590 | 3.11 | ||||
| 2025-08-26 | 13F/A | Thrivent Financial For Lutherans | 6,575 | 0.23 | 1 | |||||
| 2025-07-28 | 13F | Harbour Trust & Investment Management Co | 4,700 | 0.00 | 403 | 11.02 | ||||
| 2025-08-13 | 13F | Flow Traders U.s. Llc | 0 | -100.00 | 0 | |||||
| 2025-08-19 | 13F | Cape Investment Advisory, Inc. | 5,155 | 0.00 | 442 | 11.06 | ||||
| 2025-08-08 | 13F | Tortoise Investment Management, LLC | 1,340 | 0.00 | 115 | 10.68 | ||||
| 2025-08-13 | 13F | Jones Financial Companies Lllp | 1,872 | 61.80 | 160 | 80.68 | ||||
| 2025-08-07 | 13F | PFG Advisors | 0 | -100.00 | 0 | |||||
| 2025-07-09 | 13F | Brand Asset Management Group, Inc. | 43,555 | -4.42 | 3,736 | 6.14 | ||||
| 2025-08-14 | 13F | Comerica Bank | 8,377 | -1.47 | 719 | 9.45 | ||||
| 2025-08-14 | 13F | West Coast Financial LLC | 0 | -100.00 | 0 | |||||
| 2025-08-14 | 13F | Fmr Llc | 14,859 | -4.66 | 1,275 | 5.81 | ||||
| 2025-07-31 | 13F | Opus Capital Group, LLC | 3,252 | 0.00 | 0 | |||||
| 2025-07-14 | 13F | Chapin Davis, Inc. | 6,587 | 0.00 | 565 | 11.22 | ||||
| 2025-07-29 | 13F | May Barnhard Investments LLC | 15,465 | 0.00 | 1,327 | 11.06 | ||||
| 2025-08-08 | 13F | Creative Planning | 9,562 | -35.72 | 820 | -28.63 | ||||
| 2025-08-12 | 13F | Bokf, Na | 1,718 | 147 | ||||||
| 2025-08-08 | 13F | Larson Financial Group LLC | 4,076 | 0.30 | 350 | 11.15 | ||||
| 2025-07-01 | 13F | Harbor Investment Advisory, Llc | 2,064 | 0.00 | 177 | 11.32 | ||||
| 2025-08-06 | 13F | Savant Capital, LLC | 13,463 | 1.90 | 1,155 | 13.14 | ||||
| 2025-05-14 | 13F | Seeds Investor Llc | 0 | -100.00 | 0 | |||||
| 2025-07-21 | 13F | Credential Qtrade Securities Inc. | 0 | -100.00 | 0 | -100.00 | ||||
| 2025-07-18 | 13F | Fmb Wealth Management | 3,188 | 0.00 | 273 | 10.98 | ||||
| 2025-08-14 | 13F | Silvercrest Asset Management Group Llc | 2,364 | 203 | ||||||
| 2025-05-15 | 13F | Harvest Investment Services, LLC | 0 | -100.00 | 0 | |||||
| 2025-08-12 | 13F | Steward Partners Investment Advisory, Llc | 3,782 | 10.42 | 324 | 22.73 | ||||
| 2025-08-14 | 13F | Two Sigma Investments, Lp | 11,800 | 1,012 | ||||||
| 2025-04-21 | 13F | Nelson, Van Denburg & Campbell Wealth Management Group, LLC | 0 | -100.00 | 0 | |||||
| 2025-07-29 | NP | EBI - Longview Advantage ETF | 0 | -100.00 | 0 | -100.00 | ||||
| 2025-07-22 | 13F | Silvia Mccoll Wealth Management, Llc | 19,315 | 0.00 | 1,657 | 10.99 | ||||
| 2025-08-14 | 13F | Keystone Financial Services, LLC | 11,247 | 0.02 | 965 | 11.06 | ||||
| 2025-08-12 | 13F | Asset Management Group, Inc. | 7,818 | 0.26 | 671 | 11.30 | ||||
| 2025-05-13 | 13F | AdvisorShares Investments LLC | 0 | -100.00 | 0 | |||||
| 2025-08-15 | 13F | Kestra Advisory Services, LLC | 8,408 | 2.93 | 721 | 14.26 | ||||
| 2025-07-15 | 13F | Fifth Third Bancorp | 520 | 0.00 | 45 | 10.00 | ||||
| 2025-07-25 | 13F | Index Fund Advisors, Inc. | 2,800 | 0.00 | 240 | 11.11 | ||||
| 2025-08-12 | 13F | AlphaCore Capital LLC | 3,528 | 303 | ||||||
| 2025-08-08 | 13F | Gts Securities Llc | 16,320 | -40.04 | 1,400 | -33.44 | ||||
| 2025-07-11 | 13F | Seacrest Wealth Management, Llc | 10,090 | -9.40 | 866 | 0.58 | ||||
| 2025-08-13 | 13F | Scotia Capital Inc. | 2,609 | -44.05 | 224 | -38.06 | ||||
| 2025-07-31 | 13F | Cambridge Investment Research Advisors, Inc. | 39,198 | -14.81 | 3 | 0.00 | ||||
| 2025-07-30 | 13F | Strategic Blueprint, LLC | 7,040 | -7.61 | 604 | 2.55 | ||||
| 2025-08-04 | 13F | Creative Financial Designs Inc /adv | 82 | 0.00 | 7 | 16.67 | ||||
| 2025-08-11 | 13F | Synergy Investment Management, LLC | 0 | -100.00 | 0 | |||||
| 2025-08-14 | 13F | Great Valley Advisor Group, Inc. | 2,610 | 0.27 | 224 | 10.95 | ||||
| 2025-07-14 | 13F | Painted Porch Advisors LLC | 122 | -44.04 | 10 | -37.50 | ||||
| 2025-07-29 | 13F | Salomon & Ludwin, LLC | 792 | 0.00 | 68 | 11.48 | ||||
| 2025-08-04 | 13F | Assetmark, Inc | 1,703 | -90.58 | 146 | -89.55 | ||||
| 2025-08-14 | 13F | Modern Wealth Management, LLC | 30,777 | 2,640 | ||||||
| 2025-07-29 | 13F | Chicago Partners Investment Group LLC | 4,823 | 0.00 | 424 | 13.10 | ||||
| 2025-07-14 | 13F | Farmers & Merchants Investments Inc | 1,959 | -5.82 | 168 | 5.00 | ||||
| 2025-05-15 | 13F | GWM Advisors LLC | 0 | -100.00 | 0 | |||||
| 2025-07-21 | 13F | New Century Financial Group, LLC | 2,694 | 0.04 | 231 | 11.06 | ||||
| 2025-08-14 | 13F | Citadel Advisors Llc | 0 | -100.00 | 0 | |||||
| 2025-07-22 | 13F | DAVENPORT & Co LLC | 2,624 | 225 | ||||||
| 2025-08-15 | 13F | Tower Research Capital LLC (TRC) | 0 | -100.00 | 0 | |||||
| 2025-04-21 | 13F | PSI Advisors, LLC | 0 | -100.00 | 0 | -100.00 | ||||
| 2025-07-28 | 13F | Mutual Advisors, LLC | 2,940 | 0.00 | 260 | 15.63 | ||||
| 2025-08-11 | 13F | Private Advisor Group, LLC | 12,990 | -8.08 | 1,114 | 2.11 | ||||
| 2025-07-24 | 13F | Edge Financial Advisors LLC | 4,693 | 402 | ||||||
| 2025-07-10 | 13F | Security National Bank | 1,158 | 0.00 | 99 | 11.24 |