Mga Batayang Estadistika
| Pemilik Institusional | 112 total, 112 long only, 0 short only, 0 long/short - change of -3.45% MRQ |
| Alokasi Portofolio Rata-rata | 0.1977 % - change of 2.35% MRQ |
| Saham Institusional (Jangka Panjang) | 3,964,057 (ex 13D/G) - change of 0.68MM shares 20.86% MRQ |
| Nilai Institusional (Jangka Panjang) | $ 222,813 USD ($1000) |
Kepemilikan Institusional dan Pemegang Saham
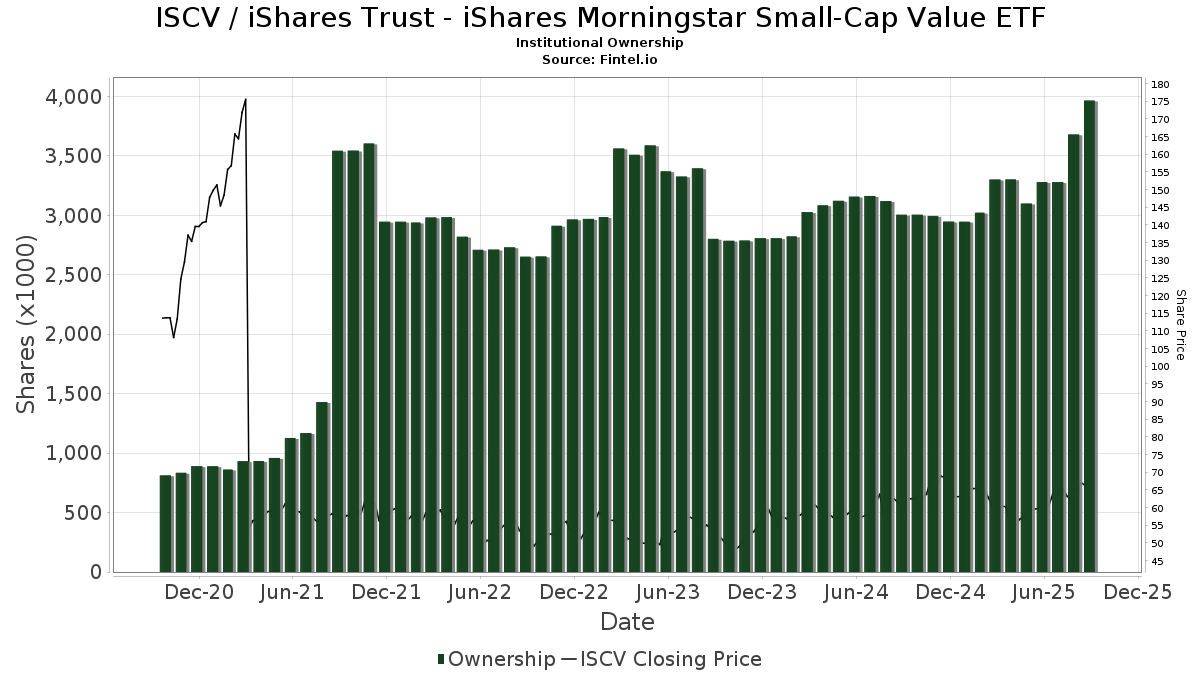
iShares Trust - iShares Morningstar Small-Cap Value ETF (US:ISCV) memiliki 112 pemilik institusional dan pemegang saham yang telah mengajukan formulir 13D/G atau 13F kepada Komisi Bursa Efek (Securities Exchange Commission/SEC). Lembaga-lembaga ini memegang total 3,964,057 saham. Pemegang saham terbesar meliputi Colony Group, LLC, Morgan Stanley, Exchange Traded Concepts, Llc, VAUGHAN & Co SECURITIES, INC., Matrix Trust Co, Steele Capital Management, Inc., LPL Financial LLC, Bank Of America Corp /de/, Royal Bank Of Canada, and Wells Fargo & Company/mn .
Struktur kepemilikan institusional iShares Trust - iShares Morningstar Small-Cap Value ETF (ARCA:ISCV) menunjukkan posisi terkini di perusahaan oleh institusi dan dana, serta perubahan terbaru dalam ukuran posisi. Pemegang saham utama dapat mencakup investor individu, reksa dana, dana lindung nilai, atau institusi. Jadwal 13D menunjukkan bahwa investor memegang (atau pernah memegang) lebih dari 5% saham perusahaan dan bermaksud (atau pernah bermaksud) untuk secara aktif mengejar perubahan strategi bisnis. Jadwal 13G menunjukkan investasi pasif lebih dari 5%.
The share price as of September 5, 2025 is 67.55 / share. Previously, on September 9, 2024, the share price was 60.30 / share. This represents an increase of 12.02% over that period.
Skor Sentimen Dana
Skor Sentimen Dana (sebelumnya dikenal sebagai Skor Akumulasi Kepemilikan) menemukan saham-saham yang paling banyak dibeli oleh dana. Ini adalah hasil dari model kuantitatif multi-faktor yang canggih yang mengidentifikasi perusahaan dengan tingkat akumulasi institusional tertinggi. Model penilaian menggunakan kombinasi dari total peningkatan pemilik yang diungkapkan, perubahan dalam alokasi portofolio pada pemilik tersebut, dan metrik lainnya. Angka berkisar dari 0 hingga 100, dengan angka yang lebih tinggi menunjukkan tingkat akumulasi yang lebih tinggi dibandingkan dengan perusahaan sejenisnya, dan 50 adalah rata-ratanya.
Frekuensi Pembaruan: Setiap Hari
Lihat Ownership Explorer, yang menyediakan daftar perusahaan dengan peringkat tertinggi.
Rasio Put/Call Institusional
Selain melaporkan isu ekuitas dan utang standar, institusi dengan aset di bawah manajemen lebih dari 100 juta dolar AS juga harus mengungkapkan kepemilikan opsi put dan call mereka. Karena opsi put umumnya menunjukkan sentimen negatif, dan opsi call menunjukkan sentimen positif, kita dapat mengetahui sentimen institusional secara keseluruhan dengan memplot rasio put terhadap call. Grafik di sebelah kanan memplot rasio put/call historis untuk instrumen ini.
Menggunakan Rasio Put/Call sebagai indikator sentimen investor mengatasi salah satu kekurangan utama dari penggunaan total kepemilikan institusional, yaitu sejumlah besar aset yang dikelola diinvestasikan secara pasif untuk melacak indeks. Dana yang dikelola secara pasif biasanya tidak membeli opsi, sehingga indikator rasio put/call lebih akurat dalam melacak sentimen dana yang dikelola secara aktif.
Pengajuan 13F dan NPORT
Detail pada pengajuan 13F tersedia gratis. Detail pada pengajuan NP memerlukan keanggotaan premium. Baris berwarna hijau menunjukkan posisi baru. Baris berwarna merah menunjukkan posisi yang sudah ditutup. Klik tautan ini ikon untuk melihat riwayat transaksi selengkapnya.
Tingkatkan
untuk membuka data premium dan mengekspor ke Excel ![]() .
.
| Tanggal File | Sumber | Investor | Ketik | Presyo ng Avg (Silangan) |
Saham | Δ Saham (%) |
Dilaporkan Nilai ($1000) |
Nilai Δ (%) |
Alokasi Port (%) |
|
|---|---|---|---|---|---|---|---|---|---|---|
| 2025-05-01 | 13F | Coastal Investment Advisors, Inc. | 0 | -100.00 | 0 | |||||
| 2025-08-14 | 13F | Two Sigma Investments, Lp | 0 | -100.00 | 0 | |||||
| 2025-08-14 | 13F | Bank Of America Corp /de/ | 162,873 | 9.37 | 9,999 | 13.23 | ||||
| 2025-08-11 | 13F | Principal Securities, Inc. | 2,565 | 0.00 | 157 | -3.09 | ||||
| 2025-07-23 | 13F | Abel Hall, LLC | 10,652 | 153.14 | 654 | 162.25 | ||||
| 2025-08-08 | 13F | Cetera Investment Advisers | 47,268 | 1.27 | 2,902 | 4.84 | ||||
| 2025-08-14 | 13F | Stifel Financial Corp | 0 | -100.00 | 0 | |||||
| 2025-05-05 | 13F | Eagle Bay Advisors LLC | 0 | -100.00 | 0 | -100.00 | ||||
| 2025-08-12 | 13F | LPL Financial LLC | 187,790 | 24.83 | 11,528 | 29.22 | ||||
| 2025-07-08 | 13F | Nbc Securities, Inc. | 4,735 | 0.21 | 0 | |||||
| 2025-07-15 | 13F | Unified Investment Management | 4,047 | 0.00 | 248 | 3.77 | ||||
| 2025-08-05 | 13F | GPS Wealth Strategies Group, LLC | 54 | 0.00 | 3 | 0.00 | ||||
| 2025-08-13 | 13F | Russell Investments Group, Ltd. | 83 | 0.00 | 5 | 25.00 | ||||
| 2025-08-14 | 13F | UBS Group AG | 84,958 | -10.82 | 5,216 | -7.67 | ||||
| 2025-08-12 | 13F | Kohmann Bosshard Financial Services, LLC | 19,506 | 0.00 | 1,197 | 3.55 | ||||
| 2025-08-01 | 13F | Stuart Chaussee & Associates, Inc. | 0 | -100.00 | 0 | |||||
| 2025-08-07 | 13F | Gryphon Financial Partners LLC | 0 | -100.00 | 0 | |||||
| 2025-08-14 | 13F | MGB Wealth Management, LLC | 175 | 0.00 | 11 | 0.00 | ||||
| 2025-08-01 | 13F | Transcend Wealth Collective, Llc | 5,727 | 0.00 | 352 | 3.54 | ||||
| 2025-07-22 | 13F | Sage Financial Group Inc | 0 | -100.00 | 0 | |||||
| 2025-08-12 | 13F | Global Retirement Partners, LLC | 42 | -45.45 | 3 | -50.00 | ||||
| 2025-07-30 | 13F | Black Diamond Financial, LLC | 10,574 | -33.26 | 649 | -30.88 | ||||
| 2025-08-05 | 13F | Sigma Planning Corp | 7,051 | 0.00 | 433 | 3.35 | ||||
| 2025-07-23 | 13F | Lansing Street Advisors | 5,561 | 33.84 | 341 | 38.62 | ||||
| 2025-08-13 | 13F | Jones Financial Companies Lllp | 6,021 | 2.61 | 371 | 6.63 | ||||
| 2025-08-18 | 13F | Geneos Wealth Management Inc. | 7,255 | 98.33 | 445 | 106.02 | ||||
| 2025-07-01 | 13F | Harbor Investment Advisory, Llc | 759 | 0.00 | 47 | 2.22 | ||||
| 2025-08-12 | 13F | Laurel Wealth Advisors LLC | 51,568 | 6,039.05 | 1 | -100.00 | ||||
| 2025-08-04 | 13F | Jim Saulnier & Associates, Llc | 10,075 | -4.97 | 619 | -1.59 | ||||
| 2025-08-11 | 13F | HighTower Advisors, LLC | 6,793 | 23.20 | 417 | 27.91 | ||||
| 2025-08-14 | 13F | Wealth Preservation Advisors, LLC | 480 | 0.00 | 29 | 3.57 | ||||
| 2025-07-09 | 13F | Christopher J. Hasenberg, Inc | 0 | -100.00 | 0 | |||||
| 2025-08-19 | 13F | Advisory Services Network, LLC | 45,910 | 2,868 | ||||||
| 2025-07-21 | 13F | Ameritas Advisory Services, LLC | 136 | 8 | ||||||
| 2025-05-15 | 13F | Old Mission Capital Llc | 0 | -100.00 | 0 | -100.00 | ||||
| 2025-07-25 | 13F | LRI Investments, LLC | 17,976 | 0.00 | 1,104 | 3.57 | ||||
| 2025-08-01 | 13F | Gwn Securities Inc. | 5,038 | 12.63 | 310 | 16.60 | ||||
| 2025-08-12 | 13F | Steward Partners Investment Advisory, Llc | 222 | 0.00 | 14 | 0.00 | ||||
| 2025-08-12 | 13F | Argent Trust Co | 4,889 | 0.00 | 300 | 3.81 | ||||
| 2025-07-11 | 13F | Farther Finance Advisors, LLC | 1,440 | 0.00 | 88 | 3.53 | ||||
| 2025-07-22 | 13F | VAUGHAN & Co SECURITIES, INC. | 281,895 | 6.10 | 17,306 | 9.84 | ||||
| 2025-07-30 | 13F | D.a. Davidson & Co. | 19,318 | 3.80 | 1,186 | 7.43 | ||||
| 2025-08-05 | 13F | Key FInancial Inc | 9,311 | 8.57 | 572 | 12.40 | ||||
| 2025-07-09 | 13F | Towerpoint Wealth, LLC | 5,667 | -0.04 | 348 | 3.27 | ||||
| 2025-08-04 | 13F | Spire Wealth Management | 0 | -100.00 | 0 | |||||
| 2025-08-14 | 13F | Colony Group, LLC | 395,792 | 67.70 | 24,298 | 73.61 | ||||
| 2025-08-05 | 13F | Sensible Money, LLC | 5,639 | 0.50 | 346 | 4.22 | ||||
| 2025-08-14 | 13F | Raymond James Financial Inc | 129,154 | -10.52 | 7,929 | -7.36 | ||||
| 2025-08-04 | 13F | Pensionmark Financial Group, Llc | 3,356 | 206 | ||||||
| 2025-08-13 | 13F | MONECO Advisors, LLC | 5,160 | -15.53 | 317 | -12.71 | ||||
| 2025-08-06 | 13F | Commonwealth Equity Services, Llc | 40,506 | 5.05 | 2 | 0.00 | ||||
| 2025-07-25 | 13F | Courage Miller Partners, LLC | 9,904 | -3.18 | 608 | 0.33 | ||||
| 2025-08-12 | 13F | Jpmorgan Chase & Co | 62,117 | 9.02 | 3,813 | 12.88 | ||||
| 2025-08-19 | 13F | Asset Dedication, LLC | 5,741 | 0.49 | 352 | 4.14 | ||||
| 2025-08-05 | 13F | Bank Of Montreal /can/ | 450 | 29 | ||||||
| 2025-07-21 | 13F | Barrett & Company, Inc. | 3,276 | 0.00 | 201 | 3.61 | ||||
| 2025-07-08 | 13F | Rise Advisors, LLC | 411 | -37.44 | 25 | -34.21 | ||||
| 2025-07-23 | 13F | Viewpoint Capital Management LLC | 45,274 | -0.27 | 2,779 | 3.23 | ||||
| 2025-08-14 | 13F | Goldman Sachs Group Inc | 43,420 | 0.00 | 2,666 | 3.54 | ||||
| 2025-05-12 | 13F | C2P Capital Advisory Group, LLC d.b.a. Prosperity Capital Advisors | 0 | -100.00 | 0 | -100.00 | ||||
| 2025-07-10 | 13F | Exchange Traded Concepts, Llc | 317,150 | 19,470 | ||||||
| 2025-08-14 | 13F | IHT Wealth Management, LLC | 27,555 | 2.15 | 1,692 | 5.75 | ||||
| 2025-08-06 | 13F | AE Wealth Management LLC | 330 | 0.00 | 20 | 5.26 | ||||
| 2025-08-14 | 13F | Smartleaf Asset Management LLC | 2,621 | 8.31 | 161 | 12.59 | ||||
| 2025-05-15 | 13F | Ruane, Cunniff & Goldfarb L.P. | 0 | -100.00 | 0 | |||||
| 2025-05-14 | 13F | Mml Investors Services, Llc | 0 | -100.00 | 0 | |||||
| 2025-08-01 | 13F | Envestnet Asset Management Inc | 60,270 | 540.76 | 3,700 | 564.09 | ||||
| 2025-08-12 | 13F | Archer Investment Corp | 468 | 0.00 | 29 | 3.70 | ||||
| 2025-07-28 | 13F | RMR Capital Management, LLC | 0 | -100.00 | 0 | |||||
| 2025-07-31 | 13F | Cambridge Investment Research Advisors, Inc. | 35,563 | 1.93 | 2 | 0.00 | ||||
| 2025-08-14 | 13F | Fmr Llc | 3,708 | -24.39 | 228 | -21.72 | ||||
| 2025-07-30 | 13F | Pacific Sun Financial Corp | 10,199 | 0.00 | 626 | 3.64 | ||||
| 2025-07-10 | 13F | Wealth Enhancement Advisory Services, Llc | 9,854 | 0.06 | 630 | 8.06 | ||||
| 2025-07-29 | 13F | Rodgers & Associates, LTD | 43,078 | 35.94 | 2,645 | 40.71 | ||||
| 2025-08-14 | 13F | Comerica Bank | 17,740 | 2.67 | 1,089 | 6.35 | ||||
| 2025-08-08 | 13F | Pnc Financial Services Group, Inc. | 870 | 67.63 | 53 | 76.67 | ||||
| 2025-07-22 | 13F | Cedar Mountain Advisors, LLC | 727 | 0.00 | 45 | 2.33 | ||||
| 2025-08-14 | 13F | Mariner, LLC | 17,322 | 44.62 | 1,063 | 49.72 | ||||
| 2025-08-08 | 13F | Creative Planning | 4,955 | 20.47 | 304 | 25.10 | ||||
| 2025-07-14 | 13F | Matrix Trust Co | 189,512 | 1.71 | 12 | 0.00 | ||||
| 2025-07-29 | 13F | Private Trust Co Na | 467 | -66.76 | 29 | -66.27 | ||||
| 2025-08-11 | 13F | Citigroup Inc | 4,324 | 2.95 | 265 | 6.43 | ||||
| 2025-05-15 | 13F | Perennial Investment Advisors, LLC | 0 | -100.00 | 0 | |||||
| 2025-07-17 | 13F | Janney Montgomery Scott LLC | 14,226 | -2.35 | 1 | |||||
| 2025-08-11 | 13F | Aptus Capital Advisors, LLC | 17,329 | 1,064 | ||||||
| 2025-08-14 | 13F | Susquehanna International Group, Llp | 40,516 | 2,487 | ||||||
| 2025-07-29 | 13F | Madison Wealth Partners, Inc | 5,307 | 3.59 | 326 | 7.26 | ||||
| 2025-08-12 | 13F | MAI Capital Management | 372 | 0.00 | 23 | 0.00 | ||||
| 2025-08-13 | 13F | Brentview Investment Management LLC | 1,000 | 0.00 | 61 | 3.39 | ||||
| 2025-05-14 | 13F | CI Private Wealth, LLC | 0 | -100.00 | 0 | -100.00 | ||||
| 2025-05-14 | 13F | Caitlin John, LLC | 0 | -100.00 | 0 | |||||
| 2025-08-06 | 13F | Eukles Asset Management | 117 | 0.00 | 7 | 16.67 | ||||
| 2025-07-28 | 13F | Harbour Investments, Inc. | 2,500 | 0.00 | 153 | 3.38 | ||||
| 2025-08-14 | 13F | Wells Fargo & Company/mn | 130,493 | 19.87 | 8,011 | 24.09 | ||||
| 2025-08-15 | 13F | Kestra Advisory Services, LLC | 43,430 | 1.07 | 2,666 | 4.63 | ||||
| 2025-08-12 | 13F | Proequities, Inc. | 0 | 0 | ||||||
| 2025-08-08 | 13F | Capital Investment Advisory Services, LLC | 800 | -33.33 | 49 | -30.99 | ||||
| 2025-05-12 | 13F | Sandy Spring Bank | 204 | 0.00 | 12 | 0.00 | ||||
| 2025-05-02 | 13F | MB Generational Wealth, LLC | 23,415 | 0.00 | 1,389 | -6.47 | ||||
| 2025-08-14 | 13F | EP Wealth Advisors, Inc. | 33,839 | -3.88 | 2,077 | -0.48 | ||||
| 2025-08-15 | 13F | Morgan Stanley | 352,812 | -9.01 | 21,659 | -5.80 | ||||
| 2025-08-15 | 13F | Tower Research Capital LLC (TRC) | 0 | -100.00 | 0 | |||||
| 2025-07-22 | 13F | Steele Capital Management, Inc. | 189,512 | 1.71 | 11,634 | 5.29 | ||||
| 2025-08-13 | 13F | Northwestern Mutual Wealth Management Co | 45,399 | -1.20 | 2,787 | 2.31 | ||||
| 2025-08-08 | 13F | Avantax Advisory Services, Inc. | 64,197 | -0.39 | 3,941 | 3.14 | ||||
| 2025-08-07 | 13F | Blackhawk Capital Partners LLC. | 0 | -100.00 | 0 | |||||
| 2025-07-31 | 13F | City State Bank | 2,196 | 0.00 | 135 | 3.08 | ||||
| 2025-08-13 | 13F | Summit Financial, LLC | 3,676 | 0.11 | 226 | 3.69 | ||||
| 2025-07-29 | 13F | Chicago Partners Investment Group LLC | 49,893 | -0.01 | 3,250 | 13.25 | ||||
| 2025-07-25 | 13F | Cwm, Llc | 3,642 | -7.61 | 0 | |||||
| 2025-07-24 | 13F | Blair William & Co/il | 45 | -10.00 | 3 | 0.00 | ||||
| 2025-08-07 | 13F | Panoramic Investment Advisors, Llc | 13,380 | -2.72 | 821 | 0.74 | ||||
| 2025-05-02 | 13F | BlackRock, Inc. | 0 | -100.00 | 0 | -100.00 | ||||
| 2025-08-14 | 13F | Royal Bank Of Canada | 158,315 | 43.38 | 9,718 | 48.43 | ||||
| 2025-05-05 | 13F | New England Capital Financial Advisors LLC | 0 | -100.00 | 0 | |||||
| 2025-07-16 | 13F | St Germain D J Co Inc | 351 | 0.00 | 22 | 5.00 | ||||
| 2025-07-22 | 13F | Merit Financial Group, LLC | 9,670 | 5.51 | 594 | 9.21 | ||||
| 2025-08-04 | 13F | Assetmark, Inc | 92 | 5.75 | 6 | 0.00 | ||||
| 2025-08-14 | 13F | Citadel Advisors Llc | 7,196 | -30.83 | 442 | -28.41 | ||||
| 2025-07-15 | 13F | Mather Group, Llc. | 0 | -100.00 | 0 | |||||
| 2025-07-16 | 13F | Essex Financial Services, Inc. | 6,004 | 0.00 | 369 | 3.37 | ||||
| 2025-08-15 | 13F | Captrust Financial Advisors | 29,604 | -12.06 | 1,817 | -8.97 | ||||
| 2025-07-22 | 13F | Olistico Wealth, LLC | 109 | 0.00 | 7 | 0.00 | ||||
| 2025-08-06 | 13F | Atlantic Union Bankshares Corp | 204 | 13 | ||||||
| 2025-08-11 | 13F | Mill Creek Capital Advisors, LLC | 9,399 | -0.35 | 577 | 3.22 | ||||
| 2025-04-30 | 13F | Axxcess Wealth Management, Llc | 0 | -100.00 | 0 | |||||
| 2025-08-05 | 13F | Prosperity Consulting Group, LLC | 44,190 | -5.37 | 2,713 | -2.06 | ||||
| 2025-08-06 | 13F | Ipsen Advisor Group LLC | 56,034 | 2.76 | 3,440 | 6.37 | ||||
| 2025-08-14 | 13F | Ameriprise Financial Inc | 50,332 | 49.57 | 3,227 | 61.75 | ||||
| 2025-09-04 | 13F/A | Advisor Group Holdings, Inc. | 9,190 | 56.03 | 563 | 61.32 | ||||
| 2025-07-16 | 13F | Perigon Wealth Management, LLC | 4,355 | 7.50 | 267 | 11.25 | ||||
| 2025-08-12 | 13F | SRS Capital Advisors, Inc. | 79 | 1.28 | 5 | 0.00 | ||||
| 2025-07-15 | 13F | Kelly Financial Group Llc | 7,780 | 17.10 | 478 | 21.37 | ||||
| 2025-07-24 | 13F | rebel Financial LLC | 6,379 | 392 | ||||||
| 2025-07-10 | 13F | Global Financial Private Client, LLC | 0 | -100.00 | 0 | |||||
| 2025-08-14 | 13F | Sunbelt Securities, Inc. | 1,075 | 0.00 | 68 | 7.94 | ||||
| 2025-08-07 | 13F | Parkside Financial Bank & Trust | 72 | 0.00 | 4 | 0.00 |