Mga Batayang Estadistika
| Pemilik Institusional | 66 total, 66 long only, 0 short only, 0 long/short - change of 1.45% MRQ |
| Alokasi Portofolio Rata-rata | 0.2230 % - change of -8.08% MRQ |
| Saham Institusional (Jangka Panjang) | 3,345,715 (ex 13D/G) - change of 0.02MM shares 0.65% MRQ |
| Nilai Institusional (Jangka Panjang) | $ 65,604 USD ($1000) |
Kepemilikan Institusional dan Pemegang Saham
Barings Corporate Investors (US:MCI) memiliki 66 pemilik institusional dan pemegang saham yang telah mengajukan formulir 13D/G atau 13F kepada Komisi Bursa Efek (Securities Exchange Commission/SEC). Lembaga-lembaga ini memegang total 3,345,715 saham. Pemegang saham terbesar meliputi BHK Investment Advisors, LLC, Curbstone Financial Management Corp, PCEF - Invesco CEF Income Composite ETF, Invesco Ltd., Global Wealth Strategies & Associates, Barings Llc, Smith Asset Management Co., LLC, Morgan Stanley, Secure Asset Management, LLC, and Janney Montgomery Scott LLC .
Struktur kepemilikan institusional Barings Corporate Investors (NYSE:MCI) menunjukkan posisi terkini di perusahaan oleh institusi dan dana, serta perubahan terbaru dalam ukuran posisi. Pemegang saham utama dapat mencakup investor individu, reksa dana, dana lindung nilai, atau institusi. Jadwal 13D menunjukkan bahwa investor memegang (atau pernah memegang) lebih dari 5% saham perusahaan dan bermaksud (atau pernah bermaksud) untuk secara aktif mengejar perubahan strategi bisnis. Jadwal 13G menunjukkan investasi pasif lebih dari 5%.
The share price as of September 5, 2025 is 21.36 / share. Previously, on September 6, 2024, the share price was 18.20 / share. This represents an increase of 17.33% over that period.

Skor Sentimen Dana
Skor Sentimen Dana (sebelumnya dikenal sebagai Skor Akumulasi Kepemilikan) menemukan saham-saham yang paling banyak dibeli oleh dana. Ini adalah hasil dari model kuantitatif multi-faktor yang canggih yang mengidentifikasi perusahaan dengan tingkat akumulasi institusional tertinggi. Model penilaian menggunakan kombinasi dari total peningkatan pemilik yang diungkapkan, perubahan dalam alokasi portofolio pada pemilik tersebut, dan metrik lainnya. Angka berkisar dari 0 hingga 100, dengan angka yang lebih tinggi menunjukkan tingkat akumulasi yang lebih tinggi dibandingkan dengan perusahaan sejenisnya, dan 50 adalah rata-ratanya.
Frekuensi Pembaruan: Setiap Hari
Lihat Ownership Explorer, yang menyediakan daftar perusahaan dengan peringkat tertinggi.
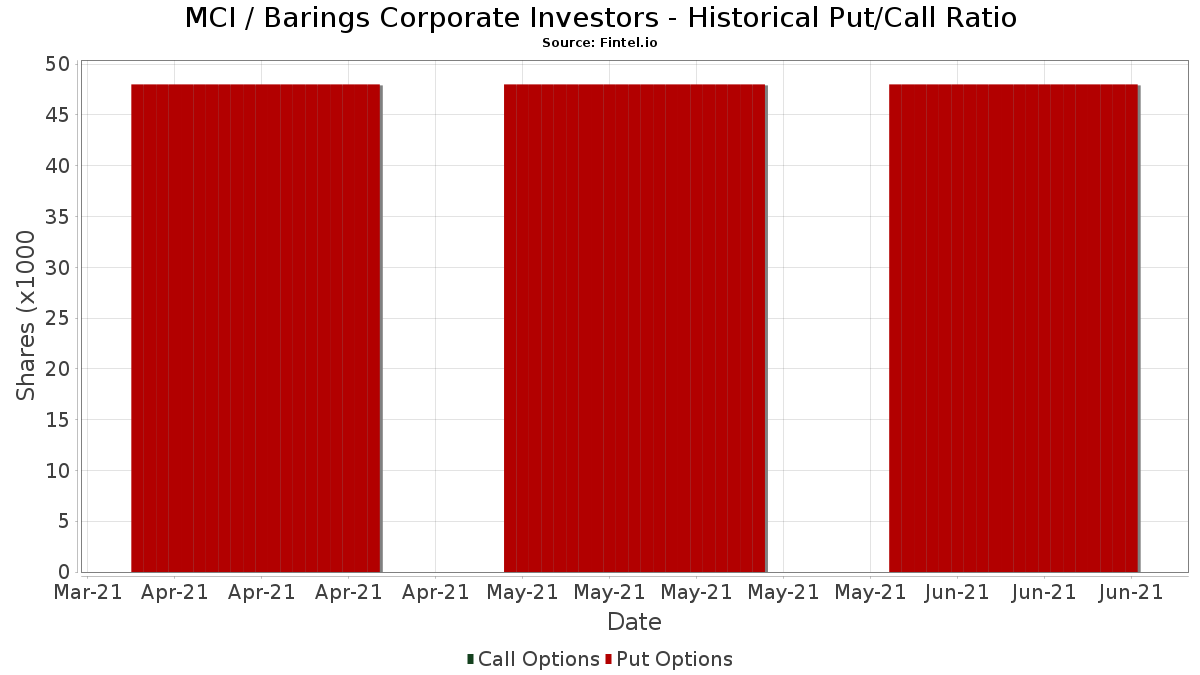
Rasio Put/Call Institusional
Selain melaporkan isu ekuitas dan utang standar, institusi dengan aset di bawah manajemen lebih dari 100 juta dolar AS juga harus mengungkapkan kepemilikan opsi put dan call mereka. Karena opsi put umumnya menunjukkan sentimen negatif, dan opsi call menunjukkan sentimen positif, kita dapat mengetahui sentimen institusional secara keseluruhan dengan memplot rasio put terhadap call. Grafik di sebelah kanan memplot rasio put/call historis untuk instrumen ini.
Menggunakan Rasio Put/Call sebagai indikator sentimen investor mengatasi salah satu kekurangan utama dari penggunaan total kepemilikan institusional, yaitu sejumlah besar aset yang dikelola diinvestasikan secara pasif untuk melacak indeks. Dana yang dikelola secara pasif biasanya tidak membeli opsi, sehingga indikator rasio put/call lebih akurat dalam melacak sentimen dana yang dikelola secara aktif.
Pengajuan 13F dan NPORT
Detail pada pengajuan 13F tersedia gratis. Detail pada pengajuan NP memerlukan keanggotaan premium. Baris berwarna hijau menunjukkan posisi baru. Baris berwarna merah menunjukkan posisi yang sudah ditutup. Klik tautan ini ikon untuk melihat riwayat transaksi selengkapnya.
Tingkatkan
untuk membuka data premium dan mengekspor ke Excel ![]() .
.
| Tanggal File | Sumber | Investor | Ketik | Presyo ng Avg (Silangan) |
Saham | Δ Saham (%) |
Dilaporkan Nilai ($1000) |
Nilai Δ (%) |
Alokasi Port (%) |
|
|---|---|---|---|---|---|---|---|---|---|---|
| 2025-08-14 | 13F | Raymond James Financial Inc | 58,794 | 16.33 | 1,273 | 7.52 | ||||
| 2025-08-12 | 13F | Proequities, Inc. | 0 | 0 | ||||||
| 2025-07-24 | 13F | Us Bancorp \de\ | 18,288 | 0.00 | 396 | -7.48 | ||||
| 2025-08-13 | 13F | EverSource Wealth Advisors, LLC | 328 | 0.00 | 7 | 0.00 | ||||
| 2025-08-13 | 13F | Beacon Pointe Advisors, LLC | 45,377 | -1.75 | 983 | -9.24 | ||||
| 2025-07-18 | 13F | Consolidated Portfolio Review Corp | 10,217 | 0.00 | 221 | -7.53 | ||||
| 2025-07-22 | 13F | DAVENPORT & Co LLC | 12,334 | 0.00 | 267 | -7.61 | ||||
| 2025-08-08 | 13F | Cetera Investment Advisers | 100,753 | 4.08 | 2,182 | -3.79 | ||||
| 2025-08-12 | 13F | LPL Financial LLC | 59,483 | 44.95 | 1,288 | 34.03 | ||||
| 2025-07-21 | 13F | Ameritas Advisory Services, LLC | 2,137 | 46 | ||||||
| 2025-07-16 | 13F | St Germain D J Co Inc | 18,105 | 56.96 | 392 | 45.19 | ||||
| 2025-07-24 | 13F | Ulland Investment Advisors, LLC | 750 | 0.00 | 0 | |||||
| 2025-08-08 | 13F | Kingsview Wealth Management, LLC | 15,306 | 332 | ||||||
| 2025-07-28 | NP | PCEF - Invesco CEF Income Composite ETF This fund is a listed as child fund of Invesco Ltd. and if that institution has disclosed ownership in this security, then these positions will not be double counted when calculating total shares and total value | 238,607 | 38.74 | 4,975 | 37.67 | ||||
| 2025-08-12 | 13F | Global Retirement Partners, LLC | 1,040 | 0.00 | 23 | 4.76 | ||||
| 2025-08-11 | 13F | TSP Capital Management Group, LLC | 1,872 | -9.09 | ||||||
| 2025-07-15 | 13F | Patriot Investment Management Inc. | 68,100 | 1,475 | ||||||
| 2025-05-21 | 13F/A | Geneos Wealth Management Inc. | 98 | -97.55 | 2 | -97.53 | ||||
| 2025-08-15 | 13F | Stonebridge Capital Advisors LLC | 13,300 | 0.00 | 288 | -7.40 | ||||
| 2025-07-25 | 13F | Atria Wealth Solutions, Inc. | 61,418 | 1.48 | 1,330 | -6.21 | ||||
| 2025-08-05 | 13F | Huntington National Bank | 258 | -7.55 | ||||||
| 2025-08-05 | 13F | GHP Investment Advisors, Inc. | 1,103 | 1.85 | 24 | -8.00 | ||||
| 2025-08-06 | 13F | Commonwealth Equity Services, Llc | 69,093 | -4.29 | 1 | 0.00 | ||||
| 2025-07-10 | 13F | Secure Asset Management, LLC | 176,900 | 4.16 | 3,832 | -3.77 | ||||
| 2025-08-14 | 13F | Mml Investors Services, Llc | 74,745 | 6.73 | 2 | 0.00 | ||||
| 2025-08-07 | 13F | Commerce Bank | 15,256 | -64.52 | 330 | -67.23 | ||||
| 2025-07-31 | 13F | Cambridge Investment Research Advisors, Inc. | 84,735 | -0.16 | 2 | 0.00 | ||||
| 2025-07-21 | 13F | Future Financial Wealth Managment LLC | 48,045 | 0.33 | 1,041 | -7.31 | ||||
| 2025-07-30 | 13F | Pittenger & Anderson Inc | 2,000 | 0.00 | 43 | -6.52 | ||||
| 2025-08-14 | 13F | Benjamin Edwards Inc | 33,305 | -3.36 | 721 | -10.66 | ||||
| 2025-08-14 | 13F | Fiduciary Trust Co | 9,986 | 0.00 | 216 | -7.69 | ||||
| 2025-08-15 | 13F | Kestra Advisory Services, LLC | 38,019 | 21.88 | 823 | 12.59 | ||||
| 2025-08-12 | 13F | Barings Llc | 219,664 | 0.00 | 4,758 | -7.60 | ||||
| 2025-07-29 | 13F | Curbstone Financial Management Corp | 297,728 | -3.66 | 6,449 | -10.98 | ||||
| 2025-08-14 | 13F | Glen Eagle Advisors, LLC | 800 | 0.00 | 17 | -5.56 | ||||
| 2025-08-07 | 13F | Montag A & Associates Inc | 9,217 | -32.68 | 200 | -37.81 | ||||
| 2025-08-13 | 13F | Mayfair Advisory Group, LLC | 10,983 | 0.00 | 223 | -13.23 | ||||
| 2025-08-06 | 13F | Round Rock Advisors, LLC | 43,966 | 7.29 | 952 | -0.83 | ||||
| 2025-07-16 | 13F | ORG Partners LLC | 800 | 0.00 | 17 | 0.00 | ||||
| 2025-07-17 | 13F | Janney Montgomery Scott LLC | 103,609 | 4.23 | 2 | 0.00 | ||||
| 2025-09-04 | 13F/A | Advisor Group Holdings, Inc. | 43,771 | 5.88 | 948 | -2.17 | ||||
| 2025-08-14 | 13F | Bank Of America Corp /de/ | 38,320 | 1.96 | 830 | -5.79 | ||||
| 2025-07-28 | 13F | Rosenberg Matthew Hamilton | 320 | 0.00 | 7 | -14.29 | ||||
| 2025-08-13 | 13F | Jones Financial Companies Lllp | 5,132 | 14.73 | 109 | 6.86 | ||||
| 2025-08-14 | 13F | Wells Fargo & Company/mn | 0 | -100.00 | 0 | -100.00 | ||||
| 2025-08-01 | 13F | Envestnet Asset Management Inc | 26,504 | 4.20 | 574 | -3.69 | ||||
| 2025-08-13 | 13F | Invesco Ltd. | 237,886 | 0.88 | 5,153 | -6.78 | ||||
| 2025-08-14 | 13F | Comerica Bank | 10,232 | 76.41 | 222 | 63.70 | ||||
| 2025-08-04 | 13F | Pensionmark Financial Group, Llc | 21,034 | 2.32 | 456 | -5.41 | ||||
| 2025-04-24 | 13F | Money Concepts Capital Corp | 0 | -100.00 | 0 | |||||
| 2025-05-19 | 13F | Smith Asset Management Co., LLC | 217,070 | -0.32 | 5,088 | 14.67 | ||||
| 2025-08-13 | 13F | StoneX Group Inc. | 0 | -100.00 | 0 | -100.00 | ||||
| 2025-07-07 | 13F | Global Wealth Strategies & Associates | 226,071 | 3.34 | 4,897 | -4.51 | ||||
| 2025-07-18 | 13F | Trust Co Of Vermont | 888 | 0.00 | 19 | -5.00 | ||||
| 2025-08-14 | 13F | Royal Bank Of Canada | 4,057 | -1.34 | 88 | -8.33 | ||||
| 2025-08-14 | 13F | MGB Wealth Management, LLC | 21,167 | 19.76 | 457 | 15.11 | ||||
| 2025-08-12 | 13F | PKS Advisory Services, LLC | 0 | -100.00 | 0 | |||||
| 2025-07-11 | 13F | Caldwell Securities, Inc | 84,614 | 0.00 | 1,833 | -7.61 | ||||
| 2025-08-11 | 13F | Vanguard Group Inc | 30,100 | 0.00 | 652 | -7.66 | ||||
| 2025-07-10 | 13F | Sky Investment Group LLC | 3,677 | -7.71 | ||||||
| 2025-08-08 | 13F | Fortis Group Advisors, LLC | 425 | 0.00 | 9 | 0.00 | ||||
| 2025-07-29 | 13F | Dumont & Blake Investment Advisors Llc | 10,163 | 0.00 | 220 | -7.56 | ||||
| 2025-08-14 | 13F | GWM Advisors LLC | 200 | -99.18 | 4 | -99.30 | ||||
| 2025-08-07 | 13F | BHK Investment Advisors, LLC | 362,189 | 9.18 | 7,845 | 0.89 | ||||
| 2025-08-14 | 13F | Colony Group, LLC | 19,238 | 417 | ||||||
| 2025-08-15 | 13F | Morgan Stanley | 189,547 | -6.29 | 4,106 | -13.41 | ||||
| 2025-07-31 | 13F | Whipplewood Advisors, LLC | 2,613 | 773.91 | 57 | -85.79 | ||||
| 2025-08-12 | 13F | Steward Partners Investment Advisory, Llc | 1,425 | 0.00 | 31 | -9.09 | ||||
| 2025-08-12 | 13F | CIBC Private Wealth Group, LLC | 750 | 0.00 | 16 | 6.67 | ||||
| 2025-08-07 | 13F | BOK Financial Private Wealth, Inc. | 3,000 | 0.00 | 65 | -8.57 | ||||
| 2025-08-14 | 13F | UBS Group AG | 17,448 | -13.44 | 378 | -20.13 | ||||
| 2025-07-09 | 13F | Wolff Financial Management Llc | 0 | -100.00 | 0 | |||||
| 2025-07-11 | 13F | Farther Finance Advisors, LLC | 20,814 | 451 | ||||||
| 2025-07-24 | 13F | IFP Advisors, Inc | 500 | -94.90 | 11 | -95.63 | ||||
| 2025-07-15 | 13F | Graypoint LLC | 24,455 | 1.98 | 530 | -5.87 | ||||
| 2025-08-14 | 13F | Susquehanna International Group, Llp | 0 | -100.00 | 0 |