Mga Batayang Estadistika
| Pemilik Institusional | 120 total, 120 long only, 0 short only, 0 long/short - change of 1.69% MRQ |
| Alokasi Portofolio Rata-rata | 0.3548 % - change of 9.62% MRQ |
| Saham Institusional (Jangka Panjang) | 37,553,441 (ex 13D/G) - change of 8.27MM shares 28.23% MRQ |
| Nilai Institusional (Jangka Panjang) | $ 880,893 USD ($1000) |
Kepemilikan Institusional dan Pemegang Saham
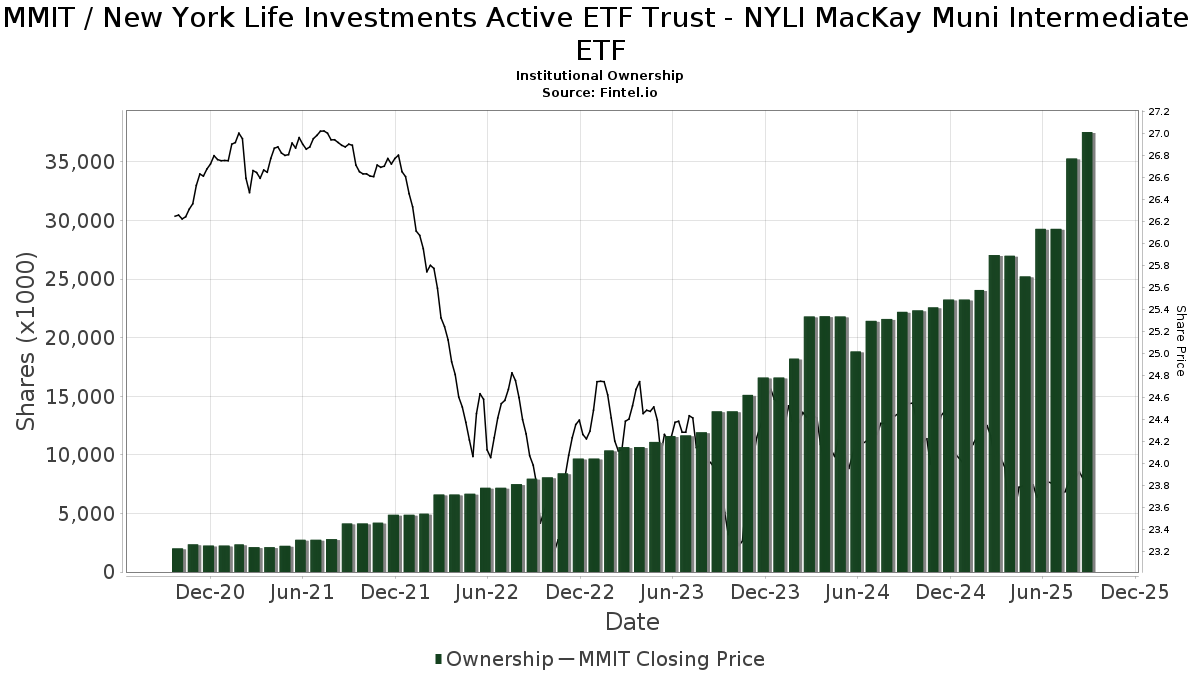
New York Life Investments Active ETF Trust - NYLI MacKay Muni Intermediate ETF (US:MMIT) memiliki 120 pemilik institusional dan pemegang saham yang telah mengajukan formulir 13D/G atau 13F kepada Komisi Bursa Efek (Securities Exchange Commission/SEC). Lembaga-lembaga ini memegang total 37,553,441 saham. Pemegang saham terbesar meliputi Orgel Wealth Management, LLC, Bank Of America Corp /de/, Morgan Stanley, Meeder Advisory Services, Inc., Schneider Downs Wealth Management Advisors, LP, Cetera Investment Advisers, Raymond James Financial Inc, UBS Group AG, LPL Financial LLC, and Avantax Planning Partners, Inc. .
Struktur kepemilikan institusional New York Life Investments Active ETF Trust - NYLI MacKay Muni Intermediate ETF (ARCA:MMIT) menunjukkan posisi terkini di perusahaan oleh institusi dan dana, serta perubahan terbaru dalam ukuran posisi. Pemegang saham utama dapat mencakup investor individu, reksa dana, dana lindung nilai, atau institusi. Jadwal 13D menunjukkan bahwa investor memegang (atau pernah memegang) lebih dari 5% saham perusahaan dan bermaksud (atau pernah bermaksud) untuk secara aktif mengejar perubahan strategi bisnis. Jadwal 13G menunjukkan investasi pasif lebih dari 5%.
The share price as of September 5, 2025 is 24.07 / share. Previously, on September 9, 2024, the share price was 24.50 / share. This represents a decline of 1.76% over that period.
Skor Sentimen Dana
Skor Sentimen Dana (sebelumnya dikenal sebagai Skor Akumulasi Kepemilikan) menemukan saham-saham yang paling banyak dibeli oleh dana. Ini adalah hasil dari model kuantitatif multi-faktor yang canggih yang mengidentifikasi perusahaan dengan tingkat akumulasi institusional tertinggi. Model penilaian menggunakan kombinasi dari total peningkatan pemilik yang diungkapkan, perubahan dalam alokasi portofolio pada pemilik tersebut, dan metrik lainnya. Angka berkisar dari 0 hingga 100, dengan angka yang lebih tinggi menunjukkan tingkat akumulasi yang lebih tinggi dibandingkan dengan perusahaan sejenisnya, dan 50 adalah rata-ratanya.
Frekuensi Pembaruan: Setiap Hari
Lihat Ownership Explorer, yang menyediakan daftar perusahaan dengan peringkat tertinggi.
Rasio Put/Call Institusional
Selain melaporkan isu ekuitas dan utang standar, institusi dengan aset di bawah manajemen lebih dari 100 juta dolar AS juga harus mengungkapkan kepemilikan opsi put dan call mereka. Karena opsi put umumnya menunjukkan sentimen negatif, dan opsi call menunjukkan sentimen positif, kita dapat mengetahui sentimen institusional secara keseluruhan dengan memplot rasio put terhadap call. Grafik di sebelah kanan memplot rasio put/call historis untuk instrumen ini.
Menggunakan Rasio Put/Call sebagai indikator sentimen investor mengatasi salah satu kekurangan utama dari penggunaan total kepemilikan institusional, yaitu sejumlah besar aset yang dikelola diinvestasikan secara pasif untuk melacak indeks. Dana yang dikelola secara pasif biasanya tidak membeli opsi, sehingga indikator rasio put/call lebih akurat dalam melacak sentimen dana yang dikelola secara aktif.
Pengajuan 13F dan NPORT
Detail pada pengajuan 13F tersedia gratis. Detail pada pengajuan NP memerlukan keanggotaan premium. Baris berwarna hijau menunjukkan posisi baru. Baris berwarna merah menunjukkan posisi yang sudah ditutup. Klik tautan ini ikon untuk melihat riwayat transaksi selengkapnya.
Tingkatkan
untuk membuka data premium dan mengekspor ke Excel ![]() .
.
| Tanggal File | Sumber | Investor | Ketik | Presyo ng Avg (Silangan) |
Saham | Δ Saham (%) |
Dilaporkan Nilai ($1000) |
Nilai Δ (%) |
Alokasi Port (%) |
|
|---|---|---|---|---|---|---|---|---|---|---|
| 2025-08-08 | 13F | Condor Capital Management | 461,713 | 11,012 | ||||||
| 2025-08-14 | 13F | Peapack Gladstone Financial Corp | 0 | -100.00 | 0 | |||||
| 2025-07-09 | 13F | Dynamic Advisor Solutions LLC | 355,902 | -10.31 | 8,488 | -10.76 | ||||
| 2025-08-14 | 13F | Visionary Wealth Advisors | 12,683 | 0.95 | 302 | 0.33 | ||||
| 2025-08-11 | 13F | Vista Cima Wealth Management LLC | 19,970 | 0.00 | 476 | -0.42 | ||||
| 2025-08-05 | 13F | Elyxium Wealth, LLC | 86,302 | 127.69 | 2,058 | 126.65 | ||||
| 2025-08-01 | 13F/A | GGM Financials LLC | 113,950 | 244.73 | 2,718 | 243.06 | ||||
| 2025-07-14 | 13F | Friday Financial | 14,083 | -1.04 | 336 | -1.47 | ||||
| 2025-08-13 | 13F | Flow Traders U.s. Llc | 28,129 | 1 | ||||||
| 2025-07-14 | 13F | Park Avenue Securities Llc | 47,737 | 2.79 | 1 | 0.00 | ||||
| 2025-08-11 | 13F | Elequin Capital Lp | 27,641 | 659 | ||||||
| 2025-09-04 | 13F/A | Advisor Group Holdings, Inc. | 362,887 | 96.67 | 8,655 | 95.70 | ||||
| 2025-07-18 | 13F | Vicus Capital | 308,869 | 35.15 | 7,367 | 34.49 | ||||
| 2025-08-27 | 13F/A | Brinker Capital Investments, LLC | 456,989 | 4.07 | 10,899 | 3.55 | ||||
| 2025-08-13 | 13F | Jones Financial Companies Lllp | 1,393 | 33 | ||||||
| 2025-04-25 | 13F | Smallwood Wealth Investment Management, LLC | 98,313 | 14.25 | 2,357 | 14.04 | ||||
| 2025-08-05 | 13F | NewSquare Capital LLC | 23,574 | 2.77 | 562 | 2.37 | ||||
| 2025-08-15 | 13F | Morgan Stanley | 2,496,217 | -2.97 | 59,535 | -3.46 | ||||
| 2025-07-14 | 13F | Golden State Equity Partners | 18,461 | 7.81 | 440 | 7.32 | ||||
| 2025-08-14 | 13F | Royal Bank Of Canada | 401,594 | 310.48 | 9,578 | 308.44 | ||||
| 2025-08-11 | 13F | Private Advisor Group, LLC | 75,091 | -46.85 | 1,791 | -47.14 | ||||
| 2025-07-31 | 13F | Schneider Downs Wealth Management Advisors, LP | 1,838,266 | 4.40 | 43,843 | 3.88 | ||||
| 2025-05-15 | 13F | Gts Securities Llc | 0 | -100.00 | 0 | |||||
| 2025-08-04 | 13F | Daymark Wealth Partners, Llc | 10,420 | 249 | ||||||
| 2025-08-07 | 13F | Midwest Trust Co | 581,489 | 13,869 | ||||||
| 2025-08-14 | 13F | Jane Street Group, Llc | 214,396 | -50.98 | 5,113 | -51.23 | ||||
| 2025-08-04 | 13F | Atria Investments Llc | 16,138 | 13.30 | 385 | 12.61 | ||||
| 2025-08-13 | 13F | Level Four Advisory Services, Llc | 17,577 | -1.86 | 419 | -2.33 | ||||
| 2025-08-07 | 13F | PFG Advisors | 58,777 | 18.53 | 1,402 | 17.93 | ||||
| 2025-07-25 | 13F | Landmark Wealth Management, LLC | 59,785 | -29.09 | 1 | -50.00 | ||||
| 2025-07-14 | 13F | Brady Martz Wealth Solutions, LLC | 206,903 | -13.25 | 4,935 | -13.68 | ||||
| 2025-07-18 | 13F | Bartlett & Co. Wealth Management Llc | 5,060 | -20.81 | 121 | -21.57 | ||||
| 2025-08-05 | 13F | Tsfg, Llc | 5,409 | 0.11 | 0 | |||||
| 2025-08-11 | 13F | Pineridge Advisors LLC | 8,091 | -9.43 | 193 | -10.28 | ||||
| 2025-07-10 | 13F | Orgel Wealth Management, LLC | 5,909,226 | 140,935 | ||||||
| 2025-07-07 | 13F | TruWealth Advisors, LLC | 691,196 | 1.35 | 16,485 | 0.84 | ||||
| 2025-07-09 | 13F | Burt Wealth Advisors | 70,430 | 137.30 | 1,680 | 136.15 | ||||
| 2025-08-14 | 13F | GWM Advisors LLC | 18,920 | 108.21 | 451 | 107.83 | ||||
| 2025-08-13 | 13F | Bernardo Wealth Planning LLC | 144,828 | -11.64 | 3 | 0.00 | ||||
| 2025-07-16 | 13F | Evergreen Private Wealth LLC | 65,745 | -1.02 | 1,568 | -1.51 | ||||
| 2025-08-04 | 13F | Assetmark, Inc | 4,185 | 81.72 | 100 | 80.00 | ||||
| 2025-08-06 | 13F | AE Wealth Management LLC | 10,917 | 13.75 | 260 | 13.04 | ||||
| 2025-08-14 | 13F | Wells Fargo & Company/mn | 4,878 | 116 | ||||||
| 2025-08-05 | 13F | GPS Wealth Strategies Group, LLC | 0 | -100.00 | 0 | |||||
| 2025-05-16 | 13F | Coppell Advisory Solutions LLC | 0 | -100.00 | 0 | |||||
| 2025-07-25 | 13F | Atria Wealth Solutions, Inc. | 31,248 | 15.81 | 745 | 15.33 | ||||
| 2025-07-31 | 13F | Opes Wealth Management LLC | 39,255 | 9.03 | 936 | 8.46 | ||||
| 2025-07-15 | 13F | BCS Wealth Management | 22,762 | -36.82 | 1 | |||||
| 2025-08-12 | 13F | Steward Partners Investment Advisory, Llc | 3,000 | -18.26 | 72 | -18.39 | ||||
| 2025-07-28 | 13F | Harbour Investments, Inc. | 0 | -100.00 | 0 | |||||
| 2025-08-08 | 13F | CFO4Life Group, LLC | 411,040 | 26.90 | 9,803 | 26.28 | ||||
| 2025-08-07 | 13F | Meeder Advisory Services, Inc. | 1,910,061 | 11.99 | 45,555 | 11.43 | ||||
| 2025-08-12 | 13F | Jpmorgan Chase & Co | 196,002 | 36.11 | 4,675 | 35.44 | ||||
| 2025-08-04 | 13F | Amplius Wealth Advisors, LLC | 20,092 | -27.43 | 479 | -27.75 | ||||
| 2025-08-06 | 13F | Commonwealth Equity Services, Llc | 141,061 | -1.71 | 3 | 0.00 | ||||
| 2025-08-14 | 13F | Hrt Financial Lp | 0 | -100.00 | 0 | |||||
| 2025-08-06 | 13F | Golden State Wealth Management, LLC | 80,395 | -1.10 | 1,917 | -1.59 | ||||
| 2025-08-14 | 13F | Great Valley Advisor Group, Inc. | 412,212 | -2.25 | 9,831 | -2.75 | ||||
| 2025-08-15 | 13F | Captrust Financial Advisors | 61,136 | -32.22 | 1,458 | -32.53 | ||||
| 2025-08-14 | 13F | Mariner, LLC | 66,024 | -4.92 | 1,575 | -5.41 | ||||
| 2025-08-08 | 13F | Evolution Wealth Advisors, LLC | 30,413 | 0.00 | 725 | -0.55 | ||||
| 2025-08-12 | 13F | Proequities, Inc. | 0 | 0 | ||||||
| 2025-08-14 | 13F | Mml Investors Services, Llc | 102,075 | -3.70 | 2 | 0.00 | ||||
| 2025-05-15 | 13F/A | Orion Portfolio Solutions, LLC | 439,103 | 10,525 | ||||||
| 2025-08-15 | 13F | Kestra Advisory Services, LLC | 9,019 | -53.62 | 215 | -53.86 | ||||
| 2025-08-08 | 13F | Avantax Advisory Services, Inc. | 10,575 | 252 | ||||||
| 2025-07-30 | 13F | Caliber Wealth Management, LLC / KS | 16,694 | 0.00 | 398 | -0.50 | ||||
| 2025-08-26 | 13F/A | Thrivent Financial For Lutherans | 0 | -100.00 | 0 | |||||
| 2025-05-14 | 13F | Susquehanna International Group, Llp | 0 | -100.00 | 0 | |||||
| 2025-07-31 | 13F | New Hampshire Trust | 9,494 | -68.97 | 226 | -69.17 | ||||
| 2025-08-05 | 13F | Bank of New York Mellon Corp | 301,516 | -1.56 | 7,191 | -2.04 | ||||
| 2025-08-13 | 13F | Kuhn & Co Investment Counsel | 77,193 | 3.92 | 1,841 | 3.43 | ||||
| 2025-08-14 | 13F | Synovus Financial Corp | 10,480 | -5.54 | 250 | -6.04 | ||||
| 2025-08-11 | 13F | Anderson Financial Strategies, LLC | 0 | -100.00 | 0 | |||||
| 2025-08-13 | 13F | Vertex Planning Partners, LLC | 11,335 | 0.00 | 270 | -0.37 | ||||
| 2025-08-14 | 13F | Bank Of America Corp /de/ | 4,543,656 | 9.71 | 108,366 | 9.16 | ||||
| 2025-08-11 | 13F | Avantax Planning Partners, Inc. | 1,320,615 | 90.75 | 31,497 | 89.79 | ||||
| 2025-07-17 | 13F | Saxon Interests, Inc. | 30,995 | 0.00 | 743 | 0.00 | ||||
| 2025-07-31 | 13F | Cambridge Investment Research Advisors, Inc. | 8,939 | 0 | ||||||
| 2025-08-08 | 13F | Fortis Group Advisors, LLC | 28,799 | 25.31 | 685 | 24.36 | ||||
| 2025-08-11 | 13F | Invenio Wealth Partners Llc | 300,375 | 7,164 | ||||||
| 2025-08-12 | 13F | J.w. Cole Advisors, Inc. | 15,558 | 1.16 | 371 | 0.82 | ||||
| 2025-08-08 | 13F/A | Sequoia Financial Advisors, LLC | 0 | -100.00 | 0 | |||||
| 2025-07-18 | 13F | Truist Financial Corp | 288,933 | 0.98 | 6,891 | 0.48 | ||||
| 2025-07-23 | 13F | Clear Creek Financial Management, LLC | 14,468 | 0.00 | 345 | -0.29 | ||||
| 2025-08-13 | 13F | Northwestern Mutual Wealth Management Co | 4,056 | 16.82 | 97 | 15.66 | ||||
| 2025-08-08 | 13F | Cornerstone Advisors Asset Management, Inc | 463,423 | -2.23 | 11,053 | -2.72 | ||||
| 2025-08-14 | 13F | Old Mission Capital Llc | 32,862 | 24.58 | 784 | 23.89 | ||||
| 2025-07-14 | 13F | AdvisorNet Financial, Inc | 84,400 | -2.06 | 2,013 | -2.57 | ||||
| 2025-07-21 | 13F | Ameritas Advisory Services, LLC | 3,319 | 79 | ||||||
| 2025-07-10 | 13F | Legacy Financial Strategies, LLC | 77,814 | 1.45 | 1,856 | 0.92 | ||||
| 2025-08-13 | 13F | VestGen Advisors, LLC | 113,586 | 20.18 | 2,705 | 19.43 | ||||
| 2025-08-14 | 13F | Citadel Advisors Llc | 0 | -100.00 | 0 | |||||
| 2025-08-14 | 13F | Comerica Bank | 41,146 | 34.96 | 981 | 34.38 | ||||
| 2025-07-10 | 13F | Wealth Enhancement Advisory Services, Llc | 23,656 | 59.37 | 563 | 58.59 | ||||
| 2025-07-28 | 13F | Axxcess Wealth Management, Llc | 40,161 | 4.10 | 958 | 3.57 | ||||
| 2025-07-22 | 13F | DAVENPORT & Co LLC | 17,073 | 1.83 | 407 | 1.50 | ||||
| 2025-08-01 | 13F | Financial Counselors Inc | 0 | -100.00 | 0 | |||||
| 2025-08-11 | 13F | HighTower Advisors, LLC | 22,105 | 527 | ||||||
| 2025-08-08 | 13F | Cetera Investment Advisers | 1,702,735 | 2.31 | 40,610 | 1.79 | ||||
| 2025-07-29 | 13F | Swmg, Llc | 31,643 | -0.16 | 751 | 0.00 | ||||
| 2025-08-14 | 13F | Raymond James Financial Inc | 1,586,989 | -13.74 | 37,850 | -14.17 | ||||
| 2025-08-01 | 13F | Envestnet Asset Management Inc | 589,199 | 8.44 | 14,052 | 7.90 | ||||
| 2025-08-14 | 13F | Goldman Sachs Group Inc | 80,600 | 1,922 | ||||||
| 2025-07-21 | 13F | Kennebec Savings Bank | 10,039 | 0.00 | 239 | -0.42 | ||||
| 2025-07-17 | 13F | Janney Capital Management LLC | 58,723 | -1.04 | 1 | 0.00 | ||||
| 2025-08-12 | 13F | CIBC Private Wealth Group, LLC | 1 | 0.00 | 0 | |||||
| 2025-08-14 | 13F | Stifel Financial Corp | 167,239 | -10.38 | 3,989 | -10.84 | ||||
| 2025-08-11 | 13F | Western Wealth Management, LLC | 27,631 | 2.76 | 659 | 2.33 | ||||
| 2025-07-25 | 13F | Bill Few Associates, Inc. | 13,132 | 0.00 | 313 | -0.32 | ||||
| 2025-08-12 | 13F | Journey Strategic Wealth Llc | 117,986 | -7.13 | 2,814 | -7.62 | ||||
| 2025-08-14 | 13F/A | Rockefeller Capital Management L.P. | 20,844 | 0.61 | 497 | 0.20 | ||||
| 2025-08-14 | 13F | UBS Group AG | 1,405,478 | -11.65 | 33,521 | -12.09 | ||||
| 2025-08-14 | 13F | Prestige Wealth Management Group LLC | 259,805 | -5.68 | 6,196 | -6.15 | ||||
| 2025-07-09 | 13F | Massmutual Trust Co Fsb/adv | 417,115 | 38.92 | 9,948 | 38.24 | ||||
| 2025-08-14 | 13F | TCG Advisory Services, LLC | 10,991 | -30.96 | 262 | -31.23 | ||||
| 2025-07-31 | 13F | Buckingham Strategic Partners | 220,986 | -12.56 | 5,271 | -12.99 | ||||
| 2025-07-24 | 13F | Lokken Investment Group LLC | 15,410 | 52.17 | 368 | 51.65 | ||||
| 2025-08-12 | 13F | Frontier Asset Management, LLC | 38,894 | -3.94 | 928 | -4.43 | ||||
| 2025-08-13 | 13F | IAG Wealth Partners, LLC | 999,094 | -8.13 | 23,828 | -8.59 | ||||
| 2025-07-11 | 13F | Farther Finance Advisors, LLC | 0 | -100.00 | 0 | |||||
| 2025-08-12 | 13F | Titleist Asset Management, Llc | 36,209 | 1.21 | 864 | 0.70 | ||||
| 2025-08-12 | 13F | Global Retirement Partners, LLC | 458 | 0.00 | 11 | 0.00 | ||||
| 2025-08-12 | 13F | LPL Financial LLC | 1,345,146 | 13.83 | 32,082 | 13.26 | ||||
| 2025-08-14 | 13F | Main Street Financial Solutions, LLC | 267,310 | -1.71 | 6,375 | -2.19 | ||||
| 2025-07-14 | 13F | Narus Financial Partners, LLC | 40,038 | -5.06 | 955 | -5.54 | ||||
| 2025-08-08 | 13F | Wiser Advisor Group LLC | 0 | -100.00 | 0 | |||||
| 2025-07-10 | 13F | Cypress Point Wealth Management, LLC | 130,965 | -3.10 | 3,124 | -3.58 | ||||
| 2025-08-07 | 13F | Allworth Financial LP | 390 | 0.00 | 9 | 0.00 | ||||
| 2025-08-14 | 13F | Snowden Capital Advisors LLC | 61,588 | 27.95 | 1,469 | 27.32 | ||||
| 2025-07-21 | 13F | Curran Financial Partners, LLC | 23,903 | -10.12 | 570 | -10.52 | ||||
| 2025-07-09 | 13F | Pallas Capital Advisors LLC | 576,031 | -6.90 | 13,738 | -7.36 | ||||
| 2025-05-01 | 13F | Cwm, Llc | 0 | -100.00 | 0 | |||||
| 2025-08-12 | 13F | PKS Advisory Services, LLC | 38,951 | 10.13 | 929 | 9.56 | ||||
| 2025-08-11 | 13F | Principal Securities, Inc. | 5,562 | 4.39 | 133 | 3.94 | ||||
| 2025-08-13 | 13F | WCG Wealth Advisors LLC | 10,098 | -0.35 | 241 | -0.83 |