Mga Batayang Estadistika
| Pemilik Institusional | 95 total, 95 long only, 0 short only, 0 long/short - change of -2.04% MRQ |
| Alokasi Portofolio Rata-rata | 0.0315 % - change of -12.77% MRQ |
| Saham Institusional (Jangka Panjang) | 1,281,226 (ex 13D/G) - change of -0.05MM shares -3.69% MRQ |
| Nilai Institusional (Jangka Panjang) | $ 79,577 USD ($1000) |
Kepemilikan Institusional dan Pemegang Saham
Invesco Exchange-Traded Fund Trust - Invesco Biotechnology & Genome ETF (US:PBE) memiliki 95 pemilik institusional dan pemegang saham yang telah mengajukan formulir 13D/G atau 13F kepada Komisi Bursa Efek (Securities Exchange Commission/SEC). Lembaga-lembaga ini memegang total 1,281,226 saham. Pemegang saham terbesar meliputi Gerber Kawasaki Wealth & Investment Management, Morgan Stanley, LPL Financial LLC, UBS Group AG, Royal Bank Of Canada, Wells Fargo & Company/mn, Bank Of America Corp /de/, Goldman Sachs Group Inc, Commonwealth Equity Services, Llc, and YHB Investment Advisors, Inc. .
Struktur kepemilikan institusional Invesco Exchange-Traded Fund Trust - Invesco Biotechnology & Genome ETF (ARCA:PBE) menunjukkan posisi terkini di perusahaan oleh institusi dan dana, serta perubahan terbaru dalam ukuran posisi. Pemegang saham utama dapat mencakup investor individu, reksa dana, dana lindung nilai, atau institusi. Jadwal 13D menunjukkan bahwa investor memegang (atau pernah memegang) lebih dari 5% saham perusahaan dan bermaksud (atau pernah bermaksud) untuk secara aktif mengejar perubahan strategi bisnis. Jadwal 13G menunjukkan investasi pasif lebih dari 5%.
The share price as of September 5, 2025 is 70.99 / share. Previously, on September 6, 2024, the share price was 68.02 / share. This represents an increase of 4.36% over that period.

Skor Sentimen Dana
Skor Sentimen Dana (sebelumnya dikenal sebagai Skor Akumulasi Kepemilikan) menemukan saham-saham yang paling banyak dibeli oleh dana. Ini adalah hasil dari model kuantitatif multi-faktor yang canggih yang mengidentifikasi perusahaan dengan tingkat akumulasi institusional tertinggi. Model penilaian menggunakan kombinasi dari total peningkatan pemilik yang diungkapkan, perubahan dalam alokasi portofolio pada pemilik tersebut, dan metrik lainnya. Angka berkisar dari 0 hingga 100, dengan angka yang lebih tinggi menunjukkan tingkat akumulasi yang lebih tinggi dibandingkan dengan perusahaan sejenisnya, dan 50 adalah rata-ratanya.
Frekuensi Pembaruan: Setiap Hari
Lihat Ownership Explorer, yang menyediakan daftar perusahaan dengan peringkat tertinggi.
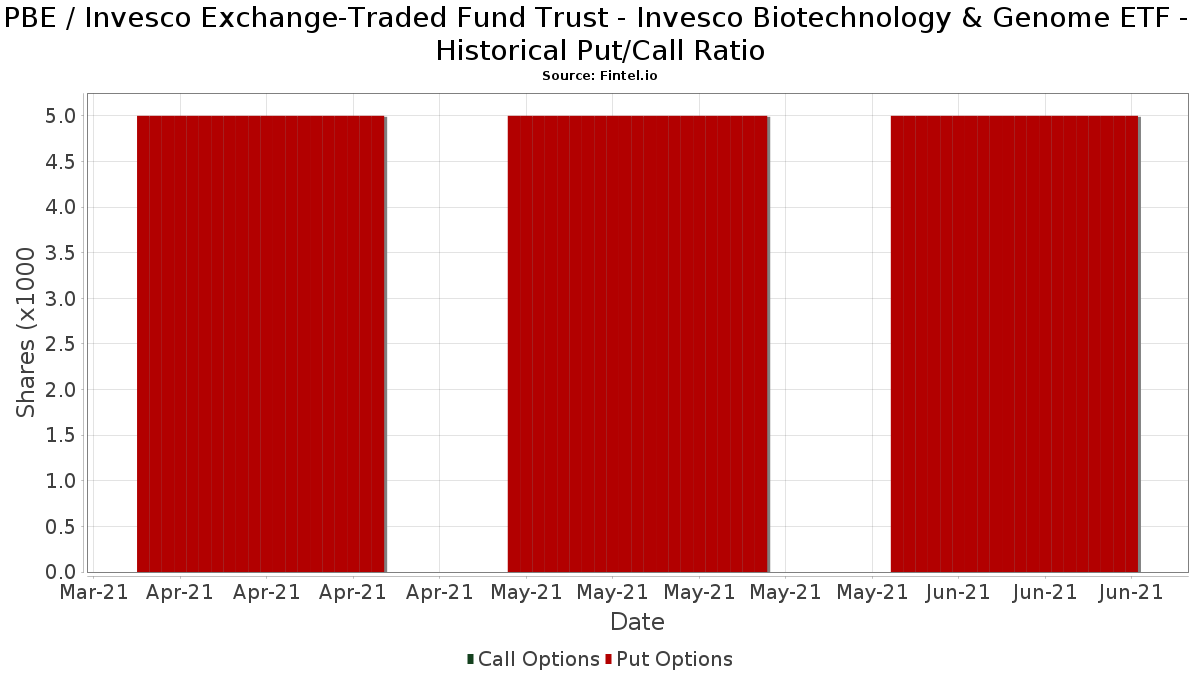
Rasio Put/Call Institusional
Selain melaporkan isu ekuitas dan utang standar, institusi dengan aset di bawah manajemen lebih dari 100 juta dolar AS juga harus mengungkapkan kepemilikan opsi put dan call mereka. Karena opsi put umumnya menunjukkan sentimen negatif, dan opsi call menunjukkan sentimen positif, kita dapat mengetahui sentimen institusional secara keseluruhan dengan memplot rasio put terhadap call. Grafik di sebelah kanan memplot rasio put/call historis untuk instrumen ini.
Menggunakan Rasio Put/Call sebagai indikator sentimen investor mengatasi salah satu kekurangan utama dari penggunaan total kepemilikan institusional, yaitu sejumlah besar aset yang dikelola diinvestasikan secara pasif untuk melacak indeks. Dana yang dikelola secara pasif biasanya tidak membeli opsi, sehingga indikator rasio put/call lebih akurat dalam melacak sentimen dana yang dikelola secara aktif.
Pengajuan 13F dan NPORT
Detail pada pengajuan 13F tersedia gratis. Detail pada pengajuan NP memerlukan keanggotaan premium. Baris berwarna hijau menunjukkan posisi baru. Baris berwarna merah menunjukkan posisi yang sudah ditutup. Klik tautan ini ikon untuk melihat riwayat transaksi selengkapnya.
Tingkatkan
untuk membuka data premium dan mengekspor ke Excel ![]() .
.
| Tanggal File | Sumber | Investor | Ketik | Presyo ng Avg (Silangan) |
Saham | Δ Saham (%) |
Dilaporkan Nilai ($1000) |
Nilai Δ (%) |
Alokasi Port (%) |
|
|---|---|---|---|---|---|---|---|---|---|---|
| 2025-08-14 | 13F | Bank Of America Corp /de/ | 58,465 | -11.35 | 3,748 | -10.42 | ||||
| 2025-07-11 | 13F | Farther Finance Advisors, LLC | 8,557 | -0.68 | 549 | 2.62 | ||||
| 2025-08-04 | 13F | Assetmark, Inc | 325 | 0.00 | 21 | 0.00 | ||||
| 2025-07-25 | 13F | Cwm, Llc | 3,431 | 0.03 | 0 | |||||
| 2025-08-12 | 13F | BlackRock, Inc. | 663 | 0.00 | 42 | 0.00 | ||||
| 2025-07-30 | 13F | Pacific Sun Financial Corp | 5,618 | -7.03 | 360 | -6.01 | ||||
| 2025-04-29 | 13F | Strategic Blueprint, LLC | 0 | -100.00 | 0 | |||||
| 2025-08-12 | 13F | Change Path, LLC | 15,333 | -14.34 | 983 | -13.48 | ||||
| 2025-07-17 | 13F | Robbins Farley Llc | 3 | 0.00 | 0 | |||||
| 2025-08-11 | 13F | Blue Bell Private Wealth Management, Llc | 21 | 0.00 | 1 | 0.00 | ||||
| 2025-08-14 | 13F/A | Rockefeller Capital Management L.P. | 10,000 | 0.00 | 641 | 1.10 | ||||
| 2025-08-15 | 13F | Kestra Advisory Services, LLC | 5,970 | -12.97 | 383 | -12.18 | ||||
| 2025-08-08 | 13F | Cetera Investment Advisers | 20,398 | -3.41 | 1,308 | -2.39 | ||||
| 2025-08-07 | 13F | LOM Asset Management Ltd | 300 | 0 | ||||||
| 2025-08-14 | 13F | IHT Wealth Management, LLC | 15,339 | -1.37 | 983 | -0.30 | ||||
| 2025-08-12 | 13F | Steward Partners Investment Advisory, Llc | 825 | 1.73 | 53 | 1.96 | ||||
| 2025-08-14 | 13F | Susquehanna International Group, Llp | 6,498 | 25.98 | 417 | 27.22 | ||||
| 2025-08-11 | 13F | HighTower Advisors, LLC | 6,886 | 0.35 | 441 | 1.38 | ||||
| 2025-08-13 | 13F | VestGen Advisors, LLC | 4,704 | -6.85 | 313 | -2.50 | ||||
| 2025-07-02 | 13F | Capital Market Strategies LLC | 3,627 | -2.68 | 232 | -1.69 | ||||
| 2025-08-04 | 13F | Flagship Harbor Advisors, Llc | 5,100 | 0.00 | 327 | 0.93 | ||||
| 2025-07-11 | 13F | First PREMIER Bank | 670 | 0.00 | 0 | |||||
| 2025-07-10 | 13F | Wealth Enhancement Advisory Services, Llc | 4,751 | -34.40 | 312 | -32.24 | ||||
| 2025-08-13 | 13F | Millstone Evans Group, LLC | 1,684 | 0.00 | 108 | 0.94 | ||||
| 2025-08-15 | 13F | Morgan Stanley | 191,173 | -0.87 | 12,254 | 0.16 | ||||
| 2025-08-14 | 13F | Abbot Financial Management, Inc. | 12,725 | -3.60 | 816 | -2.63 | ||||
| 2025-08-11 | 13F | Banque Cantonale Vaudoise | 530 | 0.00 | 0 | |||||
| 2025-08-13 | 13F | GeoWealth Management, LLC | 2,832 | -5.35 | 182 | -4.23 | ||||
| 2025-04-21 | 13F | Ronald Blue Trust, Inc. | 0 | -100.00 | 0 | -100.00 | ||||
| 2025-07-22 | 13F | Penobscot Investment Management Company, Inc. | 19,450 | 0.00 | 1,247 | 1.05 | ||||
| 2025-07-08 | 13F | Webster Bank, N. A. | 1,670 | 0.00 | 107 | 1.90 | ||||
| 2025-08-12 | 13F | Ameritas Investment Partners, Inc. | 70 | 0.00 | 4 | 0.00 | ||||
| 2025-08-13 | 13F | Northwestern Mutual Wealth Management Co | 3,729 | -2.07 | 239 | -0.83 | ||||
| 2025-07-23 | 13F | Massachusetts Wealth Management | 18,394 | 1.04 | 1,179 | 2.17 | ||||
| 2025-08-13 | 13F | Financial Avengers, Inc. | 200 | 0.00 | 13 | 0.00 | ||||
| 2025-04-01 | 13F | Massmutual Trust Co Fsb/adv | 0 | -100.00 | 0 | |||||
| 2025-07-01 | 13F | Harbor Investment Advisory, Llc | 150 | 0.00 | 10 | 0.00 | ||||
| 2025-08-13 | 13F | Capital Analysts, Inc. | 1,715 | 0.00 | 0 | |||||
| 2025-07-24 | 13F | Blair William & Co/il | 400 | 0.00 | 26 | 0.00 | ||||
| 2025-08-01 | 13F | Envestnet Asset Management Inc | 18,315 | -0.66 | 1,174 | 0.43 | ||||
| 2025-08-14 | 13F | Wells Fargo & Company/mn | 71,729 | -1.21 | 4,598 | -0.20 | ||||
| 2025-07-23 | 13F | Joel Isaacson & Co., LLC | 0 | -100.00 | 0 | |||||
| 2025-08-05 | 13F | Hills Bank & Trust Co | 4,887 | -6.33 | 313 | -5.15 | ||||
| 2025-08-18 | 13F | Hollencrest Capital Management | 516 | 0.00 | 33 | 3.13 | ||||
| 2025-09-04 | 13F/A | Advisor Group Holdings, Inc. | 9,441 | 9.92 | 605 | 11.21 | ||||
| 2025-05-14 | 13F | Mml Investors Services, Llc | 0 | -100.00 | 0 | |||||
| 2025-08-14 | 13F | Royal Bank Of Canada | 71,877 | -4.67 | 4,608 | -3.66 | ||||
| 2025-07-16 | 13F | Dakota Wealth Management | 4,901 | -38.51 | 314 | -37.82 | ||||
| 2025-08-06 | 13F | AE Wealth Management LLC | 600 | 0.00 | 38 | 0.00 | ||||
| 2025-07-08 | 13F | Parallel Advisors, LLC | 87 | 55.36 | 6 | 66.67 | ||||
| 2025-08-25 | 13F/A | Promus Capital, LLC | 282 | 0.00 | 18 | 5.88 | ||||
| 2025-07-18 | 13F | Institute for Wealth Management, LLC. | 20,768 | 0.00 | 1,331 | 1.06 | ||||
| 2025-05-15 | 13F | Pathstone Holdings, LLC | 0 | -100.00 | 0 | |||||
| 2025-08-06 | 13F | Commonwealth Equity Services, Llc | 27,327 | -15.24 | 2 | -50.00 | ||||
| 2025-08-14 | 13F | Comerica Bank | 203 | 0.00 | 13 | 8.33 | ||||
| 2025-08-04 | 13F | Creative Financial Designs Inc /adv | 2,971 | -32.77 | 190 | -32.14 | ||||
| 2025-08-12 | 13F | CIBC Private Wealth Group, LLC | 385 | 0.00 | 25 | 14.29 | ||||
| 2025-07-16 | 13F | Signaturefd, Llc | 213 | 0.00 | 14 | 0.00 | ||||
| 2025-08-14 | 13F | Stifel Financial Corp | 6,974 | -11.13 | 447 | -10.06 | ||||
| 2025-07-15 | 13F | Signet Financial Management, Llc | 4,351 | 3.92 | 279 | 4.91 | ||||
| 2025-08-11 | 13F | Tidemark, LLC | 0 | -100.00 | 0 | |||||
| 2025-08-14 | 13F | UBS Group AG | 75,983 | 3.76 | 4,871 | 4.84 | ||||
| 2025-08-12 | 13F | Global Retirement Partners, LLC | 600 | 0.00 | 38 | -2.56 | ||||
| 2025-08-14 | 13F | GWM Advisors LLC | 541 | 0.74 | 35 | 0.00 | ||||
| 2025-08-14 | 13F | Mariner, LLC | 12,219 | 783 | ||||||
| 2025-08-12 | 13F | Jpmorgan Chase & Co | 501 | -93.56 | 32 | -93.51 | ||||
| 2025-08-08 | 13F | Pnc Financial Services Group, Inc. | 329 | -17.13 | 21 | -16.00 | ||||
| 2025-08-14 | 13F | Fmr Llc | 505 | -15.83 | 32 | -15.79 | ||||
| 2025-07-18 | 13F | Newman Dignan & Sheerar, Inc. | 10,472 | -3.68 | 671 | -2.61 | ||||
| 2025-08-05 | 13F | GPS Wealth Strategies Group, LLC | 605 | 0.17 | 39 | 0.00 | ||||
| 2025-08-12 | 13F | Proequities, Inc. | 0 | 0 | ||||||
| 2025-08-07 | 13F | Beese Fulmer Investment Management, Inc. | 3,400 | 0.00 | 218 | 0.93 | ||||
| 2025-08-14 | 13F | Gerber Kawasaki Wealth & Investment Management | 254,172 | 4.19 | 16,292 | 5.27 | ||||
| 2025-08-06 | 13F | First Horizon Advisors, Inc. | 156 | 0.00 | 10 | 11.11 | ||||
| 2025-07-17 | 13F | Archford Capital Strategies, LLC | 3,669 | -19.22 | 235 | -18.40 | ||||
| 2025-08-05 | 13F | Tsfg, Llc | 200 | 0.00 | 0 | |||||
| 2025-07-25 | 13F | Hemington Wealth Management | 434 | 0.00 | 0 | |||||
| 2025-08-07 | 13F | Allworth Financial LP | 850 | 54 | ||||||
| 2025-08-11 | 13F | Citigroup Inc | 200 | 0.00 | 13 | 0.00 | ||||
| 2025-05-15 | 13F | Citadel Advisors Llc | 0 | -100.00 | 0 | |||||
| 2025-08-14 | 13F | Goldman Sachs Group Inc | 43,188 | 14.69 | 2,768 | 15.91 | ||||
| 2025-08-06 | 13F | North Capital, Inc. | 2 | 0.00 | 0 | |||||
| 2025-08-14 | 13F | Investment House Llc | 7,480 | -6.27 | 479 | -5.34 | ||||
| 2025-08-12 | 13F | Coldstream Capital Management Inc | 0 | -100.00 | 0 | |||||
| 2025-07-30 | 13F | Financial Perspectives, Inc | 350 | 0.00 | 22 | 0.00 | ||||
| 2025-08-11 | 13F | Cornerstone Planning Group LLC | 164 | 0.00 | 11 | 11.11 | ||||
| 2025-05-15 | 13F | Glenmede Trust Co Na | 1,860 | 0.00 | 118 | -4.88 | ||||
| 2025-07-14 | 13F | Painted Porch Advisors LLC | 0 | -100.00 | 0 | -100.00 | ||||
| 2025-08-12 | 13F | LPL Financial LLC | 76,895 | -7.09 | 4,929 | -6.13 | ||||
| 2025-07-24 | 13F | Us Bancorp \de\ | 16,500 | 0.00 | 1,058 | 1.05 | ||||
| 2025-07-28 | 13F | Harbour Investments, Inc. | 702 | -2.23 | 45 | 0.00 | ||||
| 2025-08-14 | 13F | Two Sigma Investments, Lp | 0 | -100.00 | 0 | |||||
| 2025-07-10 | 13F | YHB Investment Advisors, Inc. | 24,256 | -1.02 | 1,555 | 0.00 | ||||
| 2025-08-14 | 13F | Glenmede Investment Management, LP | 1,860 | 119 | ||||||
| 2025-08-12 | 13F | MAI Capital Management | 125 | 0.00 | 8 | 14.29 | ||||
| 2025-07-28 | 13F | Axxcess Wealth Management, Llc | 4,725 | -10.43 | 303 | -9.58 | ||||
| 2025-07-17 | 13F | Oakworth Capital, Inc. | 611 | 0.00 | 39 | 2.63 | ||||
| 2025-07-28 | 13F | RFG Advisory, LLC | 4,684 | 300 | ||||||
| 2025-08-13 | 13F | Baird Financial Group, Inc. | 3,865 | 0.03 | 248 | 0.82 | ||||
| 2025-08-11 | 13F | NewEdge Wealth, LLC | 15,701 | 0.00 | 1,020 | 2.31 | ||||
| 2025-08-14 | 13F | McIlrath & Eck, LLC | 205 | 0.00 | 13 | 0.00 | ||||
| 2025-08-14 | 13F | Raymond James Financial Inc | 7,937 | -12.74 | 509 | -11.96 | ||||
| 2025-07-17 | 13F | Janney Montgomery Scott LLC | 5,080 | -6.34 | 0 | |||||
| 2025-08-13 | 13F | Jones Financial Companies Lllp | 5,384 | 116.57 | 347 | 117.61 | ||||
| 2025-08-05 | 13F | Bank Of Montreal /can/ | 730 | 0.00 | 47 | 0.00 | ||||
| 2025-08-11 | 13F | One Capital Management, LLC | 12,830 | -46.23 | 822 | -45.67 | ||||
| 2025-08-08 | 13F | Creative Planning | 3,223 | -81.47 | 207 | -81.32 | ||||
| 2025-05-16 | 13F | Coppell Advisory Solutions LLC | 0 | -100.00 | 0 | |||||
| 2025-08-05 | 13F | Huntington National Bank | 0 |
Other Listings
| MX:PBE |