Mga Batayang Estadistika
| Pemilik Institusional | 107 total, 107 long only, 0 short only, 0 long/short - change of -0.93% MRQ |
| Alokasi Portofolio Rata-rata | 0.1703 % - change of -5.22% MRQ |
| Saham Institusional (Jangka Panjang) | 2,102,381 (ex 13D/G) - change of -0.01MM shares -0.32% MRQ |
| Nilai Institusional (Jangka Panjang) | $ 158,279 USD ($1000) |
Kepemilikan Institusional dan Pemegang Saham
Invesco Exchange-Traded Fund Trust - Invesco S&P 500 Equal Weight Financials ETF (US:RSPF) memiliki 107 pemilik institusional dan pemegang saham yang telah mengajukan formulir 13D/G atau 13F kepada Komisi Bursa Efek (Securities Exchange Commission/SEC). Lembaga-lembaga ini memegang total 2,102,381 saham. Pemegang saham terbesar meliputi Bank Of America Corp /de/, GWM Advisors LLC, UBS Group AG, Joseph Group Capital Management, Wealth Enhancement Advisory Services, Llc, LPL Financial LLC, Joseph P. Lucia & Associates, LLC, Ballast, Inc., Davis Investment Partners, LLC, and Cetera Investment Advisers .
Struktur kepemilikan institusional Invesco Exchange-Traded Fund Trust - Invesco S&P 500 Equal Weight Financials ETF (ARCA:RSPF) menunjukkan posisi terkini di perusahaan oleh institusi dan dana, serta perubahan terbaru dalam ukuran posisi. Pemegang saham utama dapat mencakup investor individu, reksa dana, dana lindung nilai, atau institusi. Jadwal 13D menunjukkan bahwa investor memegang (atau pernah memegang) lebih dari 5% saham perusahaan dan bermaksud (atau pernah bermaksud) untuk secara aktif mengejar perubahan strategi bisnis. Jadwal 13G menunjukkan investasi pasif lebih dari 5%.
The share price as of September 5, 2025 is 77.38 / share. Previously, on September 9, 2024, the share price was 67.64 / share. This represents an increase of 14.41% over that period.

Skor Sentimen Dana
Skor Sentimen Dana (sebelumnya dikenal sebagai Skor Akumulasi Kepemilikan) menemukan saham-saham yang paling banyak dibeli oleh dana. Ini adalah hasil dari model kuantitatif multi-faktor yang canggih yang mengidentifikasi perusahaan dengan tingkat akumulasi institusional tertinggi. Model penilaian menggunakan kombinasi dari total peningkatan pemilik yang diungkapkan, perubahan dalam alokasi portofolio pada pemilik tersebut, dan metrik lainnya. Angka berkisar dari 0 hingga 100, dengan angka yang lebih tinggi menunjukkan tingkat akumulasi yang lebih tinggi dibandingkan dengan perusahaan sejenisnya, dan 50 adalah rata-ratanya.
Frekuensi Pembaruan: Setiap Hari
Lihat Ownership Explorer, yang menyediakan daftar perusahaan dengan peringkat tertinggi.
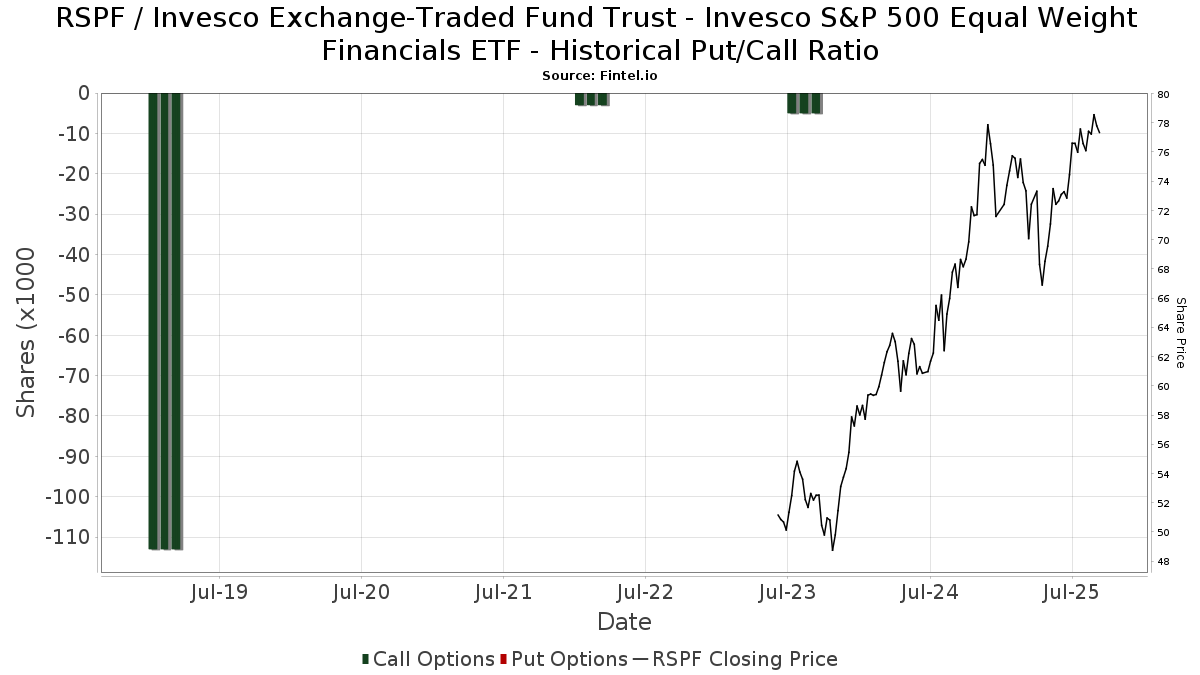
Rasio Put/Call Institusional
Selain melaporkan isu ekuitas dan utang standar, institusi dengan aset di bawah manajemen lebih dari 100 juta dolar AS juga harus mengungkapkan kepemilikan opsi put dan call mereka. Karena opsi put umumnya menunjukkan sentimen negatif, dan opsi call menunjukkan sentimen positif, kita dapat mengetahui sentimen institusional secara keseluruhan dengan memplot rasio put terhadap call. Grafik di sebelah kanan memplot rasio put/call historis untuk instrumen ini.
Menggunakan Rasio Put/Call sebagai indikator sentimen investor mengatasi salah satu kekurangan utama dari penggunaan total kepemilikan institusional, yaitu sejumlah besar aset yang dikelola diinvestasikan secara pasif untuk melacak indeks. Dana yang dikelola secara pasif biasanya tidak membeli opsi, sehingga indikator rasio put/call lebih akurat dalam melacak sentimen dana yang dikelola secara aktif.
Pengajuan 13F dan NPORT
Detail pada pengajuan 13F tersedia gratis. Detail pada pengajuan NP memerlukan keanggotaan premium. Baris berwarna hijau menunjukkan posisi baru. Baris berwarna merah menunjukkan posisi yang sudah ditutup. Klik tautan ini ikon untuk melihat riwayat transaksi selengkapnya.
Tingkatkan
untuk membuka data premium dan mengekspor ke Excel ![]() .
.
| Tanggal File | Sumber | Investor | Ketik | Presyo ng Avg (Silangan) |
Saham | Δ Saham (%) |
Dilaporkan Nilai ($1000) |
Nilai Δ (%) |
Alokasi Port (%) |
|
|---|---|---|---|---|---|---|---|---|---|---|
| 2025-07-16 | 13F | Arkansas Financial Group, Inc. | 37,396 | -0.91 | 2,858 | 14.74 | ||||
| 2025-08-08 | 13F | Comprehensive Financial Planning, Inc./PA | 108 | 0.00 | 8 | 14.29 | ||||
| 2025-07-30 | 13F | Pacific Sun Financial Corp | 12,140 | 0.41 | 924 | 5.48 | ||||
| 2025-08-11 | 13F | HighTower Advisors, LLC | 20,250 | 4.42 | 1,541 | 9.60 | ||||
| 2025-08-11 | 13F | Aptus Capital Advisors, LLC | 1,200 | 91 | ||||||
| 2025-08-05 | 13F | Sebold Capital Management, Inc. | 5,873 | 0.07 | 447 | 4.94 | ||||
| 2025-07-16 | 13F | ORG Partners LLC | 654 | 0.46 | 50 | 6.38 | ||||
| 2025-07-10 | 13F | Wealth Enhancement Advisory Services, Llc | 93,885 | 3.95 | 7,287 | 11.25 | ||||
| 2025-08-18 | 13F | Geneos Wealth Management Inc. | 6,658 | 2.94 | 507 | 7.89 | ||||
| 2025-08-04 | 13F | Arkadios Wealth Advisors | 17,657 | 1,344 | ||||||
| 2025-08-12 | 13F | Allen Capital Group, LLC | 52,825 | -2.64 | 4,021 | 2.16 | ||||
| 2025-08-14 | 13F | Comerica Bank | 270 | 0.00 | 21 | 5.26 | ||||
| 2025-07-24 | 13F | Blair William & Co/il | 2,350 | 0.00 | 179 | 4.71 | ||||
| 2025-07-25 | 13F | Midwest Capital Advisors, LLC | 200 | 0.00 | 15 | 7.14 | ||||
| 2025-08-12 | 13F | LPL Financial LLC | 92,116 | 1.58 | 7,011 | 6.61 | ||||
| 2025-08-11 | 13F | Private Advisor Group, LLC | 23,859 | -34.62 | 1,816 | -31.41 | ||||
| 2025-08-05 | 13F | Scarborough Advisors, LLC | 10 | 1 | ||||||
| 2025-08-14 | 13F | Qube Research & Technologies Ltd | 45 | 0.00 | 3 | 0.00 | ||||
| 2025-07-23 | 13F | Friedenthal Financial | 8,272 | -1.50 | 630 | 3.28 | ||||
| 2025-08-14 | 13F | Ausdal Financial Partners, Inc. | 21,807 | 0.34 | 1,660 | 5.27 | ||||
| 2025-08-14 | 13F | Goldman Sachs Group Inc | 24,340 | 9.14 | 1,853 | 14.53 | ||||
| 2025-08-15 | 13F | CI Private Wealth, LLC | 6,716 | 0.00 | 511 | 4.93 | ||||
| 2025-07-24 | 13F | Stonebridge Financial Group, LLC | 0 | -100.00 | 0 | |||||
| 2025-08-12 | 13F | MAI Capital Management | 11,340 | 11.58 | 863 | 17.10 | ||||
| 2025-05-15 | 13F | Glenmede Trust Co Na | 368 | 0.00 | 27 | 0.00 | ||||
| 2025-08-14 | 13F | UBS Group AG | 105,298 | 74.61 | 8,015 | 83.26 | ||||
| 2025-08-08 | 13F | Financial Gravity Companies, Inc. | 85 | -15.00 | 6 | -14.29 | ||||
| 2025-08-06 | 13F | AE Wealth Management LLC | 645 | 0.31 | 49 | 6.52 | ||||
| 2025-08-14 | 13F | Sunbelt Securities, Inc. | 17,324 | 0.75 | 1,254 | 0.48 | ||||
| 2025-08-06 | 13F | Commonwealth Equity Services, Llc | 13,099 | -1.32 | 1 | |||||
| 2025-08-08 | 13F | Pnc Financial Services Group, Inc. | 49 | 0.00 | 4 | 0.00 | ||||
| 2025-07-11 | 13F | SILVER OAK SECURITIES, Inc | 7,746 | 5.17 | 590 | 11.76 | ||||
| 2025-08-11 | 13F | Citigroup Inc | 871 | 66 | ||||||
| 2025-08-12 | 13F | One Charles Private Wealth Services, LLC | 4,290 | -1.31 | 327 | 3.49 | ||||
| 2025-08-14 | 13F | Integrated Wealth Concepts LLC | 3,207 | 0.38 | 244 | 5.63 | ||||
| 2025-07-22 | 13F | Berger Financial Group, Inc | 6,688 | 0.00 | 509 | 4.95 | ||||
| 2025-08-11 | 13F | Tidemark, LLC | 366 | 0.55 | 28 | 3.85 | ||||
| 2025-08-12 | 13F | Proequities, Inc. | 0 | 0 | ||||||
| 2025-08-14 | 13F | Guardian Wealth Management, Inc. | 0 | -100.00 | 0 | |||||
| 2025-08-12 | 13F | AlphaCore Capital LLC | 1,148 | 35.38 | 87 | 42.62 | ||||
| 2025-07-21 | 13F | Ameritas Advisory Services, LLC | 132 | 10 | ||||||
| 2025-08-14 | 13F | Cardiff Park Advisors, Llc | 200 | 0.00 | 15 | 7.14 | ||||
| 2025-07-08 | 13F | Davis Investment Partners, LLC | 74,235 | -2.22 | 5,688 | 10.49 | ||||
| 2025-07-25 | 13F | We Are One Seven, LLC | 5,408 | -1.26 | 412 | 3.53 | ||||
| 2025-08-18 | 13F/A | National Bank Of Canada /fi/ | 19,444 | 42.33 | 1,477 | 48.79 | ||||
| 2025-08-14 | 13F | Wells Fargo & Company/mn | 40,399 | -4.76 | 3,075 | -0.07 | ||||
| 2025-07-25 | 13F | NorthRock Partners, LLC | 20 | 0.00 | 2 | 0.00 | ||||
| 2025-08-14 | 13F | GWM Advisors LLC | 142,532 | 5.00 | 10,849 | 10.19 | ||||
| 2025-07-29 | 13F | Empirical Asset Management, LLC | 7,598 | -1.38 | 578 | 3.58 | ||||
| 2025-08-14 | 13F | Bank Of America Corp /de/ | 254,979 | -0.90 | 19,407 | 4.00 | ||||
| 2025-07-22 | 13F | Yoder Wealth Management, Inc. | 42,176 | 6.36 | 3,210 | 11.61 | ||||
| 2025-07-28 | 13F | ForthRight Wealth Management, LLC | 0 | -100.00 | 0 | |||||
| 2025-07-31 | 13F | CVA Family Office, LLC | 150 | 0.00 | 11 | 10.00 | ||||
| 2025-08-15 | 13F | Morgan Stanley | 62,298 | -1.44 | 4,742 | 3.42 | ||||
| 2025-08-13 | 13F | Northwestern Mutual Wealth Management Co | 243 | 0.00 | 18 | 5.88 | ||||
| 2025-08-08 | 13F | IMA Wealth, Inc. | 3,985 | 0.00 | 303 | 4.84 | ||||
| 2025-08-11 | 13F | Principal Securities, Inc. | 1,889 | -19.31 | 144 | -15.38 | ||||
| 2025-08-08 | 13F | Cetera Investment Advisers | 69,733 | -3.49 | 5,308 | 1.28 | ||||
| 2025-08-12 | 13F | Mcdonald Partners Llc | 3,575 | 0.00 | 272 | 5.02 | ||||
| 2025-08-08 | 13F | Creative Planning | 9,632 | 11.92 | 733 | 17.47 | ||||
| 2025-07-22 | 13F | Wealthcare Advisory Partners LLC | 4,317 | -11.52 | 329 | -7.08 | ||||
| 2025-07-29 | 13F | Dumont & Blake Investment Advisors Llc | 12,639 | -0.74 | 962 | 4.12 | ||||
| 2025-08-14 | 13F | Federation des caisses Desjardins du Quebec | 332 | 0.00 | 25 | 4.17 | ||||
| 2025-08-25 | 13F/A | Promus Capital, LLC | 2,028 | 0.00 | 154 | 4.76 | ||||
| 2025-07-31 | 13F | Cambridge Investment Research Advisors, Inc. | 5,657 | -17.17 | 0 | |||||
| 2025-07-11 | 13F | Farther Finance Advisors, LLC | 53,623 | 4.05 | 4,081 | 9.26 | ||||
| 2025-08-08 | 13F | Hartland & Co., LLC | 5,473 | -1.17 | 417 | 3.74 | ||||
| 2025-08-14 | 13F | Susquehanna International Group, Llp | 4,545 | 42.34 | 346 | 49.35 | ||||
| 2025-08-13 | 13F | Lido Advisors, LLC | 11,151 | -9.74 | 849 | -5.36 | ||||
| 2025-07-16 | 13F/A | CX Institutional | 10 | -99.94 | 0 | -100.00 | ||||
| 2025-07-31 | 13F | Shaker Investments Llc/oh | 0 | -100.00 | 0 | |||||
| 2025-08-12 | 13F | SRS Capital Advisors, Inc. | 400 | 0.00 | 30 | 3.45 | ||||
| 2025-07-24 | 13F | Live Oak Investment Partners | 22,138 | 8.87 | 1,685 | 14.25 | ||||
| 2025-08-14 | 13F | Raymond James Financial Inc | 16,970 | -4.06 | 1,292 | 0.62 | ||||
| 2025-08-05 | 13F | Bank Of Montreal /can/ | 555 | 0.00 | 42 | 5.00 | ||||
| 2025-08-07 | 13F | Allworth Financial LP | 1,168 | 0.00 | 89 | 8.64 | ||||
| 2025-07-09 | 13F | Sandbox Financial Partners, LLC | 21,271 | -0.61 | 1,619 | 4.32 | ||||
| 2025-08-01 | 13F | Envestnet Asset Management Inc | 6,184 | 13.41 | 471 | 18.99 | ||||
| 2025-07-30 | 13F | Strategic Blueprint, LLC | 6,557 | -34.15 | 499 | -30.89 | ||||
| 2025-09-04 | 13F/A | Advisor Group Holdings, Inc. | 24,822 | 2.46 | 1,892 | 7.57 | ||||
| 2025-07-29 | 13F | Harbor Asset Planning, Inc. | 5,176 | 394 | ||||||
| 2025-05-08 | 13F | Baker Avenue Asset Management, LP | 0 | -100.00 | 0 | |||||
| 2025-07-29 | 13F | Private Trust Co Na | 3,293 | -51.91 | 251 | -49.60 | ||||
| 2025-08-04 | 13F | FRG Family Wealth Advisors LLC | 18,870 | 0.00 | 1,436 | 4.97 | ||||
| 2025-08-14 | 13F | Fmr Llc | 1,757 | 10.85 | 134 | 16.67 | ||||
| 2025-07-15 | 13F | McAdam, LLC | 2,718 | 207 | ||||||
| 2025-08-07 | 13F/A | Joseph Group Capital Management | 103,052 | 0.41 | 7,844 | 5.37 | ||||
| 2025-08-04 | 13F | Joseph P. Lucia & Associates, LLC | 80,446 | -1.32 | 6,123 | 3.57 | ||||
| 2025-08-12 | 13F | Jpmorgan Chase & Co | 64,600 | 0.00 | 4,917 | 4.93 | ||||
| 2025-07-30 | 13F | Eqis Capital Management, Inc. | 7,638 | -1.56 | 581 | 3.38 | ||||
| 2025-07-10 | 13F | Focus Financial Network, Inc. | 19,637 | -1.50 | 1,495 | 3.32 | ||||
| 2025-07-11 | 13F | Seacrest Wealth Management, Llc | 0 | -100.00 | 0 | |||||
| 2025-07-21 | 13F | DHJJ Financial Advisors, Ltd. | 270 | 0.00 | 21 | 5.26 | ||||
| 2025-08-11 | 13F | HHM Wealth Advisors, LLC | 2,395 | 11.66 | 182 | 17.42 | ||||
| 2025-08-11 | 13F | Cascade Wealth Advisors, Inc | 0 | -100.00 | 0 | |||||
| 2025-08-13 | 13F | Jones Financial Companies Lllp | 10,599 | 23.30 | 800 | 29.92 | ||||
| 2025-04-23 | 13F | Creative Financial Designs Inc /adv | 0 | -100.00 | 0 | |||||
| 2025-08-15 | 13F | Kestra Advisory Services, LLC | 9,206 | 7.91 | 701 | 13.27 | ||||
| 2025-07-18 | 13F | PFG Investments, LLC | 0 | -100.00 | 0 | |||||
| 2025-07-17 | 13F | Walker Asset Management, LLC | 18,638 | 0.94 | 1,419 | 5.90 | ||||
| 2025-08-06 | 13F | North Capital, Inc. | 320 | 0.00 | 24 | 4.35 | ||||
| 2025-08-13 | 13F | Green Harvest Asset Management LLC | 41,204 | 0.95 | 3,136 | 5.95 | ||||
| 2025-07-18 | 13F | Truist Financial Corp | 8,617 | 8.08 | 656 | 13.32 | ||||
| 2025-08-14 | 13F | Stifel Financial Corp | 18,007 | -16.65 | 1,371 | -12.57 | ||||
| 2025-08-14 | 13F | Citadel Advisors Llc | 5,912 | 450 | ||||||
| 2025-04-30 | 13F | Sofos Investments, Inc. | 100 | -56.71 | 7 | -50.00 | ||||
| 2025-08-14 | 13F | Ameriprise Financial Inc | 3,650 | 1.36 | 278 | 6.13 | ||||
| 2025-08-14 | 13F | Royal Bank Of Canada | 17,458 | 4.45 | 1,329 | 9.56 | ||||
| 2025-08-04 | 13F | Spire Wealth Management | 0 | -100.00 | 0 | |||||
| 2025-08-14 | 13F | Two Sigma Investments, Lp | 7,900 | 601 | ||||||
| 2025-07-25 | 13F | Envestnet Portfolio Solutions, Inc. | 3,515 | -4.12 | 268 | 0.75 | ||||
| 2025-07-29 | 13F | Ballast, Inc. | 80,446 | 6,123 | ||||||
| 2025-07-28 | 13F | Harbour Investments, Inc. | 16,597 | -0.47 | 1,263 | 4.47 | ||||
| 2025-08-14 | 13F | IHT Wealth Management, LLC | 0 | -100.00 | 0 | |||||
| 2025-08-14 | 13F | Ancora Advisors, LLC | 82 | 0.00 | 6 | 20.00 | ||||
| 2025-08-12 | 13F | Coldstream Capital Management Inc | 0 | -100.00 | 0 | |||||
| 2025-08-14 | 13F | Mml Investors Services, Llc | 4,965 | 1.51 | 0 | |||||
| 2025-08-11 | 13F | Regal Investment Advisors LLC | 5,025 | 0.00 | 382 | 4.95 | ||||
| 2025-08-14 | 13F | Glenmede Investment Management, LP | 368 | 28 | ||||||
| 2025-05-09 | 13F | CoreCap Advisors, LLC | 0 | -100.00 | 0 | |||||
| 2025-08-13 | 13F | Twin Peaks Wealth Advisors, LLC | 297 | 23 |