Mga Batayang Estadistika
| Pemilik Institusional | 224 total, 224 long only, 0 short only, 0 long/short - change of 3.69% MRQ |
| Alokasi Portofolio Rata-rata | 0.1989 % - change of -16.93% MRQ |
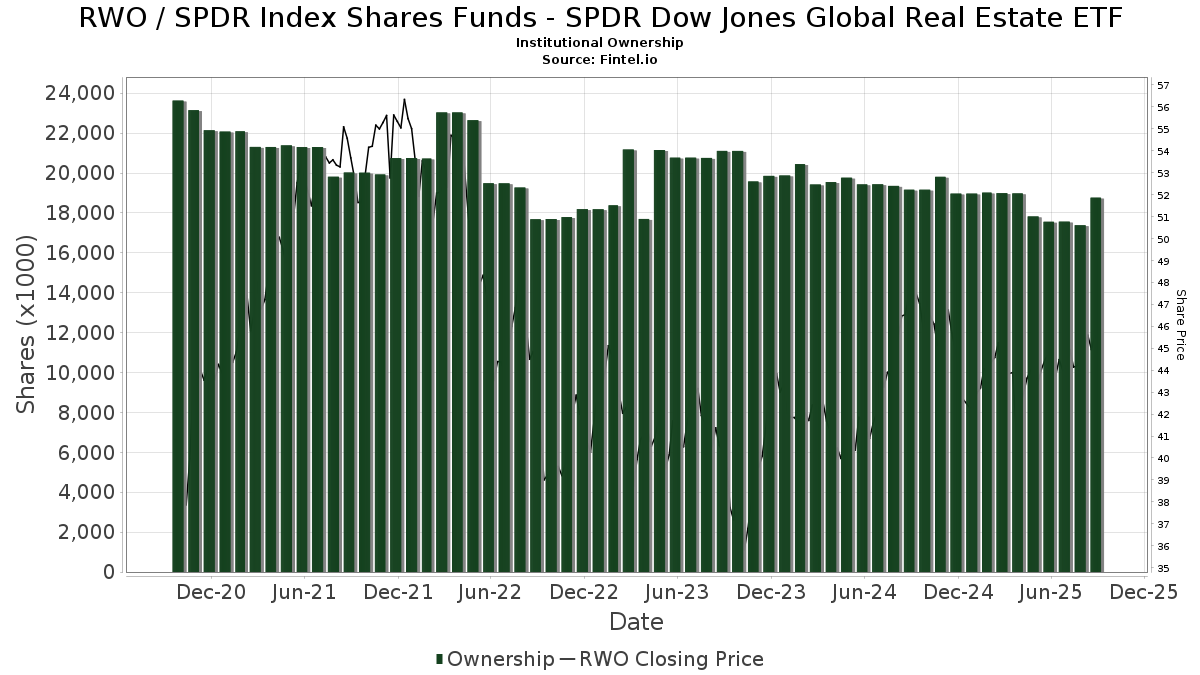
| Saham Institusional (Jangka Panjang) | 18,765,827 (ex 13D/G) - change of 1.21MM shares 6.88% MRQ |
| Nilai Institusional (Jangka Panjang) | $ 798,553 USD ($1000) |
Kepemilikan Institusional dan Pemegang Saham
SPDR Index Shares Funds - SPDR Dow Jones Global Real Estate ETF (US:RWO) memiliki 224 pemilik institusional dan pemegang saham yang telah mengajukan formulir 13D/G atau 13F kepada Komisi Bursa Efek (Securities Exchange Commission/SEC). Lembaga-lembaga ini memegang total 18,765,827 saham. Pemegang saham terbesar meliputi State Street Corp, SSBRX - State Street Target Retirement 2025 Fund Class I, SSBWX - State Street Target Retirement 2030 Fund Class I, SSFNX - State Street Target Retirement Fund Class I, Bank Of America Corp /de/, Bank of New York Mellon Corp, SSBNX - State Street Target Retirement 2020 Fund Class I, Glenmede Trust Co Na, Glenmede Investment Management, LP, and Goldman Sachs Group Inc .
Struktur kepemilikan institusional SPDR Index Shares Funds - SPDR Dow Jones Global Real Estate ETF (ARCA:RWO) menunjukkan posisi terkini di perusahaan oleh institusi dan dana, serta perubahan terbaru dalam ukuran posisi. Pemegang saham utama dapat mencakup investor individu, reksa dana, dana lindung nilai, atau institusi. Jadwal 13D menunjukkan bahwa investor memegang (atau pernah memegang) lebih dari 5% saham perusahaan dan bermaksud (atau pernah bermaksud) untuk secara aktif mengejar perubahan strategi bisnis. Jadwal 13G menunjukkan investasi pasif lebih dari 5%.
The share price as of September 5, 2025 is 45.72 / share. Previously, on September 9, 2024, the share price was 46.95 / share. This represents a decline of 2.62% over that period.
Skor Sentimen Dana
Skor Sentimen Dana (sebelumnya dikenal sebagai Skor Akumulasi Kepemilikan) menemukan saham-saham yang paling banyak dibeli oleh dana. Ini adalah hasil dari model kuantitatif multi-faktor yang canggih yang mengidentifikasi perusahaan dengan tingkat akumulasi institusional tertinggi. Model penilaian menggunakan kombinasi dari total peningkatan pemilik yang diungkapkan, perubahan dalam alokasi portofolio pada pemilik tersebut, dan metrik lainnya. Angka berkisar dari 0 hingga 100, dengan angka yang lebih tinggi menunjukkan tingkat akumulasi yang lebih tinggi dibandingkan dengan perusahaan sejenisnya, dan 50 adalah rata-ratanya.
Frekuensi Pembaruan: Setiap Hari
Lihat Ownership Explorer, yang menyediakan daftar perusahaan dengan peringkat tertinggi.
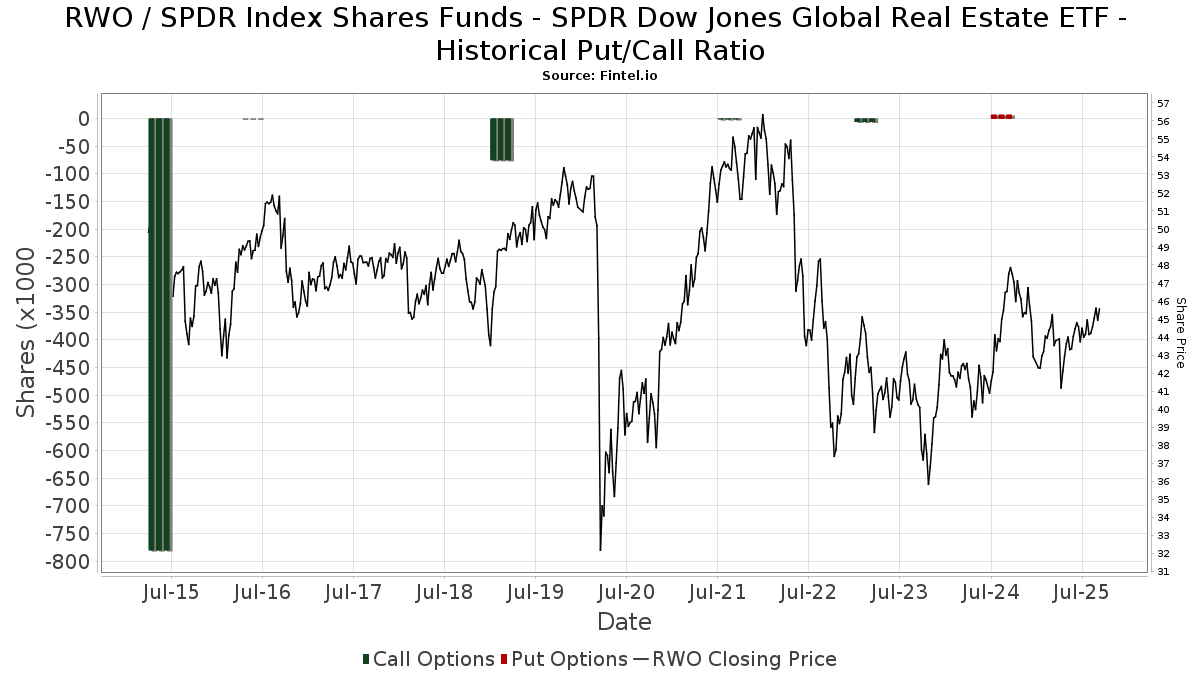
Rasio Put/Call Institusional
Selain melaporkan isu ekuitas dan utang standar, institusi dengan aset di bawah manajemen lebih dari 100 juta dolar AS juga harus mengungkapkan kepemilikan opsi put dan call mereka. Karena opsi put umumnya menunjukkan sentimen negatif, dan opsi call menunjukkan sentimen positif, kita dapat mengetahui sentimen institusional secara keseluruhan dengan memplot rasio put terhadap call. Grafik di sebelah kanan memplot rasio put/call historis untuk instrumen ini.
Menggunakan Rasio Put/Call sebagai indikator sentimen investor mengatasi salah satu kekurangan utama dari penggunaan total kepemilikan institusional, yaitu sejumlah besar aset yang dikelola diinvestasikan secara pasif untuk melacak indeks. Dana yang dikelola secara pasif biasanya tidak membeli opsi, sehingga indikator rasio put/call lebih akurat dalam melacak sentimen dana yang dikelola secara aktif.
Pengajuan 13F dan NPORT
Detail pada pengajuan 13F tersedia gratis. Detail pada pengajuan NP memerlukan keanggotaan premium. Baris berwarna hijau menunjukkan posisi baru. Baris berwarna merah menunjukkan posisi yang sudah ditutup. Klik tautan ini ikon untuk melihat riwayat transaksi selengkapnya.
Tingkatkan
untuk membuka data premium dan mengekspor ke Excel ![]() .
.
| Tanggal File | Sumber | Investor | Ketik | Presyo ng Avg (Silangan) |
Saham | Δ Saham (%) |
Dilaporkan Nilai ($1000) |
Nilai Δ (%) |
Alokasi Port (%) |
|
|---|---|---|---|---|---|---|---|---|---|---|
| 2025-08-08 | 13F | Avantax Advisory Services, Inc. | 24,956 | 1.06 | 1,102 | 2.23 | ||||
| 2025-08-18 | 13F | Front Row Advisors LLC | 63 | -38.83 | 3 | -50.00 | ||||
| 2025-08-07 | 13F | Allworth Financial LP | 473 | 75.19 | 21 | 81.82 | ||||
| 2025-08-14 | 13F | Mpwm Advisory Solutions, Llc | 191 | -7.28 | 8 | 0.00 | ||||
| 2025-07-21 | 13F | Crews Bank & Trust | 31 | 1 | ||||||
| 2025-05-01 | 13F | Quest 10 Wealth Builders, Inc. | 0 | -100.00 | 0 | |||||
| 2025-08-14 | 13F | Boston Private Wealth Llc | 7,092 | -36.40 | 313 | -35.60 | ||||
| 2025-08-06 | 13F | Longview Financial Advisors LLC | 207 | 0.00 | 9 | 0.00 | ||||
| 2025-07-28 | 13F | Harbour Investments, Inc. | 7,249 | 4.98 | 320 | 5.98 | ||||
| 2025-08-11 | 13F | Banque Cantonale Vaudoise | 48,668 | 6.29 | 2 | 100.00 | ||||
| 2025-08-15 | 13F | Tower Research Capital LLC (TRC) | 8 | -33.33 | 0 | |||||
| 2025-08-06 | 13F | AE Wealth Management LLC | 5,653 | -13.50 | 250 | -12.63 | ||||
| 2025-07-22 | 13F | Aquire Wealth Advisors, LLC | 10,718 | -0.50 | 473 | 0.64 | ||||
| 2025-07-22 | 13F | Iron Horse Wealth Management, LLC | 106 | 0.00 | 5 | 0.00 | ||||
| 2025-07-22 | 13F | White & Co Financial Planning Inc | 117,574 | 1.33 | 5,178 | 2.94 | ||||
| 2025-07-18 | 13F | Consolidated Portfolio Review Corp | 6,257 | -5.98 | 276 | -4.83 | ||||
| 2025-07-18 | 13F | Truist Financial Corp | 12,833 | 0.46 | 566 | 1.62 | ||||
| 2025-07-17 | 13F | Moss Adams Wealth Advisors LLC | 59,583 | -20.49 | 2,630 | -19.60 | ||||
| 2025-08-06 | 13F | Golden State Wealth Management, LLC | 87 | 0.00 | 4 | 0.00 | ||||
| 2025-08-11 | 13F | GW&K Investment Management, LLC | 3,805 | 0.00 | 0 | |||||
| 2025-07-16 | 13F | Signaturefd, Llc | 48 | 0.00 | 2 | 0.00 | ||||
| 2025-08-05 | 13F | Cherry Tree Wealth Management, LLC | 106 | 0.00 | 5 | 0.00 | ||||
| 2025-08-12 | 13F | Steward Partners Investment Advisory, Llc | 291 | 0.34 | 13 | 0.00 | ||||
| 2025-07-08 | 13F | Boltwood Capital Management | 24,340 | 16.93 | 1,074 | 18.28 | ||||
| 2025-08-15 | 13F | Fsb Premier Wealth Management, Inc. | 14,270 | 0.01 | 630 | 1.13 | ||||
| 2025-08-13 | 13F | Flow Traders U.s. Llc | 142,137 | 14.40 | 6 | 20.00 | ||||
| 2025-07-28 | 13F | RFG Advisory, LLC | 20,398 | -1.34 | 900 | -0.22 | ||||
| 2025-08-05 | 13F | Scarborough Advisors, LLC | 128 | 6 | ||||||
| 2025-08-11 | 13F | Strategic Wealth Partners, Ltd. | 156 | 7 | ||||||
| 2025-08-05 | 13F | GPS Wealth Strategies Group, LLC | 480 | 0.63 | 21 | 5.00 | ||||
| 2025-07-24 | 13F | IFP Advisors, Inc | 2,872 | -22.90 | 127 | -22.22 | ||||
| 2025-08-05 | 13F | Lifeworks Advisors, LLC | 5,604 | -0.71 | 247 | 0.41 | ||||
| 2025-08-01 | 13F | Austin Private Wealth, LLC | 63,082 | 76.27 | 2,784 | 78.35 | ||||
| 2025-08-06 | 13F | Legacy Investment Solutions, LLC | 96 | 0.00 | 4 | 0.00 | ||||
| 2025-08-06 | 13F | Ironwood Wealth Management, LLC. | 912 | -79.71 | 40 | -79.59 | ||||
| 2025-08-08 | 13F | Capstone Financial Advisors, Inc. | 66,449 | 0.00 | 2,933 | 1.17 | ||||
| 2025-07-11 | 13F | Addis & Hill, Inc | 141,550 | -1.89 | 6,248 | -0.78 | ||||
| 2025-05-15 | 13F/A | Orion Portfolio Solutions, LLC | 14,118 | 13.22 | 616 | 15.36 | ||||
| 2025-08-13 | 13F | M&t Bank Corp | 72,432 | 145.59 | 3,197 | 148.33 | ||||
| 2025-07-09 | 13F | Pacific Capital Wealth Advisors, Inc | 6,578 | -36.60 | 290 | -35.84 | ||||
| 2025-07-17 | 13F | Wolff Wiese Magana Llc | 40 | 0.00 | 2 | 0.00 | ||||
| 2025-04-29 | 13F | Financial Network Wealth Management LLC | 623 | 0 | ||||||
| 2025-08-13 | 13F | Continuum Advisory, LLC | 0 | -100.00 | 0 | |||||
| 2025-08-08 | 13F | Larson Financial Group LLC | 2,444 | -16.07 | 108 | -15.75 | ||||
| 2025-08-12 | 13F | Foster Dykema Cabot & Partners, Llc | 53 | 0.00 | 2 | 0.00 | ||||
| 2025-08-12 | 13F | Jpmorgan Chase & Co | 3,277 | 0.09 | 145 | 1.41 | ||||
| 2025-08-14 | 13F | Smartleaf Asset Management LLC | 450 | -21.74 | 20 | -20.83 | ||||
| 2025-08-14 | 13F | Murphy & Mullick Capital Management Corp | 62 | 0.00 | 3 | 0.00 | ||||
| 2025-07-07 | 13F | Discipline Wealth Solutions, LLC | 4,622 | 204 | ||||||
| 2025-08-01 | 13F | SYM FINANCIAL Corp | 52 | 0.00 | 2 | 0.00 | ||||
| 2025-07-29 | 13F | MPS Loria Financial Planners, LLC | 10,824 | 0.82 | 478 | 1.92 | ||||
| 2025-07-24 | 13F | PDS Planning, Inc | 5,384 | 0.54 | 238 | 1.72 | ||||
| 2025-07-30 | 13F | Bogart Wealth, LLC | 6 | 0.00 | 0 | |||||
| 2025-08-08 | 13F | Bailard, Inc. | 7,402 | -1.00 | 327 | 0.00 | ||||
| 2025-07-25 | 13F | LRI Investments, LLC | 108 | 0.00 | 5 | 0.00 | ||||
| 2025-08-14 | 13F | Qube Research & Technologies Ltd | 154 | -69.74 | 7 | -72.73 | ||||
| 2025-08-14 | 13F | Jane Street Group, Llc | 450,000 | 1,264.13 | 19,863 | 1,280.33 | ||||
| 2025-07-14 | 13F | AdvisorNet Financial, Inc | 529 | 0.19 | 23 | 0.00 | ||||
| 2025-07-31 | 13F | FSM Wealth Advisors, LLC | 47,203 | -28.50 | 2,083 | -27.73 | ||||
| 2025-08-14 | 13F | Ancora Advisors, LLC | 2,965 | -8.49 | 131 | -7.80 | ||||
| 2025-07-31 | 13F | Brighton Jones Llc | 279,256 | 3.32 | 12,326 | 4.50 | ||||
| 2025-05-13 | 13F | Heck Capital Advisors, LLC | 0 | -100.00 | 0 | -100.00 | ||||
| 2025-08-13 | 13F | Baird Financial Group, Inc. | 8,407 | -1.45 | 371 | -0.27 | ||||
| 2025-07-15 | 13F | Evanson Asset Management, LLC | 6,467 | 0.00 | 285 | 1.06 | ||||
| 2025-07-22 | 13F | SOL Capital Management CO | 11,450 | -0.69 | 1 | |||||
| 2025-07-23 | 13F | Nbt Bank N A /ny | 342 | 0.00 | 15 | 7.14 | ||||
| 2025-08-07 | 13F | Efficient Advisors, LLC | 12,293 | -39.13 | 543 | -38.48 | ||||
| 2025-08-01 | 13F | Gwn Securities Inc. | 0 | -100.00 | 0 | |||||
| 2025-08-04 | 13F | IFG Advisory, LLC | 22,174 | 0.65 | 979 | 1.77 | ||||
| 2025-08-11 | 13F | Independent Advisor Alliance | 16,396 | 12.20 | 724 | 13.50 | ||||
| 2025-08-14 | 13F | Great Valley Advisor Group, Inc. | 31,176 | 3.50 | 1,376 | 4.72 | ||||
| 2025-08-01 | 13F | Rossby Financial, LCC | 40 | 0.00 | 2 | 0.00 | ||||
| 2025-07-15 | 13F | Fifth Third Bancorp | 15,250 | 9.26 | 673 | 10.51 | ||||
| 2025-04-28 | 13F | Fedenia Advisers LLC | 0 | -100.00 | 0 | |||||
| 2025-08-06 | 13F | Columbia River Financial Group, LLC | 31,788 | -9.45 | 1 | 0.00 | ||||
| 2025-08-11 | 13F | Private Advisor Group, LLC | 15,084 | -8.16 | 666 | -7.12 | ||||
| 2025-08-12 | 13F | J.w. Cole Advisors, Inc. | 5,376 | -42.79 | 237 | -42.20 | ||||
| 2025-07-08 | 13F | Parallel Advisors, LLC | 1,518 | 1.07 | 67 | 1.54 | ||||
| 2025-09-04 | 13F/A | Advisor Group Holdings, Inc. | 28,002 | 91.94 | 1,236 | 94.03 | ||||
| 2025-04-22 | 13F | Rappaport Reiches Capital Management, LLC | 76,602 | 1.88 | 3,343 | 3.66 | ||||
| 2025-08-06 | 13F | Walkner Condon Financial Advisors LLC | 0 | -100.00 | 0 | |||||
| 2025-08-14 | 13F | UBS Group AG | 20,482 | -6.73 | 904 | -5.64 | ||||
| 2025-05-06 | 13F | City National Bank Of Florida /msd | 0 | -100.00 | 0 | |||||
| 2025-07-30 | 13F | Avidian Wealth Solutions, LLC | 143,592 | 3.57 | 6,338 | 4.76 | ||||
| 2025-08-11 | 13F | Aptus Capital Advisors, LLC | 106 | 0.00 | 5 | 0.00 | ||||
| 2025-08-13 | 13F | Mount Yale Investment Advisors, LLC | 131 | 6 | ||||||
| 2025-07-22 | 13F | Simplicity Wealth,LLC | 37,766 | 1,667 | ||||||
| 2025-08-12 | 13F | Proequities, Inc. | 0 | 0 | ||||||
| 2025-05-15 | 13F | Lido Advisors, LLC | 0 | -100.00 | 0 | -100.00 | ||||
| 2025-07-14 | 13F | UMA Financial Services, Inc. | 1,102 | 0.00 | 49 | 0.00 | ||||
| 2025-07-28 | 13F | Mutual Advisors, LLC | 0 | -100.00 | 0 | |||||
| 2025-07-29 | 13F | Kondo Wealth Advisors, Inc. | 5,186 | 0.68 | 231 | 2.68 | ||||
| 2025-08-08 | 13F | Gts Securities Llc | 5,879 | 259 | ||||||
| 2025-08-14 | 13F | Mariner, LLC | 307,117 | 4.79 | 13,556 | 5.99 | ||||
| 2025-08-06 | 13F | Commonwealth Equity Services, Llc | 8,347 | -10.94 | 0 | |||||
| 2025-07-31 | 13F | Waldron Private Wealth LLC | 123,099 | -3.34 | 5,434 | -2.23 | ||||
| 2025-07-25 | 13F | Northwest Capital Management Inc | 71 | 0.00 | 3 | 0.00 | ||||
| 2025-07-31 | 13F | Glass Jacobson Investment Advisors llc | 30 | 0.00 | 1 | 0.00 | ||||
| 2025-08-05 | 13F | Hills Bank & Trust Co | 282,877 | -5.45 | 12,486 | -4.37 | ||||
| 2025-07-30 | 13F | Loring Wolcott & Coolidge Fiduciary Advisors Llp/ma | 300 | 0.00 | 13 | 8.33 | ||||
| 2025-08-04 | 13F | Creative Financial Designs Inc /adv | 2,275 | 69.78 | 100 | 72.41 | ||||
| 2025-08-01 | 13F | Envestnet Asset Management Inc | 331,806 | -46.94 | 14,632 | -46.38 | ||||
| 2025-08-13 | 13F | Jones Financial Companies Lllp | 139,111 | 1.94 | 6,126 | 3.57 | ||||
| 2025-08-05 | 13F | Bank Of Montreal /can/ | 732 | -85.68 | 32 | -85.65 | ||||
| 2025-08-14 | 13F/A | Barclays Plc | 27,771 | 5.63 | 1 | 0.00 | ||||
| 2025-07-24 | 13F | Jfs Wealth Advisors, Llc | 97,532 | -2.68 | 4,305 | -1.55 | ||||
| 2025-08-13 | 13F | Safe Harbor Fiduciary, LLC | 156 | 23.81 | 7 | 20.00 | ||||
| 2025-07-24 | 13F | Blair William & Co/il | 34,827 | -13.58 | 1,537 | -12.57 | ||||
| 2025-05-28 | NP | SSBNX - State Street Target Retirement 2020 Fund Class I This fund is a listed as child fund of State Street Corp and if that institution has disclosed ownership in this security, then these positions will not be double counted when calculating total shares and total value | 924,011 | -11.99 | 40,324 | -10.46 | ||||
| 2025-07-28 | 13F | Courier Capital Llc | 13,125 | -9.50 | 579 | -8.39 | ||||
| 2025-07-07 | 13F | First Community Trust Na | 900 | 0.00 | 40 | 0.00 | ||||
| 2025-08-08 | 13F | Capital Investment Advisory Services, LLC | 66 | 0.00 | 3 | 0.00 | ||||
| 2025-08-14 | 13F | GWM Advisors LLC | 5,250 | -20.86 | 232 | -20.07 | ||||
| 2025-08-28 | NP | SSBRX - State Street Target Retirement 2025 Fund Class I This fund is a listed as child fund of State Street Corp and if that institution has disclosed ownership in this security, then these positions will not be double counted when calculating total shares and total value | 2,219,600 | -0.21 | 97,973 | 0.94 | ||||
| 2025-08-07 | 13F | FDx Advisors, Inc. | 5,812 | -0.80 | 0 | |||||
| 2025-08-14 | 13F | Guardian Wealth Advisors, Llc / Nc | 106 | 0.00 | 5 | 0.00 | ||||
| 2025-08-14 | 13F | Royal Bank Of Canada | 53,317 | -5.13 | 2,354 | -4.04 | ||||
| 2025-07-28 | 13F | Rosenberg Matthew Hamilton | 185 | 0.00 | 8 | 0.00 | ||||
| 2025-08-11 | 13F | HighTower Advisors, LLC | 113,052 | 13.24 | 4,990 | 14.55 | ||||
| 2025-08-13 | 13F | Northwestern Mutual Wealth Management Co | 26,973 | -0.35 | 1,191 | 0.76 | ||||
| 2025-07-17 | 13F | Sound Income Strategies, LLC | 34 | 0.00 | 2 | 0.00 | ||||
| 2025-08-08 | 13F | Altfest L J & Co Inc | 39,587 | -1.18 | 1,747 | -0.06 | ||||
| 2025-08-06 | 13F | ORBA Wealth Advisors, L.L.C. | 16,875 | -42.29 | 745 | -41.69 | ||||
| 2025-07-10 | 13F | Brooklyn FI, LLC | 61,902 | -4.12 | 2,732 | -3.02 | ||||
| 2025-07-21 | 13F | Quent Capital, LLC | 435,275 | 8.87 | 19,213 | 10.12 | ||||
| 2025-07-24 | 13F | Us Bancorp \de\ | 4,332 | 3.93 | 191 | 5.52 | ||||
| 2025-08-14 | 13F | Raymond James Financial Inc | 351,013 | 3.36 | 15,494 | 4.55 | ||||
| 2025-08-14 | 13F | Archetype Wealth Partners | 16,714 | -0.85 | 1 | |||||
| 2025-04-10 | 13F | St. Clair Advisors, LLC | 0 | -100.00 | 0 | -100.00 | ||||
| 2025-08-13 | 13F | Financial Freedom, LLC | 285 | 1.06 | 13 | 0.00 | ||||
| 2025-08-28 | NP | SSBWX - State Street Target Retirement 2030 Fund Class I This fund is a listed as child fund of State Street Corp and if that institution has disclosed ownership in this security, then these positions will not be double counted when calculating total shares and total value | 2,032,945 | 9.36 | 89,734 | 10.61 | ||||
| 2025-07-14 | 13F | Signature Securities Group Corporation | 4,713 | 208 | ||||||
| 2025-08-11 | 13F | Nomura Asset Management Co Ltd | 7,000 | 0.00 | 309 | 0.98 | ||||
| 2025-07-15 | 13F | Total Wealth Planning, Llc | 26,695 | -8.94 | 1,178 | -7.90 | ||||
| 2025-08-06 | 13F | Innealta Capital, Llc | 8,830 | 12.53 | 390 | 13.74 | ||||
| 2025-08-12 | 13F | Virtu Financial LLC | 0 | -100.00 | 0 | |||||
| 2025-08-12 | 13F | OneAscent Financial Services LLC | 11,440 | 1 | ||||||
| 2025-07-23 | 13F | Valmark Advisers, Inc. | 101,143 | 13.50 | 4,464 | 14.81 | ||||
| 2025-07-29 | 13F | Tradewinds Capital Management, LLC | 16 | 0.00 | 1 | |||||
| 2025-08-14 | 13F | Fmr Llc | 1,776 | -36.23 | 78 | -35.54 | ||||
| 2025-08-14 | 13F | Mercer Global Advisors Inc /adv | 82,604 | -27.98 | 3,646 | -27.15 | ||||
| 2025-08-14 | 13F | Mml Investors Services, Llc | 92,779 | 1.69 | 4 | 33.33 | ||||
| 2025-08-14 | 13F | Matrix Private Capital Group Llc | 19,127 | -8.20 | 844 | -7.15 | ||||
| 2025-08-13 | 13F | Fi3 FINANCIAL ADVISORS, LLC | 7,786 | 344 | ||||||
| 2025-08-13 | 13F | EverSource Wealth Advisors, LLC | 830 | 0.00 | 37 | 0.00 | ||||
| 2025-08-12 | 13F | MAI Capital Management | 3,968 | -18.42 | 175 | -17.45 | ||||
| 2025-08-12 | 13F | LPL Financial LLC | 183,742 | -0.05 | 8,110 | 1.10 | ||||
| 2025-07-31 | 13F | BIP Wealth, LLC | 28,576 | -6.13 | 1,261 | -5.05 | ||||
| 2025-08-14 | 13F | AllSquare Wealth Management LLC | 22 | 0.00 | 1 | |||||
| 2025-08-07 | 13F | Parkside Financial Bank & Trust | 471 | 0.00 | 21 | 0.00 | ||||
| 2025-08-14 | 13F | Financial Advisory Service, Inc. | 1,578 | -0.75 | 70 | 0.00 | ||||
| 2025-08-12 | 13F | SRS Capital Advisors, Inc. | 32 | 0.00 | 1 | 0.00 | ||||
| 2025-08-04 | 13F | Assetmark, Inc | 31 | 1 | ||||||
| 2025-07-08 | 13F | Nbc Securities, Inc. | 15,030 | 1,107.23 | 1 | |||||
| 2025-08-06 | 13F | Legacy Wealth Managment, LLC/ID | 96 | 0.00 | 4 | 0.00 | ||||
| 2025-08-05 | 13F | Huntington National Bank | 66,489 | 2.32 | ||||||
| 2025-08-13 | 13F | Virtue Capital Management, LLC | 0 | -100.00 | 0 | |||||
| 2025-08-05 | 13F | Bank of New York Mellon Corp | 1,386,448 | -3.49 | 61,198 | -2.38 | ||||
| 2025-07-21 | 13F | Empirical Financial Services, LLC d.b.a. Empirical Wealth Management | 5,471 | -0.87 | 241 | 0.42 | ||||
| 2025-08-11 | 13F | Principal Securities, Inc. | 16 | 0.00 | 1 | |||||
| 2025-08-14 | 13F | CoreCap Advisors, LLC | 3,152 | -4.40 | 139 | -2.80 | ||||
| 2025-07-31 | 13F/A | Avion Wealth | 110 | 0.00 | 0 | |||||
| 2025-07-25 | 13F | Cwm, Llc | 2,379 | 8.48 | 0 | |||||
| 2025-08-14 | 13F | Wells Fargo & Company/mn | 14,972 | -3.07 | 661 | -2.08 | ||||
| 2025-07-31 | 13F | Hoge Financial Services, Llc | 6,830 | -26.21 | 301 | -25.31 | ||||
| 2025-08-14 | 13F | Susquehanna International Group, Llp | 8,532 | -29.63 | 377 | -28.92 | ||||
| 2025-08-04 | 13F | Jim Saulnier & Associates, Llc | 6,904 | -7.24 | 305 | -6.17 | ||||
| 2025-08-14 | 13F | DHK Financial Advisors, Inc. | 25,481 | 1.02 | 1,125 | 2.18 | ||||
| 2025-07-11 | 13F | Farther Finance Advisors, LLC | 0 | -100.00 | 0 | |||||
| 2025-07-21 | 13F/A | Abacus Planning Group, Inc. | 32,781 | -0.12 | 1,447 | 0.98 | ||||
| 2025-08-11 | 13F | HHM Wealth Advisors, LLC | 24,235 | -19.57 | 1,070 | -18.65 | ||||
| 2025-04-24 | 13F | Decker Retirement Planning Inc. | 0 | -100.00 | 0 | |||||
| 2025-08-08 | 13F | Creative Planning | 21,022 | -2.47 | 928 | -1.38 | ||||
| 2025-08-13 | 13F | Hsbc Holdings Plc | 446,114 | -2.51 | 19,691 | -1.39 | ||||
| 2025-07-10 | 13F | Wealth Enhancement Advisory Services, Llc | 9,474 | -42.38 | 422 | -41.14 | ||||
| 2025-08-18 | 13F | N.E.W. Advisory Services LLC | 4,447 | -0.31 | 196 | 1.03 | ||||
| 2025-08-27 | 13F/A | Brinker Capital Investments, LLC | 18,159 | 28.62 | 802 | 30.03 | ||||
| 2025-05-15 | 13F | Glenmede Trust Co Na | 898,714 | -2.40 | 39,220 | -0.69 | ||||
| 2025-05-14 | 13F | Van Hulzen Asset Management, LLC | 0 | -100.00 | 0 | -100.00 | ||||
| 2025-07-25 | 13F | Endowment Wealth Management, Inc. | 4,658 | 206 | ||||||
| 2025-08-14 | 13F | Colony Group, LLC | 60,894 | -9.79 | 2,688 | -8.76 | ||||
| 2025-08-11 | 13F | Citigroup Inc | 0 | -100.00 | 0 | |||||
| 2025-07-24 | 13F | Trust Co Of Toledo Na /oh/ | 300 | 13 | ||||||
| 2025-08-14 | 13F | Cardiff Park Advisors, Llc | 1,591 | 0.00 | 70 | 1.45 | ||||
| 2025-08-12 | 13F | Integrated Advisors Network LLC | 9,098 | -3.35 | 402 | -2.20 | ||||
| 2025-04-14 | 13F | First Citizens Bank & Trust Co | 0 | -100.00 | 0 | |||||
| 2025-08-13 | 13F | SageView Advisory Group, LLC | 7,197 | 11.32 | 317 | 12.06 | ||||
| 2025-08-14 | 13F | Old Mission Capital Llc | 0 | -100.00 | 0 | |||||
| 2025-07-09 | 13F | Brand Asset Management Group, Inc. | 21,733 | 5.28 | 959 | 6.56 | ||||
| 2025-08-11 | 13F | Heritage Wealth Advisors | 21 | 0.00 | 1 | |||||
| 2025-08-14 | 13F | Bank Of America Corp /de/ | 1,443,869 | 1.40 | 63,732 | 2.56 | ||||
| 2025-07-10 | 13F | Farmers & Merchants Trust Co of Chambersburg PA | 298 | 0.00 | 0 | |||||
| 2025-07-08 | 13F | Apella Capital, LLC | 23,738 | -27.73 | 1,048 | -22.56 | ||||
| 2025-08-13 | 13F | Beacon Pointe Advisors, LLC | 62,868 | -16.48 | 2,775 | -15.56 | ||||
| 2025-08-14 | 13F | State Street Corp | 6,154,007 | 4.38 | 271,638 | 5.58 | ||||
| 2025-08-04 | 13F | Wolverine Asset Management Llc | 22,393 | 988 | ||||||
| 2025-08-06 | 13F | Savant Capital, LLC | 21,736 | -8.72 | 959 | -7.70 | ||||
| 2025-08-11 | 13F | One Capital Management, LLC | 72,421 | -2.57 | 3,197 | -1.45 | ||||
| 2025-08-08 | 13F | Pnc Financial Services Group, Inc. | 1,744 | 217.09 | 77 | 216.67 | ||||
| 2025-08-13 | 13F | Cerity Partners LLC | 130,714 | -0.18 | 5,770 | 0.96 | ||||
| 2025-07-22 | 13F | Aspire Private Capital, LLC | 18,613 | 0.44 | 822 | 1.61 | ||||
| 2025-07-07 | 13F | Thurston, Springer, Miller, Herd & Titak, Inc. | 72 | 0.00 | 3 | 0.00 | ||||
| 2025-07-24 | 13F | Lester Murray Antman dba SimplyRich | 23,237 | 0.00 | 1 | 0.00 | ||||
| 2025-04-11 | 13F | Princeton Global Asset Management LLC | 0 | -100.00 | 0 | |||||
| 2025-08-14 | 13F | Goldman Sachs Group Inc | 567,912 | 1.54 | 25,068 | 2.70 | ||||
| 2025-08-28 | NP | SSCJX - State Street Target Retirement 2035 Fund Class I This fund is a listed as child fund of State Street Corp and if that institution has disclosed ownership in this security, then these positions will not be double counted when calculating total shares and total value | 187,815 | 103.54 | 8,290 | 105.91 | ||||
| 2025-08-07 | 13F | Tilson Financial Group, Inc. | 7,312 | 0 | ||||||
| 2025-08-13 | 13F | Nicolet Advisory Services, Llc | 8,117 | -3.05 | 354 | 4.44 | ||||
| 2025-08-08 | 13F | Cetera Investment Advisers | 42,051 | 0.44 | 1,856 | 1.59 | ||||
| 2025-04-04 | 13F | Webster Bank, N. A. | 0 | -100.00 | 0 | |||||
| 2025-07-15 | 13F | Mather Group, Llc. | 0 | -100.00 | 0 | |||||
| 2025-07-16 | 13F | ORG Wealth Partners, LLC | 17 | 0.00 | 1 | |||||
| 2025-08-06 | 13F | Modera Wealth Management, LLC | 208,895 | -0.21 | 9,221 | 0.93 | ||||
| 2025-07-17 | 13F | Emerald Advisors, LLC | 5,943 | 262 | ||||||
| 2025-03-28 | 13F/A | Berkeley, Inc | 0 | -100.00 | 0 | -100.00 | ||||
| 2025-07-22 | 13F | USAdvisors Wealth Management, LLC | 4,840 | 1.49 | 0 | |||||
| 2025-08-12 | 13F | CIBC Private Wealth Group, LLC | 0 | -100.00 | 0 | |||||
| 2025-08-12 | 13F | Sky-mountain Capital Management, Inc. | 8,897 | -49.41 | 395 | -48.63 | ||||
| 2025-08-15 | 13F | Kestra Advisory Services, LLC | 5,368 | 237 | ||||||
| 2025-07-14 | 13F | Park Avenue Securities Llc | 64,828 | 3 | ||||||
| 2025-07-25 | 13F | Envestnet Portfolio Solutions, Inc. | 4,988 | -33.45 | 220 | -32.72 | ||||
| 2025-08-13 | 13F | Transce3nd, LLC | 439 | 3.54 | 19 | 5.56 | ||||
| 2025-07-17 | 13F | XML Financial, LLC | 15,170 | 0.75 | 670 | 1.83 | ||||
| 2025-07-03 | 13F | Fiduciary Financial Group, Llc | 22,115 | 3.41 | 985 | 13.76 | ||||
| 2025-07-29 | 13F | Orin Green Financial, LLC | 115,241 | 0.14 | 5,087 | 5.15 | ||||
| 2025-08-07 | 13F/A | Joseph Group Capital Management | 1,185 | -8.42 | 52 | -7.14 | ||||
| 2025-05-15 | 13F | Citadel Advisors Llc | 0 | -100.00 | 0 | |||||
| 2025-08-11 | 13F | CBIZ Investment Advisory Services, LLC | 11 | -96.71 | 0 | -100.00 | ||||
| 2025-08-14 | 13F | Comerica Bank | 355 | 0.00 | 16 | 0.00 | ||||
| 2025-08-05 | 13F | Tsfg, Llc | 120 | 0.84 | 0 | |||||
| 2025-08-14 | 13F | Glenmede Investment Management, LP | 776,801 | 34,288 | ||||||
| 2025-07-10 | 13F | Envision Financial LLC | 10,543 | -0.60 | 465 | 0.65 | ||||
| 2025-08-12 | 13F | Global Retirement Partners, LLC | 930 | -6.25 | 41 | -2.38 | ||||
| 2025-08-18 | 13F | Geneos Wealth Management Inc. | 215 | 0.00 | 9 | 0.00 | ||||
| 2025-07-25 | 13F | Fifth Third Wealth Advisors LLC | 6,054 | -25.22 | 267 | -24.36 | ||||
| 2025-08-13 | 13F | Natixis Advisors, L.p. | 69,538 | 0.48 | 3 | 0.00 | ||||
| 2025-08-01 | 13F | First Command Advisory Services, Inc. | 3,474 | -34.55 | 153 | -33.77 | ||||
| 2025-08-14 | 13F | FC Advisory LLC | 7,137 | -2.94 | 315 | -1.56 | ||||
| 2025-05-15 | 13F | Manufacturers Life Insurance Company, The | 0 | -100.00 | 0 | |||||
| 2025-08-15 | 13F | Morgan Stanley | 420,759 | -1.62 | 18,572 | -0.49 | ||||
| 2025-07-31 | 13F | Cambridge Investment Research Advisors, Inc. | 70,050 | 1.29 | 3 | 0.00 | ||||
| 2025-07-18 | 13F | Trust Co Of Vermont | 88 | 0.00 | 4 | 0.00 | ||||
| 2025-08-28 | NP | SSFNX - State Street Target Retirement Fund Class I This fund is a listed as child fund of State Street Corp and if that institution has disclosed ownership in this security, then these positions will not be double counted when calculating total shares and total value | 1,713,647 | -0.38 | 75,640 | 0.77 | ||||
| 2025-08-05 | 13F | Key FInancial Inc | 37 | 0.00 | 2 | 0.00 | ||||
| 2025-08-13 | 13F | Capital Analysts, Inc. | 1,787 | 0.90 | 0 | |||||
| 2025-08-14 | 13F | Family Office Research LLC | 13,547 | -32.03 | 598 | -31.19 | ||||
| 2025-07-15 | 13F | Main Street Group, LTD | 672 | -2.75 | 30 | -3.33 | ||||
| 2025-07-29 | 13F | Private Trust Co Na | 48 | 0.00 | 2 | 0.00 | ||||
| 2025-08-08 | 13F | Hartland & Co., LLC | 250 | -84.11 | 11 | -83.82 | ||||
| 2025-07-28 | 13F | Lunt Capital Management, Inc. | 10,764 | 475 | ||||||
| 2025-07-22 | 13F | Coastal Investment Advisors, Inc. | 83 | 0.00 | 4 | 0.00 |
Other Listings
| MX:RWO |