Mga Batayang Estadistika
| Pemilik Institusional | 101 total, 101 long only, 0 short only, 0 long/short - change of 8.60% MRQ |
| Alokasi Portofolio Rata-rata | 1.0273 % - change of 4.49% MRQ |
| Saham Institusional (Jangka Panjang) | 53,095,812 (ex 13D/G) - change of 23.93MM shares 82.03% MRQ |
| Nilai Institusional (Jangka Panjang) | $ 2,925,306 USD ($1000) |
Kepemilikan Institusional dan Pemegang Saham
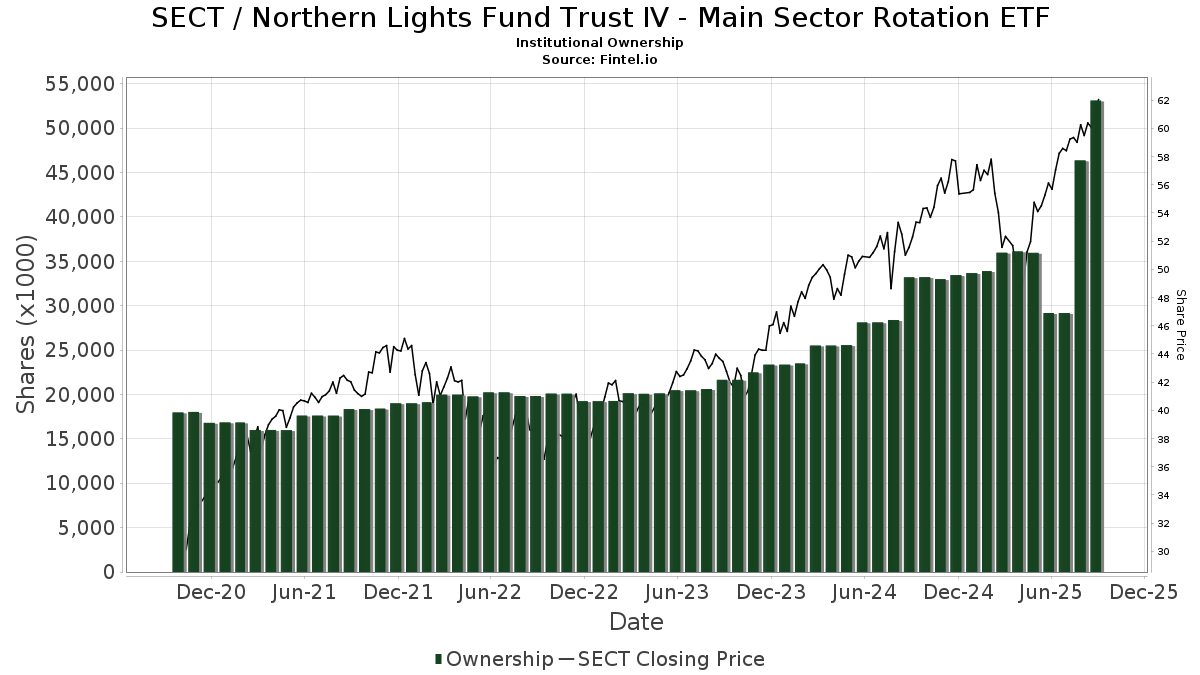
Northern Lights Fund Trust IV - Main Sector Rotation ETF (US:SECT) memiliki 101 pemilik institusional dan pemegang saham yang telah mengajukan formulir 13D/G atau 13F kepada Komisi Bursa Efek (Securities Exchange Commission/SEC). Lembaga-lembaga ini memegang total 53,095,812 saham. Pemegang saham terbesar meliputi Orion Portfolio Solutions, LLC, Brinker Capital Investments, LLC, Advisor Group Holdings, Inc., LPL Financial LLC, Envestnet Asset Management Inc, Potomac Fund Management Inc /adv, Integrated Wealth Concepts LLC, Change Path, LLC, GeoWealth Management, LLC, and Madrona Financial Services, LLC .
Struktur kepemilikan institusional Northern Lights Fund Trust IV - Main Sector Rotation ETF (BATS:SECT) menunjukkan posisi terkini di perusahaan oleh institusi dan dana, serta perubahan terbaru dalam ukuran posisi. Pemegang saham utama dapat mencakup investor individu, reksa dana, dana lindung nilai, atau institusi. Jadwal 13D menunjukkan bahwa investor memegang (atau pernah memegang) lebih dari 5% saham perusahaan dan bermaksud (atau pernah bermaksud) untuk secara aktif mengejar perubahan strategi bisnis. Jadwal 13G menunjukkan investasi pasif lebih dari 5%.
The share price as of September 5, 2025 is 60.60 / share. Previously, on September 6, 2024, the share price was 49.81 / share. This represents an increase of 21.66% over that period.
Skor Sentimen Dana
Skor Sentimen Dana (sebelumnya dikenal sebagai Skor Akumulasi Kepemilikan) menemukan saham-saham yang paling banyak dibeli oleh dana. Ini adalah hasil dari model kuantitatif multi-faktor yang canggih yang mengidentifikasi perusahaan dengan tingkat akumulasi institusional tertinggi. Model penilaian menggunakan kombinasi dari total peningkatan pemilik yang diungkapkan, perubahan dalam alokasi portofolio pada pemilik tersebut, dan metrik lainnya. Angka berkisar dari 0 hingga 100, dengan angka yang lebih tinggi menunjukkan tingkat akumulasi yang lebih tinggi dibandingkan dengan perusahaan sejenisnya, dan 50 adalah rata-ratanya.
Frekuensi Pembaruan: Setiap Hari
Lihat Ownership Explorer, yang menyediakan daftar perusahaan dengan peringkat tertinggi.
Rasio Put/Call Institusional
Selain melaporkan isu ekuitas dan utang standar, institusi dengan aset di bawah manajemen lebih dari 100 juta dolar AS juga harus mengungkapkan kepemilikan opsi put dan call mereka. Karena opsi put umumnya menunjukkan sentimen negatif, dan opsi call menunjukkan sentimen positif, kita dapat mengetahui sentimen institusional secara keseluruhan dengan memplot rasio put terhadap call. Grafik di sebelah kanan memplot rasio put/call historis untuk instrumen ini.
Menggunakan Rasio Put/Call sebagai indikator sentimen investor mengatasi salah satu kekurangan utama dari penggunaan total kepemilikan institusional, yaitu sejumlah besar aset yang dikelola diinvestasikan secara pasif untuk melacak indeks. Dana yang dikelola secara pasif biasanya tidak membeli opsi, sehingga indikator rasio put/call lebih akurat dalam melacak sentimen dana yang dikelola secara aktif.
Pengajuan 13F dan NPORT
Detail pada pengajuan 13F tersedia gratis. Detail pada pengajuan NP memerlukan keanggotaan premium. Baris berwarna hijau menunjukkan posisi baru. Baris berwarna merah menunjukkan posisi yang sudah ditutup. Klik tautan ini ikon untuk melihat riwayat transaksi selengkapnya.
Tingkatkan
untuk membuka data premium dan mengekspor ke Excel ![]() .
.
| Tanggal File | Sumber | Investor | Ketik | Presyo ng Avg (Silangan) |
Saham | Δ Saham (%) |
Dilaporkan Nilai ($1000) |
Nilai Δ (%) |
Alokasi Port (%) |
|
|---|---|---|---|---|---|---|---|---|---|---|
| 2025-08-12 | 13F | Coldstream Capital Management Inc | 3,840 | 44.47 | 223 | 64.44 | ||||
| 2025-08-13 | 13F | Copley Financial Group, Inc. | 301,629 | -12.14 | 17,516 | -0.08 | ||||
| 2025-08-07 | 13F | Encompass More Asset Management | 223,230 | -5.42 | 12,963 | 7.56 | ||||
| 2025-07-21 | 13F | Triad Wealth Partners, LLC | 26,460 | 1,537 | ||||||
| 2025-08-18 | 13F | Geneos Wealth Management Inc. | 88,809 | 60.37 | 5,157 | 82.42 | ||||
| 2025-07-25 | 13F | Cwm, Llc | 102,998 | -3.29 | 6 | 0.00 | ||||
| 2025-08-20 | 13F/A | Coppell Advisory Solutions LLC | 10,523 | 607 | ||||||
| 2025-08-11 | 13F | Private Advisor Group, LLC | 11,472 | 21.01 | 666 | 37.60 | ||||
| 2025-08-14 | 13F | Aqr Capital Management Llc | 5,844 | 339 | ||||||
| 2025-08-12 | 13F | Global Retirement Partners, LLC | 980 | 5.15 | 57 | 9.80 | ||||
| 2025-07-28 | 13F | WealthPLAN Partners, LLC | 320,140 | 2.27 | 18,591 | 16.31 | ||||
| 2025-08-14 | 13F | Integrated Wealth Concepts LLC | 655,583 | -29.44 | 38,070 | -19.75 | ||||
| 2025-08-01 | 13F | Envestnet Asset Management Inc | 1,094,863 | 16.90 | 63,579 | 32.94 | ||||
| 2025-05-28 | 13F | GK Wealth Management LLC | 0 | -100.00 | 0 | |||||
| 2025-08-13 | 13F | Gibbs Wealth Management | 28,471 | 1,653 | ||||||
| 2025-07-15 | 13F | World Equity Group, Inc. | 38,325 | -11.48 | 2,226 | 0.68 | ||||
| 2025-08-08 | 13F | Cetera Investment Advisers | 157,823 | 21.00 | 9,165 | 37.60 | ||||
| 2025-04-14 | 13F | Toth Financial Advisory Corp | 0 | -100.00 | 0 | |||||
| 2025-08-01 | 13F | Brookwood Investment Group LLC | 10,103 | -2.67 | 587 | 10.78 | ||||
| 2025-07-09 | 13F | Fiduciary Alliance LLC | 36,519 | -28.62 | 2,121 | -18.84 | ||||
| 2025-07-31 | 13F | Cambridge Investment Research Advisors, Inc. | 64,475 | -5.33 | 4 | 0.00 | ||||
| 2025-07-25 | 13F | Envestnet Portfolio Solutions, Inc. | 192,624 | -60.73 | 11,186 | -55.34 | ||||
| 2025-08-12 | 13F | Change Path, LLC | 569,987 | 1.77 | 33,099 | 15.75 | ||||
| 2025-07-18 | 13F | PFG Investments, LLC | 13,462 | 0.00 | 782 | 13.68 | ||||
| 2025-08-12 | 13F | LPL Financial LLC | 2,958,356 | 50.16 | 171,792 | 70.77 | ||||
| 2025-08-12 | 13F | CIBC Private Wealth Group, LLC | 10,427 | -2.84 | 605 | 24.74 | ||||
| 2025-08-14 | 13F | Wells Fargo & Company/mn | 7,835 | -5.77 | 455 | 7.08 | ||||
| 2025-08-11 | 13F | Synergy Investment Management, LLC | 44,138 | 1.23 | 2,563 | 6.97 | ||||
| 2025-08-15 | 13F/A | Florida Financial Advisors, Llc | 31,227 | -14.09 | 1,813 | -2.26 | ||||
| 2025-08-07 | 13F | Allworth Financial LP | 8,092 | 0.00 | 470 | 15.23 | ||||
| 2025-08-07 | 13F | Meeder Advisory Services, Inc. | 6,920 | -25.97 | 402 | -15.93 | ||||
| 2025-05-15 | 13F | Creative Planning | 0 | -100.00 | 0 | |||||
| 2025-04-23 | 13F | Crewe Advisors LLC | 0 | -100.00 | 0 | |||||
| 2025-07-23 | 13F | Defined Financial Planning LLC | 116,273 | 7.55 | 6,773 | 22.35 | ||||
| 2025-08-13 | 13F | Townsquare Capital Llc | 4,125 | -99.13 | 240 | -99.01 | ||||
| 2025-07-28 | 13F | Mutual Advisors, LLC | 230,000 | 0.89 | 13,664 | 18.13 | ||||
| 2025-07-29 | 13F | Koshinski Asset Management, Inc. | 20,094 | 19.72 | 1,167 | 36.21 | ||||
| 2025-08-12 | 13F | Main Management LLC | 387,494 | -0.83 | 23 | 15.79 | ||||
| 2025-07-10 | 13F | Signal Advisors Wealth, LLC | 3,877 | 225 | ||||||
| 2025-07-10 | 13F | Sovran Advisors, LLC | 6,139 | -6.66 | 357 | 13.33 | ||||
| 2025-07-16 | 13F | Independent Wealth Network Inc. | 20,313 | -2.12 | 1,180 | 11.33 | ||||
| 2025-08-18 | 13F | Tactive Advisors, LLC | 48,566 | 2,820 | ||||||
| 2025-07-07 | 13F | Discipline Wealth Solutions, LLC | 32,845 | -1.95 | 1,907 | 11.52 | ||||
| 2025-08-04 | 13F | Buck Wealth Strategies, LLC | 5,437 | 316 | ||||||
| 2025-07-09 | 13F | VisionPoint Advisory Group, LLC | 20,809 | 65.97 | 1,208 | 88.75 | ||||
| 2025-08-06 | 13F | Commonwealth Equity Services, Llc | 25,852 | -16.35 | 2 | 0.00 | ||||
| 2025-08-19 | 13F | Advisory Services Network, LLC | 10,924 | -4.50 | 643 | 9.93 | ||||
| 2025-04-23 | 13F | Mascagni Wealth Management, Inc. | 0 | -100.00 | 0 | -100.00 | ||||
| 2025-08-19 | 13F | Anchor Investment Management, LLC | 4,257 | 0.00 | 247 | 13.82 | ||||
| 2025-03-18 | 13F/A | Bank Of America Corp /de/ | 0 | -100.00 | 0 | |||||
| 2025-05-15 | 13F | GWM Advisors LLC | 0 | -100.00 | 0 | -100.00 | ||||
| 2025-08-07 | 13F | Nwam Llc | 0 | -100.00 | 0 | |||||
| 2025-08-04 | 13F | Barnes Dennig Private Wealth Management LLC | 4,041 | 0.00 | 235 | 13.59 | ||||
| 2025-08-12 | 13F | Nemes Rush Group LLC | 2,633 | 0.00 | 153 | 13.43 | ||||
| 2025-08-14 | 13F | Royal Bank Of Canada | 985 | 0.00 | 57 | 14.00 | ||||
| 2025-08-14 | 13F | Citadel Advisors Llc | 31,964 | 299.05 | 1,856 | 354.90 | ||||
| 2025-08-12 | 13F | Steward Partners Investment Advisory, Llc | 2,827 | 0.00 | 164 | 13.89 | ||||
| 2025-08-13 | 13F | Cerity Partners LLC | 3,949 | 0.00 | 229 | 13.93 | ||||
| 2025-08-01 | 13F | Gwn Securities Inc. | 82,106 | 16.23 | 4,770 | 27.65 | ||||
| 2025-08-15 | 13F | Morgan Stanley | 1,802 | 24.10 | 105 | 40.54 | ||||
| 2025-08-14 | 13F | Potomac Fund Management Inc /adv | 804,635 | 6.70 | 46,999 | 33.06 | ||||
| 2025-05-14 | 13F | Atomi Financial Group, Inc. | 0 | -100.00 | 0 | |||||
| 2025-07-15 | 13F | Armis Advisers, LLC | 10,658 | 621 | ||||||
| 2025-08-13 | 13F | EverSource Wealth Advisors, LLC | 3,202 | -0.34 | 186 | 12.80 | ||||
| 2025-08-14 | 13F | Diversify Advisory Services, LLC | 6,456 | 0.59 | 387 | 17.68 | ||||
| 2025-08-06 | 13F | Ethos Financial Group, LLC | 6,016 | 0.00 | 349 | 5.76 | ||||
| 2025-08-08 | 13F | Foundations Investment Advisors, LLC | 10,961 | -20.16 | 637 | -9.27 | ||||
| 2025-08-11 | 13F | Aptus Capital Advisors, LLC | 3,301 | -28.46 | 192 | -18.72 | ||||
| 2025-08-14 | 13F | Susquehanna International Group, Llp | 4,263 | -62.21 | 248 | -57.04 | ||||
| 2025-07-28 | 13F | Lunt Capital Management, Inc. | 41,995 | 0.68 | 2,439 | 14.51 | ||||
| 2025-08-12 | 13F | J.w. Cole Advisors, Inc. | 8,596 | 499 | ||||||
| 2025-07-18 | 13F | Cooper Financial Group | 0 | -100.00 | 0 | |||||
| 2025-08-12 | 13F | Bravias Capital Group, LLC | 28,731 | -12.04 | 1,668 | 0.06 | ||||
| 2025-07-18 | 13F | Madrona Financial Services, LLC | 425,082 | 1.48 | 24,684 | 15.41 | ||||
| 2025-07-31 | 13F | Richards, Merrill & Peterson, Inc. | 0 | -100.00 | 0 | |||||
| 2025-07-28 | 13F | Harbour Investments, Inc. | 4,855 | 0.00 | 282 | 13.77 | ||||
| 2025-08-04 | 13F | Spire Wealth Management | 127,851 | -34.56 | 7,190 | -27.93 | ||||
| 2025-08-14 | 13F | Jane Street Group, Llc | 4,467 | -62.74 | 259 | -57.68 | ||||
| 2025-08-12 | 13F | TCP Asset Management, LLC | 12,266 | 0.00 | 712 | 13.74 | ||||
| 2025-08-14 | 13F | Raymond James Financial Inc | 517 | 30 | ||||||
| 2025-04-22 | 13F | FSC Wealth Advisors, LLC | 0 | -100.00 | 0 | |||||
| 2025-08-12 | 13F | Jpmorgan Chase & Co | 181 | -52.12 | 11 | -47.37 | ||||
| 2025-05-15 | 13F/A | Orion Portfolio Solutions, LLC | 17,670,190 | -1.36 | 902,240 | -8.36 | ||||
| 2025-08-12 | 13F | Proequities, Inc. | 0 | 0 | ||||||
| 2025-07-30 | 13F | Advantage Trust Co | 39,586 | 2.38 | 2,299 | 16.41 | ||||
| 2025-08-11 | 13F | Brass Tax Wealth Management, Inc | 42,406 | 9.42 | 2,463 | 24.47 | ||||
| 2025-07-28 | 13F | RFG Advisory, LLC | 10,435 | -5.56 | 606 | 7.27 | ||||
| 2025-08-05 | 13F | Westside Investment Management, Inc. | 834 | 0.00 | 48 | 14.29 | ||||
| 2025-08-04 | 13F | Assetmark, Inc | 1,707 | -14.78 | 99 | -2.94 | ||||
| 2025-07-16 | 13F | Perigon Wealth Management, LLC | 4,218 | 245 | ||||||
| 2025-08-05 | 13F | Sigma Planning Corp | 111,266 | -0.32 | 6,461 | 13.37 | ||||
| 2025-08-15 | 13F | Kestra Advisory Services, LLC | 14,365 | 7.17 | 834 | 21.93 | ||||
| 2025-07-28 | 13F | Rosenberg Matthew Hamilton | 1,379 | -0.65 | 80 | 14.29 | ||||
| 2025-07-30 | 13F | Eqis Capital Management, Inc. | 48,478 | 3.47 | 2,815 | 17.68 | ||||
| 2025-08-14 | 13F | Old Mission Capital Llc | 17,575 | 97.74 | 1,021 | 125.17 | ||||
| 2025-08-04 | 13F | Arkadios Wealth Advisors | 3,777 | 219 | ||||||
| 2025-07-25 | 13F | Atria Wealth Solutions, Inc. | 108,779 | -75.66 | 6,326 | -72.28 | ||||
| 2025-07-11 | 13F | Farther Finance Advisors, LLC | 8,461 | -3.07 | 491 | 10.09 | ||||
| 2025-07-22 | 13F | Simplicity Wealth,LLC | 7,598 | 0.00 | 441 | 13.95 | ||||
| 2025-08-13 | 13F | Continuum Advisory, LLC | 0 | -100.00 | 0 | |||||
| 2025-08-13 | 13F | GeoWealth Management, LLC | 512,662 | 27.87 | 29,770 | 45.43 | ||||
| 2025-07-02 | 13F | McAlister, Sweet & Associates, Inc. | 0 | -100.00 | 0 | |||||
| 2025-08-12 | 13F | CFC Planning Co LLC | 39,489 | -1.85 | 2,293 | 11.64 | ||||
| 2025-08-13 | 13F | Natixis Advisors, L.p. | 13,380 | -5.15 | 1 | |||||
| 2025-08-06 | 13F | AE Wealth Management LLC | 5,552 | -17.26 | 322 | -5.85 | ||||
| 2025-08-13 | 13F | Echo45 Advisors LLC | 69,990 | -0.37 | 4,064 | 13.30 | ||||
| 2025-08-12 | 13F | Financial Advocates Investment Management | 8,557 | -13.83 | 497 | -2.17 | ||||
| 2025-07-16 | 13F | Signaturefd, Llc | 8,511 | 494 | ||||||
| 2025-08-14 | 13F | Tripletail Wealth Management, LLC | 18,510 | 1,098 | ||||||
| 2025-08-13 | 13F | Northwestern Mutual Wealth Management Co | 0 | -100.00 | 0 | |||||
| 2025-09-04 | 13F/A | Advisor Group Holdings, Inc. | 6,666,366 | 3,879.94 | 387,116 | 4,426.61 | ||||
| 2025-08-04 | 13F | Integrity Alliance, Llc. | 184,016 | -36.13 | 10,686 | -27.36 | ||||
| 2025-08-08 | 13F | Avantax Advisory Services, Inc. | 155,435 | 5.72 | 9,026 | 20.23 | ||||
| 2025-08-27 | 13F/A | Brinker Capital Investments, LLC | 17,533,925 | -0.77 | 1,018,195 | 12.85 | ||||
| 2025-07-14 | 13F | Painted Porch Advisors LLC | 0 | -100.00 | 0 | -100.00 | ||||
| 2025-08-04 | 13F | Atria Investments Llc | 165,743 | -0.23 | 9,625 | 13.46 | ||||
| 2025-07-24 | 13F | IFP Advisors, Inc | 991 | -69.45 | 58 | -65.45 | ||||
| 2025-07-11 | 13F | SILVER OAK SECURITIES, Inc | 25,131 | 14.92 | 1,459 | 30.85 |