Mga Batayang Estadistika
| Pemilik Institusional | 173 total, 173 long only, 0 short only, 0 long/short - change of 2.37% MRQ |
| Alokasi Portofolio Rata-rata | 0.2883 % - change of 0.27% MRQ |
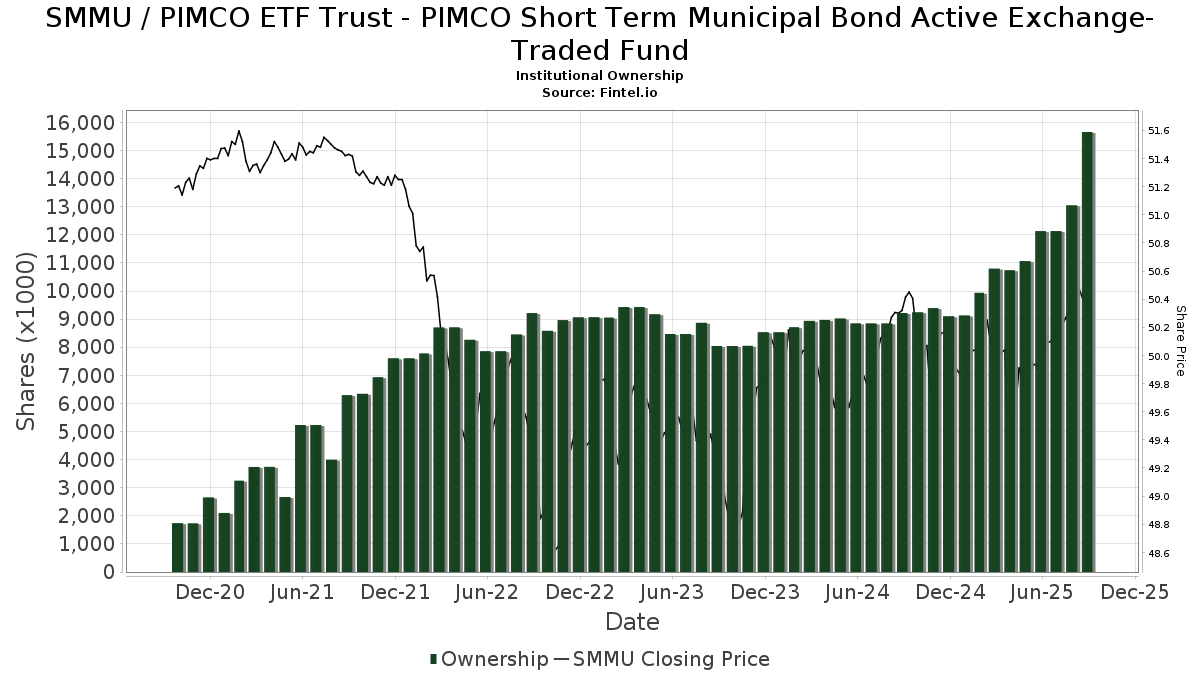
| Saham Institusional (Jangka Panjang) | 15,659,884 (ex 13D/G) - change of 3.53MM shares 29.08% MRQ |
| Nilai Institusional (Jangka Panjang) | $ 749,317 USD ($1000) |
Kepemilikan Institusional dan Pemegang Saham
PIMCO ETF Trust - PIMCO Short Term Municipal Bond Active Exchange-Traded Fund (US:SMMU) memiliki 173 pemilik institusional dan pemegang saham yang telah mengajukan formulir 13D/G atau 13F kepada Komisi Bursa Efek (Securities Exchange Commission/SEC). Lembaga-lembaga ini memegang total 15,659,884 saham. Pemegang saham terbesar meliputi Morgan Stanley, Stonebridge Financial Group, LLC, Bank Of America Corp /de/, Jpmorgan Chase & Co, Wealth Enhancement Advisory Services, Llc, Cetera Investment Advisers, Sagespring Wealth Partners, Llc, Cwm, Llc, Captrust Financial Advisors, and LPL Financial LLC .
Struktur kepemilikan institusional PIMCO ETF Trust - PIMCO Short Term Municipal Bond Active Exchange-Traded Fund (ARCA:SMMU) menunjukkan posisi terkini di perusahaan oleh institusi dan dana, serta perubahan terbaru dalam ukuran posisi. Pemegang saham utama dapat mencakup investor individu, reksa dana, dana lindung nilai, atau institusi. Jadwal 13D menunjukkan bahwa investor memegang (atau pernah memegang) lebih dari 5% saham perusahaan dan bermaksud (atau pernah bermaksud) untuk secara aktif mengejar perubahan strategi bisnis. Jadwal 13G menunjukkan investasi pasif lebih dari 5%.
The share price as of September 5, 2025 is 50.52 / share. Previously, on September 9, 2024, the share price was 50.33 / share. This represents an increase of 0.37% over that period.
Skor Sentimen Dana
Skor Sentimen Dana (sebelumnya dikenal sebagai Skor Akumulasi Kepemilikan) menemukan saham-saham yang paling banyak dibeli oleh dana. Ini adalah hasil dari model kuantitatif multi-faktor yang canggih yang mengidentifikasi perusahaan dengan tingkat akumulasi institusional tertinggi. Model penilaian menggunakan kombinasi dari total peningkatan pemilik yang diungkapkan, perubahan dalam alokasi portofolio pada pemilik tersebut, dan metrik lainnya. Angka berkisar dari 0 hingga 100, dengan angka yang lebih tinggi menunjukkan tingkat akumulasi yang lebih tinggi dibandingkan dengan perusahaan sejenisnya, dan 50 adalah rata-ratanya.
Frekuensi Pembaruan: Setiap Hari
Lihat Ownership Explorer, yang menyediakan daftar perusahaan dengan peringkat tertinggi.
Rasio Put/Call Institusional
Selain melaporkan isu ekuitas dan utang standar, institusi dengan aset di bawah manajemen lebih dari 100 juta dolar AS juga harus mengungkapkan kepemilikan opsi put dan call mereka. Karena opsi put umumnya menunjukkan sentimen negatif, dan opsi call menunjukkan sentimen positif, kita dapat mengetahui sentimen institusional secara keseluruhan dengan memplot rasio put terhadap call. Grafik di sebelah kanan memplot rasio put/call historis untuk instrumen ini.
Menggunakan Rasio Put/Call sebagai indikator sentimen investor mengatasi salah satu kekurangan utama dari penggunaan total kepemilikan institusional, yaitu sejumlah besar aset yang dikelola diinvestasikan secara pasif untuk melacak indeks. Dana yang dikelola secara pasif biasanya tidak membeli opsi, sehingga indikator rasio put/call lebih akurat dalam melacak sentimen dana yang dikelola secara aktif.
Pengajuan 13F dan NPORT
Detail pada pengajuan 13F tersedia gratis. Detail pada pengajuan NP memerlukan keanggotaan premium. Baris berwarna hijau menunjukkan posisi baru. Baris berwarna merah menunjukkan posisi yang sudah ditutup. Klik tautan ini ikon untuk melihat riwayat transaksi selengkapnya.
Tingkatkan
untuk membuka data premium dan mengekspor ke Excel ![]() .
.
| Tanggal File | Sumber | Investor | Ketik | Presyo ng Avg (Silangan) |
Saham | Δ Saham (%) |
Dilaporkan Nilai ($1000) |
Nilai Δ (%) |
Alokasi Port (%) |
|
|---|---|---|---|---|---|---|---|---|---|---|
| 2025-08-08 | 13F | TD Capital Management LLC | 368,809 | 8.59 | 18,503 | 8.92 | ||||
| 2025-08-05 | 13F | Dynasty Wealth Management, Llc | 0 | -100.00 | 0 | |||||
| 2025-08-05 | 13F | BCGM Wealth Management, LLC | 24,372 | -8.28 | 1,223 | -8.05 | ||||
| 2025-08-07 | 13F | Allworth Financial LP | 97,905 | 15.12 | 4,912 | 16.18 | ||||
| 2025-07-31 | 13F | Whipplewood Advisors, LLC | 7,157 | 35,685.00 | 359 | 35.98 | ||||
| 2025-08-07 | 13F | Resources Investment Advisors, LLC. | 44,435 | -17.87 | 2,229 | -17.63 | ||||
| 2025-08-13 | 13F | MBM Wealth Consultants, LLC | 60,482 | 7.98 | 3,034 | 8.32 | ||||
| 2025-08-08 | 13F | Cetera Investment Advisers | 681,268 | -11.10 | 34,179 | -10.83 | ||||
| 2025-07-28 | 13F | Allianz Asset Management GmbH | 270 | -1.82 | 14 | 0.00 | ||||
| 2025-07-24 | 13F | Us Bancorp \de\ | 1,715 | 0.00 | 86 | 1.18 | ||||
| 2025-09-04 | 13F/A | Advisor Group Holdings, Inc. | 305,545 | 41.53 | 15,330 | 41.95 | ||||
| 2025-07-22 | 13F | Merit Financial Group, LLC | 6,525 | 327 | ||||||
| 2025-07-31 | 13F | Briaud Financial Planning, Inc | 302 | 0 | ||||||
| 2025-08-11 | 13F | Inspire Advisors, LLC | 31,394 | -6.04 | 1,575 | -5.75 | ||||
| 2025-07-30 | 13F | Onyx Bridge Wealth Group LLC | 10,656 | 0.69 | 535 | 0.95 | ||||
| 2025-07-29 | 13F | Mattson Financial Services, LLC | 0 | -100.00 | 0 | |||||
| 2025-07-24 | 13F | Blair William & Co/il | 1,620 | -25.07 | 81 | -25.00 | ||||
| 2025-08-14 | 13F | Royal Bank Of Canada | 5,521 | -71.26 | 277 | -71.18 | ||||
| 2025-07-22 | 13F | PUREfi Wealth, LLC | 0 | -100.00 | 0 | |||||
| 2025-08-14 | 13F | UBS Group AG | 74,991 | 9.59 | 3,762 | 9.94 | ||||
| 2025-08-12 | 13F | Financial Advocates Investment Management | 13,934 | 202.06 | 699 | 203.91 | ||||
| 2025-08-14 | 13F | Mml Investors Services, Llc | 25,600 | 7.81 | 1 | 0.00 | ||||
| 2025-07-14 | 13F | AdvisorNet Financial, Inc | 12,757 | -8.87 | 640 | -8.57 | ||||
| 2025-08-12 | 13F | J.w. Cole Advisors, Inc. | 8,311 | 417 | ||||||
| 2025-08-14 | 13F | Wiley Bros.-aintree Capital, Llc | 6,882 | 0.00 | 345 | 0.58 | ||||
| 2025-08-14 | 13F | Great Valley Advisor Group, Inc. | 39,716 | 1,993 | ||||||
| 2025-08-14 | 13F | Certified Advisory Corp | 47,013 | 2.97 | 2,359 | 3.29 | ||||
| 2025-07-21 | 13F | AIFG Consultants Ltd. | 42,341 | 0.34 | 2,124 | 0.66 | ||||
| 2025-08-14 | 13F | Beaird Harris Wealth Management, LLC | 13,400 | 41.28 | 672 | 41.77 | ||||
| 2025-04-28 | 13F | Dean, Jacobson Financial Services, LLC | 0 | -100.00 | 0 | |||||
| 2025-07-28 | 13F | Founders Grove Wealth Partners, Llc | 20,035 | 0.00 | 1,005 | 0.30 | ||||
| 2025-08-11 | 13F | Principal Securities, Inc. | 33 | 65.00 | 2 | |||||
| 2025-08-14 | 13F | Clarity Asset Management, Inc. | 0 | -100.00 | 0 | |||||
| 2025-08-14 | 13F | Stifel Financial Corp | 115,993 | -5.78 | 5,819 | -5.49 | ||||
| 2025-07-25 | 13F | Total Clarity Wealth Management, Inc. | 12,901 | -19.44 | 647 | -18.92 | ||||
| 2025-07-29 | 13F | Harbor Asset Planning, Inc. | 690 | 35 | ||||||
| 2025-08-04 | 13F | Creative Financial Designs Inc /adv | 618 | 0.65 | 31 | 0.00 | ||||
| 2025-08-14 | 13F | Warren Averett Asset Management, LLC | 50,017 | -5.91 | 2,509 | -5.64 | ||||
| 2025-08-14 | 13F | Jane Street Group, Llc | 38,787 | 183.12 | 1,946 | 183.94 | ||||
| 2025-08-14 | 13F | Bank Of America Corp /de/ | 1,052,638 | -1.68 | 52,811 | -1.38 | ||||
| 2025-08-08 | 13F | Crossmark Global Holdings, Inc. | 11,860 | -15.90 | 595 | -13.89 | ||||
| 2025-08-08 | 13F | Sittner & Nelson, Llc | 36,038 | 426.10 | 1,808 | 428.65 | ||||
| 2025-07-10 | 13F | Websterrogers Financial Advisors, Llc | 128,660 | 0.76 | 6,455 | 1.05 | ||||
| 2025-08-27 | 13F | Barnes Wealth Management Group, Inc | 7,187 | 0.67 | 361 | 0.84 | ||||
| 2025-08-13 | 13F | Virtue Capital Management, LLC | 0 | -100.00 | 0 | |||||
| 2025-08-13 | 13F | Rockport Wealth LLC | 5,000 | 251 | ||||||
| 2025-08-04 | 13F | Assetmark, Inc | 258 | 1.18 | 13 | 0.00 | ||||
| 2025-08-07 | 13F | Davis R M Inc | 68,370 | 3.86 | 3,430 | 4.19 | ||||
| 2025-08-12 | 13F | Pathstone Holdings, LLC | 0 | -100.00 | 0 | |||||
| 2025-07-15 | 13F | StoneCrest Wealth Management, Inc. | 29,721 | 0.00 | 1,491 | 0.34 | ||||
| 2025-08-14 | 13F | Wells Fargo & Company/mn | 257,033 | -6.44 | 12,895 | -6.16 | ||||
| 2025-07-17 | 13F | Clear Point Advisors Inc. | 7,755 | 0.65 | 389 | 1.04 | ||||
| 2025-07-08 | 13F | IAM Advisory, LLC | 32,254 | 0.63 | 1,618 | 0.94 | ||||
| 2025-04-23 | 13F | Econ Financial Services Corp | 0 | -100.00 | 0 | |||||
| 2025-08-13 | 13F | Baird Financial Group, Inc. | 8,359 | -0.98 | 419 | -0.71 | ||||
| 2025-08-19 | 13F | Newbridge Financial Services Group, Inc. | 579 | 29 | ||||||
| 2025-08-13 | 13F | Cerity Partners LLC | 76,692 | -69.39 | 3,848 | -69.30 | ||||
| 2025-07-02 | 13F | Crumly & Associates Inc. | 68,982 | -7.99 | 3,461 | -7.73 | ||||
| 2025-04-24 | 13F | Boyd Wealth Management, LLC | 0 | -100.00 | 0 | |||||
| 2025-07-30 | 13F | Crewe Advisors LLC | 234 | 12 | ||||||
| 2025-08-12 | 13F | Watchman Group, Inc. | 5,540 | 0.00 | 278 | 0.00 | ||||
| 2025-04-16 | 13F | New Century Financial Group, LLC | 0 | -100.00 | 0 | |||||
| 2025-04-22 | 13F/A | NorthRock Partners, LLC | 0 | -100.00 | 0 | |||||
| 2025-07-10 | 13F | Marshall Financial Group LLC | 5,100 | 0.00 | 256 | 0.00 | ||||
| 2025-08-07 | 13F | Sierra Ocean, Llc | 12,429 | 5.32 | 624 | 5.59 | ||||
| 2025-08-12 | 13F | Proequities, Inc. | 0 | 0 | ||||||
| 2025-07-29 | 13F | Quotient Wealth Partners, LLC | 145,958 | 11.50 | 7,323 | 11.84 | ||||
| 2025-08-04 | 13F | Bridgewealth Advisory Group, LLC | 4,527 | -13.94 | 227 | -13.69 | ||||
| 2025-07-11 | 13F | Farther Finance Advisors, LLC | 19,973 | 5.50 | 1,002 | 5.92 | ||||
| 2025-07-31 | 13F | CVA Family Office, LLC | 2,588 | 0.00 | 130 | 0.00 | ||||
| 2025-07-23 | 13F | L.K. Benson & Company, P.C. | 14,029 | 0.26 | 704 | 0.57 | ||||
| 2025-07-14 | 13F | GAMMA Investing LLC | 133 | -96.63 | 7 | -96.95 | ||||
| 2025-08-05 | 13F | American Institute for Advanced Investment Management, LLP | 4,500 | -19.64 | 226 | -19.64 | ||||
| 2025-07-30 | 13F | LifeWealth Investments, LLC | 35,056 | 0.00 | 1,759 | 0.29 | ||||
| 2025-08-15 | 13F | Captrust Financial Advisors | 524,063 | 13.56 | 26,292 | 13.90 | ||||
| 2025-08-14 | 13F | Raymond James Financial Inc | 192,627 | 12.83 | 9,664 | 13.17 | ||||
| 2025-08-26 | 13F/A | Thrivent Financial For Lutherans | 0 | -100.00 | 0 | -100.00 | ||||
| 2025-08-12 | 13F | Titleist Asset Management, Llc | 13,872 | 32.89 | 696 | 33.14 | ||||
| 2025-05-08 | 13F | LGT Financial Advisors LLC | 0 | -100.00 | 0 | |||||
| 2025-08-12 | 13F | Bedel Financial Consulting, Inc. | 13,184 | 0.00 | 661 | 0.76 | ||||
| 2025-07-15 | 13F | Signet Financial Management, Llc | 90,057 | -1.66 | 4,518 | -1.35 | ||||
| 2025-08-05 | 13F | Westside Investment Management, Inc. | 69,628 | -7.63 | 3,492 | -7.35 | ||||
| 2025-04-29 | 13F | Element Wealth, LLC | 0 | -100.00 | 0 | |||||
| 2025-07-22 | 13F | Unique Wealth, Llc | 69,866 | 82.92 | 3,505 | 83.51 | ||||
| 2025-07-18 | 13F | Magnolia Private Wealth, LLC | 0 | -100.00 | 0 | |||||
| 2025-07-28 | 13F | Axxcess Wealth Management, Llc | 96,870 | 34.86 | 4,860 | 35.27 | ||||
| 2025-08-15 | 13F | Kestra Advisory Services, LLC | 21,329 | -3.51 | 1,070 | -3.17 | ||||
| 2025-08-14 | 13F | Comerica Bank | 26,658 | 306.06 | 1,337 | 307.62 | ||||
| 2025-07-29 | 13F | Madison Wealth Partners, Inc | 4,569 | -20.88 | 229 | -20.49 | ||||
| 2025-08-15 | 13F | Equitable Holdings, Inc. | 16,458 | 20.55 | 826 | 20.97 | ||||
| 2025-08-11 | 13F | PAX Financial Group, LLC | 45,442 | -17.13 | 2,280 | -16.89 | ||||
| 2025-08-14 | 13F | Mercer Global Advisors Inc /adv | 14,644 | 0.00 | 735 | 0.27 | ||||
| 2025-07-22 | 13F | MBL Wealth, LLC | 22,422 | 2.15 | 1,125 | 2.46 | ||||
| 2025-08-05 | 13F | Key FInancial Inc | 989 | 0.00 | 50 | 0.00 | ||||
| 2025-05-15 | 13F/A | Orion Portfolio Solutions, LLC | 31,560 | -3.45 | 1,579 | -3.13 | ||||
| 2025-05-15 | 13F | Garden State Investment Advisory Services LLC | 0 | -100.00 | 0 | |||||
| 2025-08-08 | 13F | Bouchey Financial Group Ltd | 0 | -100.00 | 0 | |||||
| 2025-07-10 | 13F | Wealth Enhancement Advisory Services, Llc | 842,230 | 22.13 | 42,196 | 22.32 | ||||
| 2025-08-12 | 13F | Steward Partners Investment Advisory, Llc | 3,600 | 0.00 | 181 | 0.00 | ||||
| 2025-08-29 | 13F | Centaurus Financial, Inc. | 3,394 | 0 | ||||||
| 2025-08-07 | 13F | Sollinda Capital Management LLC | 4,060 | 0.00 | 204 | 0.00 | ||||
| 2025-08-07 | 13F | PFG Advisors | 9,969 | 10.42 | 500 | 10.86 | ||||
| 2025-07-22 | 13F | DAVENPORT & Co LLC | 26,540 | 31.56 | 1,332 | 31.91 | ||||
| 2025-07-17 | 13F | Beacon Capital Management, LLC | 109 | 0.93 | 5 | 0.00 | ||||
| 2025-07-09 | 13F | Biltmore Wealth Management, LLC | 430,018 | 4.91 | 21,574 | 5.22 | ||||
| 2025-07-15 | 13F | Oak Wealth Advisors LLC | 16,623 | 0.00 | 834 | 0.24 | ||||
| 2025-08-14 | 13F | Susquehanna International Group, Llp | 13,781 | 1.07 | 691 | 1.32 | ||||
| 2025-08-01 | 13F | Envestnet Asset Management Inc | 90,096 | 3.22 | 4,520 | 3.53 | ||||
| 2025-08-14 | 13F/A | Rockefeller Capital Management L.P. | 30,469 | 0.17 | 1,529 | 0.46 | ||||
| 2025-07-24 | 13F | IFP Advisors, Inc | 2,863 | 0.00 | 144 | 0.00 | ||||
| 2025-05-12 | 13F | Independent Advisor Alliance | 0 | -100.00 | 0 | |||||
| 2025-07-31 | 13F | Cambridge Investment Research Advisors, Inc. | 42,231 | -16.44 | 2 | 0.00 | ||||
| 2025-08-14 | 13F | Integrated Wealth Concepts LLC | 4,156 | 209 | ||||||
| 2025-07-22 | 13F | Private Wealth Group, LLC | 7,539 | -13.67 | 378 | -13.30 | ||||
| 2025-07-08 | 13F | Parallel Advisors, LLC | 27 | 1 | ||||||
| 2025-08-08 | 13F | Advyzon Investment Management, LLC | 9,722 | -11.96 | 488 | -11.78 | ||||
| 2025-07-10 | 13F | YHB Investment Advisors, Inc. | 39,857 | 14.99 | 2,000 | 15.35 | ||||
| 2025-08-18 | 13F | Geneos Wealth Management Inc. | 225 | 0.00 | 11 | 0.00 | ||||
| 2025-05-01 | 13F | Bleakley Financial Group, LLC | 0 | -100.00 | 0 | -100.00 | ||||
| 2025-07-24 | 13F | CarsonAllaria Wealth Management, Ltd. | 95,192 | 13.50 | 4,776 | 13.83 | ||||
| 2025-08-14 | 13F | Aqr Capital Management Llc | 0 | -100.00 | 0 | |||||
| 2025-07-14 | 13F | Abacus Planning Group, Inc. | 12,500 | 627 | ||||||
| 2025-08-12 | 13F | LPL Financial LLC | 448,317 | 7.56 | 22,492 | 7.89 | ||||
| 2025-05-12 | 13F | Fmr Llc | 0 | -100.00 | 0 | |||||
| 2025-08-06 | 13F | Commonwealth Equity Services, Llc | 43,323 | 2.72 | 2 | 0.00 | ||||
| 2025-07-09 | 13F | Inspirion Wealth Advisors, Llc | 40,758 | 0.00 | 2,045 | 0.29 | ||||
| 2025-08-14 | 13F | GWM Advisors LLC | 94,843 | 34.12 | 4,758 | 34.52 | ||||
| 2025-08-07 | 13F | Vise Technologies, Inc. | 5,639 | 283 | ||||||
| 2025-07-09 | 13F | Dynamic Advisor Solutions LLC | 32,322 | 0.07 | 1,622 | 0.37 | ||||
| 2025-08-06 | 13F | Atlantic Union Bankshares Corp | 1,330 | 67 | ||||||
| 2025-08-18 | 13F | Hollencrest Capital Management | 1,430 | 0.00 | 72 | 0.00 | ||||
| 2025-07-29 | 13F | Rodgers & Associates, LTD | 9,956 | -4.37 | 499 | -4.04 | ||||
| 2025-07-23 | 13F | Prime Capital Investment Advisors, LLC | 6,175 | 310 | ||||||
| 2025-07-07 | 13F | TruWealth Advisors, LLC | 5,056 | 0.12 | 254 | 0.40 | ||||
| 2025-07-09 | 13F | Summit Financial Consulting LLC | 11,918 | 9.33 | 598 | 9.54 | ||||
| 2025-08-08 | 13F | Avantax Advisory Services, Inc. | 41,349 | 19.39 | 2,074 | 19.75 | ||||
| 2025-08-07 | 13F | Kestra Private Wealth Services, Llc | 4,746 | -16.65 | 238 | -16.20 | ||||
| 2025-08-13 | 13F | Flow Traders U.s. Llc | 0 | -100.00 | 0 | |||||
| 2025-08-11 | 13F | Elequin Capital Lp | 45,444 | 2,280 | ||||||
| 2025-08-13 | 13F | Milestone Investment Advisors LLC | 32,477 | 35.55 | 1,629 | 35.98 | ||||
| 2025-05-09 | 13F | GeoWealth Management, LLC | 0 | -100.00 | 0 | |||||
| 2025-08-18 | 13F | Tyler-Stone Wealth Management | 28,620 | -1.31 | 1,436 | -1.03 | ||||
| 2025-07-29 | 13F | Stratos Wealth Partners, LTD. | 15,138 | 759 | ||||||
| 2025-07-24 | 13F | Capital Advisors, Ltd. LLC | 6,600 | 0.00 | 0 | |||||
| 2025-07-29 | 13F | Private Trust Co Na | 798 | 0.00 | 40 | 2.56 | ||||
| 2025-08-12 | 13F | Change Path, LLC | 8,182 | 1.35 | 411 | 1.74 | ||||
| 2025-08-27 | 13F/A | Brinker Capital Investments, LLC | 21,184 | -32.88 | 1,063 | -32.70 | ||||
| 2025-04-21 | 13F | Nelson, Van Denburg & Campbell Wealth Management Group, LLC | 0 | -100.00 | 0 | |||||
| 2025-07-25 | 13F | Envestnet Portfolio Solutions, Inc. | 5,430 | -14.04 | 272 | -13.65 | ||||
| 2025-08-12 | 13F | Jpmorgan Chase & Co | 893,294 | 123.59 | 44,817 | 124.26 | ||||
| 2025-05-15 | 13F | Mariner, LLC | 0 | -100.00 | 0 | |||||
| 2025-08-08 | 13F | Condor Capital Management | 259,726 | 0.41 | 13,030 | 0.72 | ||||
| 2025-07-08 | 13F | Gradient Investments LLC | 4,271 | 214 | ||||||
| 2025-08-14 | 13F | Family Management Corp | 4,626 | 232 | ||||||
| 2025-07-10 | 13F | Fortress Wealth Management, Inc. | 5,979 | 0.67 | 300 | 0.67 | ||||
| 2025-07-24 | 13F | Cyndeo Wealth Partners, LLC | 22,248 | -40.48 | 1,116 | -40.29 | ||||
| 2025-07-30 | 13F | Wbh Advisory Inc | 8,552 | 0.35 | 429 | 0.70 | ||||
| 2025-08-12 | 13F | Global Retirement Partners, LLC | 16,325 | 16,729.90 | 819 | 20,375.00 | ||||
| 2025-05-13 | 13F | Watts Gwilliam & Co., LLC | 4,013 | 0.00 | 201 | 0.00 | ||||
| 2025-07-28 | 13F | Sagespring Wealth Partners, Llc | 571,694 | 140.22 | 28,682 | 140.94 | ||||
| 2025-08-13 | 13F | Northwestern Mutual Wealth Management Co | 12,440 | 41.69 | 624 | 42.14 | ||||
| 2025-05-12 | 13F | Sandy Spring Bank | 1,293 | -71.99 | 65 | -72.17 | ||||
| 2025-08-04 | 13F | Premier Path Wealth Partners, LLC | 35,813 | -9.83 | 1,797 | -9.57 | ||||
| 2025-07-28 | 13F | Morris Financial Concepts, Inc. | 1,998 | 68.04 | 100 | 69.49 | ||||
| 2025-07-21 | 13F | Ameriflex Group, Inc. | 12 | 0.00 | 1 | |||||
| 2025-07-28 | 13F | Harbour Investments, Inc. | 6,038 | -0.43 | 303 | -0.33 | ||||
| 2025-08-15 | 13F | Morgan Stanley | 3,312,726 | 242.70 | 166,200 | 243.73 | ||||
| 2025-08-06 | 13F | AE Wealth Management LLC | 137 | -2.84 | 7 | -14.29 | ||||
| 2025-07-11 | 13F | LongView Wealth Management | 29,154 | -8.19 | 1,463 | -7.93 | ||||
| 2025-08-13 | 13F | Jones Financial Companies Lllp | 22,253 | 55.83 | 1,116 | 56.74 | ||||
| 2025-08-14 | 13F | Sunbelt Securities, Inc. | 474 | 0.00 | 24 | 0.00 | ||||
| 2025-08-13 | 13F | Kuhn & Co Investment Counsel | 14,495 | 6.56 | 727 | 6.91 | ||||
| 2025-08-06 | 13F | Golden State Wealth Management, LLC | 15,032 | 5.48 | 754 | 5.90 | ||||
| 2025-08-06 | 13F | Atlas Legacy Advisors, LLC | 5,702 | 37.70 | 286 | 38.16 | ||||
| 2025-07-24 | 13F | Stonebridge Financial Group, LLC | 1,063,477 | 69.37 | 53,355 | 69.87 | ||||
| 2025-08-14 | 13F | Visionary Wealth Advisors | 0 | -100.00 | 0 | |||||
| 2025-07-08 | 13F | Ehrlich Financial Group | 30,681 | -2.58 | 1,539 | -2.29 | ||||
| 2025-08-05 | 13F | Fourth Dimension Wealth, LLC | 132 | 0.00 | 7 | 0.00 | ||||
| 2025-08-14 | 13F | Objective Capital Management, LLC | 0 | -100.00 | 0 | |||||
| 2025-07-14 | 13F | ABLE Financial Group, LLC | 72,452 | 9.99 | 3,635 | 10.29 | ||||
| 2025-08-11 | 13F | Aptus Capital Advisors, LLC | 283 | 0.00 | 14 | 0.00 | ||||
| 2025-08-13 | 13F | SageView Advisory Group, LLC | 10,247 | -7.88 | 515 | -7.55 | ||||
| 2025-08-11 | 13F | CFS Investment Advisory Services, LLC | 60,162 | 3 | ||||||
| 2025-05-20 | 13F | Belpointe Asset Management LLC | 0 | -100.00 | 0 | |||||
| 2025-08-06 | 13F | Hallmark Capital Management Inc | 237 | -12.87 | 12 | -15.38 | ||||
| 2025-07-17 | 13F | Cyr Financial Inc. | 0 | -100.00 | 0 | -100.00 | ||||
| 2025-07-24 | 13F | Williams & Novak, LLC | 0 | -100.00 | 0 | |||||
| 2025-07-16 | 13F | Kooman & Associates | 12,500 | -10.10 | 627 | -9.78 | ||||
| 2025-07-30 | 13F | DecisionMap Wealth Management, LLC | 8,481 | 11.77 | 425 | 12.14 | ||||
| 2025-07-17 | 13F | Summit Financial Strategies, Inc. | 24,324 | 42.05 | 1,220 | 42.52 | ||||
| 2025-08-11 | 13F | HighTower Advisors, LLC | 28,783 | -1.88 | 1,444 | -1.57 | ||||
| 2025-08-05 | 13F | NewSquare Capital LLC | 26,172 | 2.28 | 1,313 | 2.66 | ||||
| 2025-07-07 | 13F | Capital Asset Advisory Services LLC | 96,459 | 29.40 | 4,832 | 29.52 | ||||
| 2025-08-12 | 13F | MAI Capital Management | 90,908 | 7.54 | 4,561 | 7.85 | ||||
| 2025-07-25 | 13F | Cwm, Llc | 540,386 | -23.01 | 27 | -22.86 | ||||
| 2025-07-29 | 13F | Kelman-Lazarov, Inc. | 119,464 | 13.89 | 5,994 | 14.24 | ||||
| 2025-08-13 | 13F | IAG Wealth Partners, LLC | 700 | 0.00 | 35 | 0.00 | ||||
| 2025-08-28 | NP | STMYX - Sierra Tactical Municipal Fund Class Special Shares | 41,300 | 2,072 | ||||||
| 2025-07-11 | 13F | Skyline Advisors, Inc. | 25,376 | -1.16 | 1,273 | -0.86 | ||||
| 2025-08-01 | 13F | Cedar Point Capital Partners, LLC | 62,003 | -7.18 | 3,111 | -6.91 | ||||
| 2025-08-11 | 13F | Private Advisor Group, LLC | 5,948 | 14.32 | 298 | 14.62 | ||||
| 2025-08-19 | 13F | Anchor Investment Management, LLC | 8,000 | 0.00 | 401 | 0.25 | ||||
| 2025-07-23 | 13F | Equitable Trust Co | 5,613 | 1.34 | 282 | 1.44 | ||||
| 2025-07-17 | 13F | Sage Rhino Capital Llc | 13,579 | -19.01 | 681 | -18.74 |