Mga Batayang Estadistika
| Pemilik Institusional | 223 total, 223 long only, 0 short only, 0 long/short - change of 7.69% MRQ |
| Alokasi Portofolio Rata-rata | 0.1353 % - change of 1.65% MRQ |
| Saham Institusional (Jangka Panjang) | 12,836,415 (ex 13D/G) - change of 1.42MM shares 12.44% MRQ |
| Nilai Institusional (Jangka Panjang) | $ 426,409 USD ($1000) |
Kepemilikan Institusional dan Pemegang Saham
Reaves Utility Income Fund (US:UTG) memiliki 223 pemilik institusional dan pemegang saham yang telah mengajukan formulir 13D/G atau 13F kepada Komisi Bursa Efek (Securities Exchange Commission/SEC). Lembaga-lembaga ini memegang total 12,836,415 saham. Pemegang saham terbesar meliputi Bank Of America Corp /de/, Morgan Stanley, Cornerstone Advisors, LLC, Wells Fargo & Company/mn, LPL Financial LLC, Commonwealth Equity Services, Llc, Royal Bank Of Canada, Cornerstone Strategic Value Fund Inc, Ameriprise Financial Inc, and J.w. Cole Advisors, Inc. .
Struktur kepemilikan institusional Reaves Utility Income Fund (NYSEAM:UTG) menunjukkan posisi terkini di perusahaan oleh institusi dan dana, serta perubahan terbaru dalam ukuran posisi. Pemegang saham utama dapat mencakup investor individu, reksa dana, dana lindung nilai, atau institusi. Jadwal 13D menunjukkan bahwa investor memegang (atau pernah memegang) lebih dari 5% saham perusahaan dan bermaksud (atau pernah bermaksud) untuk secara aktif mengejar perubahan strategi bisnis. Jadwal 13G menunjukkan investasi pasif lebih dari 5%.
The share price as of September 5, 2025 is 37.39 / share. Previously, on September 6, 2024, the share price was 30.27 / share. This represents an increase of 23.52% over that period.

Skor Sentimen Dana
Skor Sentimen Dana (sebelumnya dikenal sebagai Skor Akumulasi Kepemilikan) menemukan saham-saham yang paling banyak dibeli oleh dana. Ini adalah hasil dari model kuantitatif multi-faktor yang canggih yang mengidentifikasi perusahaan dengan tingkat akumulasi institusional tertinggi. Model penilaian menggunakan kombinasi dari total peningkatan pemilik yang diungkapkan, perubahan dalam alokasi portofolio pada pemilik tersebut, dan metrik lainnya. Angka berkisar dari 0 hingga 100, dengan angka yang lebih tinggi menunjukkan tingkat akumulasi yang lebih tinggi dibandingkan dengan perusahaan sejenisnya, dan 50 adalah rata-ratanya.
Frekuensi Pembaruan: Setiap Hari
Lihat Ownership Explorer, yang menyediakan daftar perusahaan dengan peringkat tertinggi.
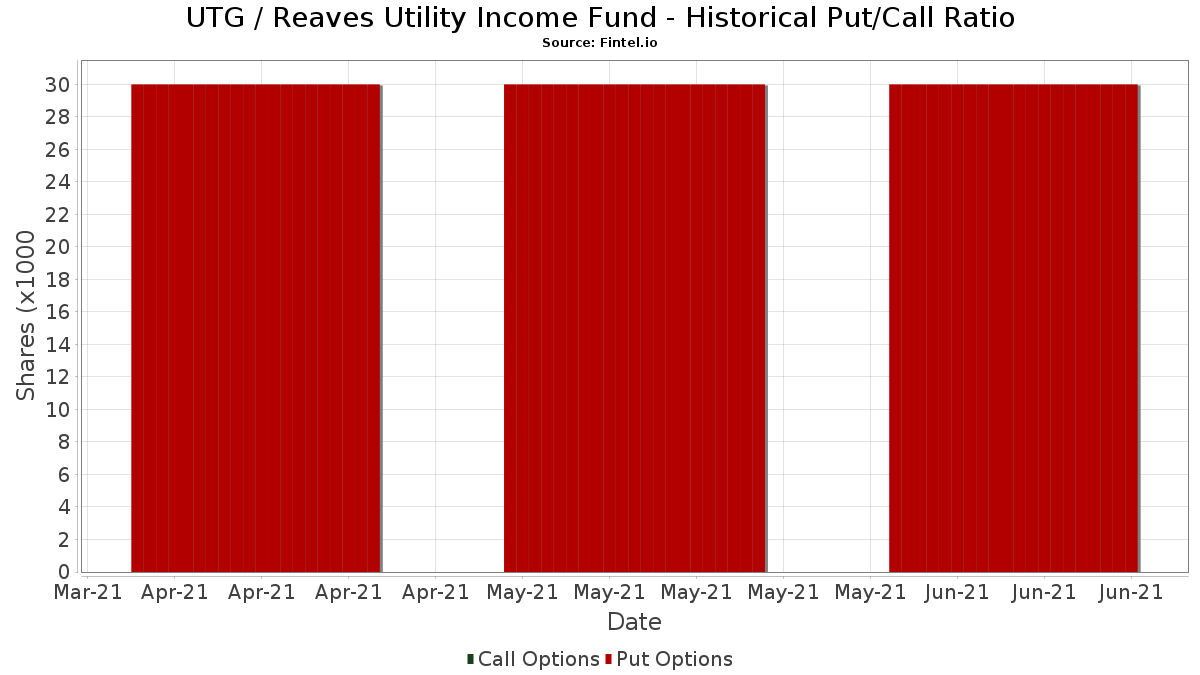
Rasio Put/Call Institusional
Selain melaporkan isu ekuitas dan utang standar, institusi dengan aset di bawah manajemen lebih dari 100 juta dolar AS juga harus mengungkapkan kepemilikan opsi put dan call mereka. Karena opsi put umumnya menunjukkan sentimen negatif, dan opsi call menunjukkan sentimen positif, kita dapat mengetahui sentimen institusional secara keseluruhan dengan memplot rasio put terhadap call. Grafik di sebelah kanan memplot rasio put/call historis untuk instrumen ini.
Menggunakan Rasio Put/Call sebagai indikator sentimen investor mengatasi salah satu kekurangan utama dari penggunaan total kepemilikan institusional, yaitu sejumlah besar aset yang dikelola diinvestasikan secara pasif untuk melacak indeks. Dana yang dikelola secara pasif biasanya tidak membeli opsi, sehingga indikator rasio put/call lebih akurat dalam melacak sentimen dana yang dikelola secara aktif.
Pengajuan 13F dan NPORT
Detail pada pengajuan 13F tersedia gratis. Detail pada pengajuan NP memerlukan keanggotaan premium. Baris berwarna hijau menunjukkan posisi baru. Baris berwarna merah menunjukkan posisi yang sudah ditutup. Klik tautan ini ikon untuk melihat riwayat transaksi selengkapnya.
Tingkatkan
untuk membuka data premium dan mengekspor ke Excel ![]() .
.
| Tanggal File | Sumber | Investor | Ketik | Presyo ng Avg (Silangan) |
Saham | Δ Saham (%) |
Dilaporkan Nilai ($1000) |
Nilai Δ (%) |
Alokasi Port (%) |
|
|---|---|---|---|---|---|---|---|---|---|---|
| 2025-08-12 | 13F | J.w. Cole Advisors, Inc. | 362,956 | 366.21 | 13,132 | 418.40 | ||||
| 2025-08-12 | 13F | LPL Financial LLC | 616,607 | 2.90 | 22,309 | 14.41 | ||||
| 2025-08-12 | 13F | CIBC Private Wealth Group, LLC | 300 | -0.33 | 11 | 25.00 | ||||
| 2025-08-11 | 13F | Elequin Capital Lp | 0 | -100.00 | 0 | |||||
| 2025-07-24 | 13F | Edge Financial Advisors LLC | 8,215 | 298 | ||||||
| 2025-07-29 | 13F | Stephens Inc /ar/ | 26,913 | 5.38 | 974 | 17.09 | ||||
| 2025-04-24 | 13F | Wingate Wealth Advisors, Inc. | 0 | -100.00 | 0 | |||||
| 2025-05-06 | 13F | Proficio Capital Partners LLC | 0 | -100.00 | 0 | -100.00 | ||||
| 2025-08-13 | 13F | Northwestern Mutual Wealth Management Co | 58,209 | 7.56 | 2,106 | 19.53 | ||||
| 2025-05-06 | 13F | Kovack Advisors, Inc. | 0 | -100.00 | 0 | |||||
| 2025-08-14 | 13F | Ameriprise Financial Inc | 382,317 | -22.02 | 13,827 | -12.98 | ||||
| 2025-08-14 | 13F | CoreCap Advisors, LLC | 5,604 | -8.19 | 203 | 2.02 | ||||
| 2025-07-17 | 13F | Sterling Investment Advisors, Ltd. | 192,359 | 3.88 | 6,960 | 15.50 | ||||
| 2025-07-25 | 13F | Atria Wealth Solutions, Inc. | 50,949 | -19.13 | 1,843 | -10.10 | ||||
| 2025-08-13 | 13F | Continuum Advisory, LLC | 0 | -100.00 | 0 | |||||
| 2025-08-06 | 13F | Wedbush Securities Inc | 36,009 | 8.18 | 1 | 0.00 | ||||
| 2025-07-22 | 13F | Belpointe Asset Management LLC | 14,011 | -7.00 | 507 | 3.27 | ||||
| 2025-08-11 | 13F | Western Wealth Management, LLC | 7,095 | 257 | ||||||
| 2025-08-14 | 13F | Federation des caisses Desjardins du Quebec | 358 | 0.00 | 13 | 9.09 | ||||
| 2025-08-14 | 13F | Beaird Harris Wealth Management, LLC | 175 | 0.00 | 6 | 20.00 | ||||
| 2025-08-06 | 13F | Commonwealth Equity Services, Llc | 509,049 | 3.98 | 18 | 20.00 | ||||
| 2025-08-11 | 13F | Private Advisor Group, LLC | 140,633 | 6.95 | 5,088 | 18.93 | ||||
| 2025-07-15 | 13F | Wealth Effects Llc | 69,699 | 0.14 | 2,522 | 11.35 | ||||
| 2025-07-10 | 13F | Oliver Lagore Vanvalin Investment Group | 3,795 | 0.00 | 123 | 2.50 | ||||
| 2025-07-18 | 13F | Consolidated Portfolio Review Corp | 132,011 | -13.26 | 4,776 | -3.55 | ||||
| 2025-08-04 | 13F | Pensionmark Financial Group, Llc | 40,221 | -31.59 | 1,455 | -23.94 | ||||
| 2025-07-11 | 13F/A | Umb Bank N A/mo | 574 | 0.00 | 21 | 11.11 | ||||
| 2025-07-24 | 13F | Costello Asset Management, INC | 10,700 | -1.42 | 387 | 9.63 | ||||
| 2025-08-01 | 13F | Gwn Securities Inc. | 8,638 | 313 | ||||||
| 2025-08-13 | 13F | Allie Family Office LLC | 6,490 | 0.00 | 235 | 10.90 | ||||
| 2025-08-19 | 13F | Advisory Services Network, LLC | 19,185 | 0.15 | 734 | 17.82 | ||||
| 2025-07-11 | 13F | Seacrest Wealth Management, Llc | 7,195 | 10.78 | 260 | 23.22 | ||||
| 2025-08-14 | 13F | Mercer Global Advisors Inc /adv | 14,849 | 26.29 | 537 | 40.58 | ||||
| 2025-07-17 | 13F | Oak Family Advisors, Llc | 249,394 | -6.90 | 9,023 | 3.51 | ||||
| 2025-08-11 | 13F | Semus Wealth Partners LLC | 12,809 | -6.45 | 463 | 4.04 | ||||
| 2025-08-12 | 13F | MAI Capital Management | 5,232 | 0.69 | 189 | 11.83 | ||||
| 2025-07-21 | 13F | Hilltop National Bank | 590 | 0.00 | 21 | 16.67 | ||||
| 2025-08-07 | 13F | McClarren Financial Advisors, Inc. | 0 | -100.00 | 0 | |||||
| 2025-07-24 | 13F | Financial Security Advisor, Inc. | 10,000 | 0.00 | 362 | 11.08 | ||||
| 2025-08-01 | 13F | Centerpoint Advisors, LLC | 1,700 | 0.00 | 0 | |||||
| 2025-08-12 | 13F | Tradition Wealth Management, LLC | 98,261 | 1.40 | 3,555 | 12.75 | ||||
| 2025-07-15 | 13F | Fifth Third Bancorp | 950 | 0.00 | 34 | 13.33 | ||||
| 2025-07-22 | 13F | Kercheville Advisors, LLC | 34,770 | -2.16 | 1,258 | 8.74 | ||||
| 2025-08-13 | 13F | StoneX Group Inc. | 12,464 | -8.39 | 451 | 1.81 | ||||
| 2025-08-11 | 13F | HighTower Advisors, LLC | 17,207 | -5.04 | 623 | 5.60 | ||||
| 2025-08-12 | 13F | Jpmorgan Chase & Co | 228 | -70.47 | 8 | -68.00 | ||||
| 2025-05-19 | 13F | Smith Asset Management Co., LLC | 80,660 | -0.28 | 2,625 | 2.38 | ||||
| 2025-07-07 | 13F | Versant Capital Management, Inc | 234 | 0.00 | 8 | 14.29 | ||||
| 2025-08-14 | 13F | UBS Group AG | 188,829 | 7.57 | 6,832 | 19.59 | ||||
| 2025-08-14 | 13F | Integrated Wealth Concepts LLC | 12,104 | 438 | ||||||
| 2025-08-12 | 13F | Jefferies Financial Group Inc. | 9,014 | 326 | ||||||
| 2025-05-02 | 13F | Cullen/frost Bankers, Inc. | 0 | -100.00 | 0 | |||||
| 2025-06-27 | NP | Calamos ETF Trust - Calamos CEF Income & Arbitrage ETF | 9,808 | -11.53 | 322 | -12.05 | ||||
| 2025-07-24 | 13F | Morton Brown Family Wealth, LLC | 153 | 6 | ||||||
| 2025-07-21 | 13F | Future Financial Wealth Managment LLC | 26,170 | 1.83 | 947 | 13.16 | ||||
| 2025-08-14 | 13F | Stifel Financial Corp | 255,169 | 14.06 | 9,232 | 26.82 | ||||
| 2025-08-04 | 13F | Roble, Belko & Company, Inc | 72 | 1.41 | 0 | |||||
| 2025-08-28 | NP | Cohen & Steers Closed-end Opportunity Fund, Inc. | 20,000 | 30.85 | 724 | 73.80 | ||||
| 2025-07-24 | 13F | Us Bancorp \de\ | 13,284 | -9.90 | 481 | 0.21 | ||||
| 2025-07-30 | 13F | Brookstone Capital Management | 22,606 | 7.27 | 818 | 19.27 | ||||
| 2025-08-04 | 13F | Creative Financial Designs Inc /adv | 5,677 | 3.77 | 205 | 15.17 | ||||
| 2025-08-12 | 13F | AlphaCore Capital LLC | 30,825 | 9.25 | 1,115 | 21.46 | ||||
| 2025-08-15 | 13F | Equitable Holdings, Inc. | 11,711 | 7.18 | 424 | 19.15 | ||||
| 2025-05-12 | 13F | Wolverine Asset Management Llc | 0 | -100.00 | 0 | |||||
| 2025-08-11 | 13F | Brown Brothers Harriman & Co | 4,225 | 0.00 | 153 | 10.95 | ||||
| 2025-07-28 | 13F/A | Penbrook Management LLC | 6,075 | -37.53 | 220 | -30.70 | ||||
| 2025-07-10 | 13F | Focus Financial Network, Inc. | 10,882 | 6.01 | 394 | 17.66 | ||||
| 2025-08-22 | NP | Cornerstone Strategic Value Fund Inc | 482,478 | 74.39 | 17,456 | 93.91 | ||||
| 2025-07-14 | 13F | Armstrong Advisory Group, Inc | 254 | 9 | ||||||
| 2025-08-13 | 13F | Keystone Financial Group | 5,640 | 204 | ||||||
| 2025-08-12 | 13F | Walled Lake Planning & Wealth Management, Llc | 14,045 | 29.21 | 508 | 43.91 | ||||
| 2025-08-14 | 13F | Mml Investors Services, Llc | 17,658 | -16.50 | 1 | |||||
| 2025-07-31 | 13F/A | Avion Wealth | 0 | 0 | ||||||
| 2025-08-13 | 13F | Baird Financial Group, Inc. | 7,586 | 7.91 | 274 | 20.18 | ||||
| 2025-08-13 | 13F | Lido Advisors, LLC | 150,194 | 0.55 | 5,434 | 11.81 | ||||
| 2025-08-08 | 13F | Cetera Investment Advisers | 150,407 | 0.73 | 5,442 | 12.00 | ||||
| 2025-08-14 | 13F | Royal Bank Of Canada | 493,887 | -1.45 | 17,868 | 9.57 | ||||
| 2025-08-07 | 13F | Samalin Investment Counsel, LLC | 19,814 | 1.30 | 717 | 12.58 | ||||
| 2025-08-08 | 13F | Good Life Advisors, LLC | 67,552 | 1.45 | 2,444 | 12.83 | ||||
| 2025-07-25 | 13F | Commonwealth Financial Services, LLC | 5,819 | 211 | ||||||
| 2025-08-07 | 13F | Kestra Private Wealth Services, Llc | 0 | -100.00 | 0 | |||||
| 2025-05-15 | 13F | Family Office Research LLC | 0 | -100.00 | 0 | |||||
| 2025-07-25 | NP | FCEF - First Trust CEF Income Opportunity ETF This fund is a listed as child fund of First Trust Advisors Lp and if that institution has disclosed ownership in this security, then these positions will not be double counted when calculating total shares and total value | 24,510 | 7.99 | 848 | 13.83 | ||||
| 2025-07-16 | 13F | ORG Partners LLC | 7,564 | 5.22 | 275 | 16.10 | ||||
| 2025-07-09 | 13F | Triumph Capital Management | 7,982 | -7.85 | 289 | 2.49 | ||||
| 2025-08-04 | 13F | Assetmark, Inc | 645 | 23 | ||||||
| 2025-08-15 | 13F | Kestra Advisory Services, LLC | 36,177 | 2.84 | 1,309 | 14.34 | ||||
| 2025-08-08 | 13F | Cornerstone Advisors, LLC | 732,485 | 80.17 | 26,501 | 100.33 | ||||
| 2025-08-06 | 13F | Moors & Cabot, Inc. | 0 | -100.00 | 0 | |||||
| 2025-08-15 | 13F | Captrust Financial Advisors | 359,116 | -2.20 | 12,993 | 8.74 | ||||
| 2025-08-07 | 13F | Parkside Financial Bank & Trust | 485 | 0.00 | 18 | 13.33 | ||||
| 2025-04-21 | 13F | Beacon Capital Management, LLC | 0 | -100.00 | 0 | |||||
| 2025-07-25 | 13F | Welch Group, LLC | 22,500 | 18.32 | 814 | 31.93 | ||||
| 2025-08-08 | 13F | IMA Wealth, Inc. | 0 | -100.00 | 0 | |||||
| 2025-08-14 | 13F | Certified Advisory Corp | 15,246 | -11.98 | 552 | -2.13 | ||||
| 2025-09-04 | 13F/A | Advisor Group Holdings, Inc. | 237,084 | 1.35 | 8,579 | 12.71 | ||||
| 2025-08-11 | 13F | Principal Securities, Inc. | 6,751 | 1.86 | 244 | 16.19 | ||||
| 2025-08-15 | 13F | Morgan Stanley | 975,172 | 1.53 | 35,282 | 12.89 | ||||
| 2025-08-05 | 13F | Sigma Planning Corp | 28,890 | 0.71 | 1,045 | 12.00 | ||||
| 2025-05-06 | 13F | Readystate Asset Management Lp | 0 | -100.00 | 0 | -100.00 | ||||
| 2025-08-06 | 13F | AE Wealth Management LLC | 16,802 | -2.26 | 608 | 8.59 | ||||
| 2025-08-08 | 13F | Westbourne Investment Advisors, Inc. | 22,900 | 829 | ||||||
| 2025-08-13 | 13F | Custom Index Systems, Llc | 6,679 | 2.39 | 242 | 13.68 | ||||
| 2025-07-08 | 13F | Ballew Advisors, Inc | 5,664 | 204 | ||||||
| 2025-08-12 | 13F | Landscape Capital Management, L.l.c. | 0 | -100.00 | 0 | |||||
| 2025-07-16 | 13F | Maridea Wealth Management LLC | 15,310 | 1.88 | 554 | 13.09 | ||||
| 2025-08-14 | 13F | Jane Street Group, Llc | 14,039 | 508 | ||||||
| 2025-08-13 | 13F | Alerus Financial Na | 267 | 10 | ||||||
| 2025-08-06 | 13F | Atlantic Union Bankshares Corp | 201 | 7 | ||||||
| 2025-08-12 | 13F | Armor Investment Advisors, LLC | 21,050 | 4.54 | 762 | 16.18 | ||||
| 2025-08-07 | 13F | Allworth Financial LP | 4,289 | 38.89 | 155 | 58.16 | ||||
| 2025-08-13 | 13F | Per Stirling Capital Management, LLC. | 13,254 | 8.37 | 480 | 20.65 | ||||
| 2025-08-13 | 13F | Walleye Capital LLC | 20,496 | 742 | ||||||
| 2025-07-31 | 13F | Leavell Investment Management, Inc. | 0 | -100.00 | 0 | |||||
| 2025-08-13 | 13F | Guggenheim Capital Llc | 178,906 | -18.82 | 6,473 | -9.74 | ||||
| 2025-07-28 | 13F | Mission Hills Financial Advisory, LLC | 12,374 | 448 | ||||||
| 2025-08-05 | 13F | Huntington National Bank | 0 | -100.00 | ||||||
| 2025-08-14 | 13F | Wiley Bros.-aintree Capital, Llc | 11,241 | 407 | ||||||
| 2025-08-11 | 13F | Novak & Powell Financial Services, Inc. | 7,941 | 1.33 | 287 | 12.55 | ||||
| 2025-08-12 | 13F | Proequities, Inc. | 0 | 0 | ||||||
| 2025-07-02 | 13F | HBW Advisory Services LLC | 32,143 | 1.05 | 1,163 | 12.27 | ||||
| 2025-07-14 | 13F | AdvisorNet Financial, Inc | 1,461 | 73.93 | 53 | 92.59 | ||||
| 2025-08-14 | 13F | Colony Group, LLC | 8,335 | -5.01 | 302 | 5.61 | ||||
| 2025-07-25 | 13F | We Are One Seven, LLC | 13,726 | 4.21 | 497 | 15.89 | ||||
| 2025-05-05 | 13F | Transce3nd, LLC | 0 | -100.00 | 0 | |||||
| 2025-08-06 | 13F | Carnegie Lake Advisors LLC | 28,609 | -7.59 | 1 | 0.00 | ||||
| 2025-07-29 | 13F | Tradewinds Capital Management, LLC | 320 | 0.00 | 12 | 10.00 | ||||
| 2025-07-16 | 13F | West Branch Capital LLC | 830 | 1.22 | 30 | 15.38 | ||||
| 2025-08-04 | 13F | ELCO Management Co., LLC | 7,550 | -0.66 | 273 | 10.53 | ||||
| 2025-08-11 | 13F | Hexagon Capital Partners LLC | 0 | -100.00 | 0 | |||||
| 2025-07-14 | 13F | Sowell Financial Services LLC | 57,609 | -0.59 | 2,084 | 10.56 | ||||
| 2025-07-25 | 13F | Cwm, Llc | 22,769 | 2.36 | 1 | |||||
| 2025-08-13 | 13F | Cary Street Partners Financial Llc | 5,808 | 210 | ||||||
| 2025-07-08 | 13F | Nbc Securities, Inc. | 51,173 | -7.98 | 2 | 0.00 | ||||
| 2025-08-12 | 13F | Retirement Planning Co of New England, Inc. | 0 | -100.00 | 0 | -100.00 | ||||
| 2025-08-18 | 13F | Hollencrest Capital Management | 395 | 0.00 | 14 | 16.67 | ||||
| 2025-08-13 | 13F | Summit Financial, LLC | 7,744 | 13.67 | 280 | 26.70 | ||||
| 2025-07-07 | 13F | Investors Research Corp | 7,077 | 0.00 | 256 | 11.30 | ||||
| 2025-07-08 | 13F | Webster Bank, N. A. | 995 | 0.00 | 36 | 9.38 | ||||
| 2025-08-13 | 13F | Leslie Global Wealth, LLC | 9,667 | 0.00 | 350 | 11.15 | ||||
| 2025-08-15 | 13F | Tower Research Capital LLC (TRC) | 0 | -100.00 | 0 | |||||
| 2025-08-12 | 13F | XTX Topco Ltd | 14,844 | 537 | ||||||
| 2025-08-14 | 13F | Vivaldi Capital Management, LLC | 24,350 | 0.00 | 881 | 11.11 | ||||
| 2025-07-02 | 13F | Neville Rodie & Shaw Inc | 12,701 | 0.00 | 0 | |||||
| 2025-08-07 | 13F | Nwam Llc | 7,480 | 20.45 | 285 | 41.09 | ||||
| 2025-07-17 | 13F | Janney Montgomery Scott LLC | 93,563 | 36.82 | 3 | 50.00 | ||||
| 2025-08-08 | 13F | Pnc Financial Services Group, Inc. | 34,599 | 86.71 | 1,252 | 107.81 | ||||
| 2025-08-11 | 13F/A | Purus Wealth Management, LLC | 6,406 | 232 | ||||||
| 2025-08-14 | 13F | Cohen & Steers, Inc. | 20,000 | 1 | ||||||
| 2025-05-12 | 13F | Fmr Llc | 0 | -100.00 | 0 | |||||
| 2025-08-14 | 13F | Wells Fargo & Company/mn | 632,944 | 1.33 | 22,900 | 12.66 | ||||
| 2025-07-22 | 13F | Wealthcare Advisory Partners LLC | 8,694 | 6.00 | 315 | 18.05 | ||||
| 2025-07-29 | 13F | Balboa Wealth Partners | 8,761 | -9.74 | 317 | 0.32 | ||||
| 2025-04-25 | 13F | Albion Financial Group /ut | 0 | -100.00 | 0 | |||||
| 2025-08-14 | 13F | Bank Of America Corp /de/ | 1,043,401 | 11.74 | 37,750 | 24.24 | ||||
| 2025-07-22 | 13F | DAVENPORT & Co LLC | 17,087 | 30.03 | 618 | 44.73 | ||||
| 2025-07-15 | 13F | North Star Investment Management Corp. | 1,450 | 0.00 | 52 | 10.64 | ||||
| 2025-05-15 | 13F | Parvin Asset Management, LLC | 0 | -100.00 | 0 | |||||
| 2025-08-06 | 13F | Savant Capital, LLC | 6,142 | 222 | ||||||
| 2025-08-14 | 13F | Matrix Private Capital Group Llc | 11,550 | -4.94 | 418 | 5.57 | ||||
| 2025-08-07 | 13F | Sound View Wealth Advisors Group, LLC | 14,725 | -5.66 | 533 | 4.93 | ||||
| 2025-08-13 | 13F | EverSource Wealth Advisors, LLC | 2,500 | 0.00 | 90 | 11.11 | ||||
| 2025-08-06 | 13F | Aspect Partners, LLC | 100 | 0.00 | 4 | 0.00 | ||||
| 2025-07-08 | 13F | Dover Advisors, Llc | 9,600 | 9.71 | 347 | 22.18 | ||||
| 2025-08-08 | 13F | Hartland & Co., LLC | 550 | 0.00 | 20 | 11.76 | ||||
| 2025-07-16 | 13F | Signaturefd, Llc | 4,000 | -0.77 | 145 | 9.92 | ||||
| 2025-08-01 | 13F | Boyd Watterson Asset Management Llc/oh | 100 | 0.00 | 4 | 0.00 | ||||
| 2025-07-23 | 13F | Abel Hall, LLC | 10,000 | 362 | ||||||
| 2025-08-14 | 13F | Visionary Wealth Advisors | 11,620 | 47.72 | 420 | 64.71 | ||||
| 2025-07-18 | 13F | SOA Wealth Advisors, LLC. | 613 | 0.00 | 22 | 15.79 | ||||
| 2025-08-04 | 13F | Bay Colony Advisory Group, Inc d/b/a Bay Colony Advisors | 8,803 | 13.78 | 318 | 26.69 | ||||
| 2025-07-29 | 13F | Salomon & Ludwin, LLC | 580 | 0.00 | 21 | 11.11 | ||||
| 2025-05-12 | 13F | Sandy Spring Bank | 201 | 0.00 | 7 | 0.00 | ||||
| 2025-08-04 | 13F | Spire Wealth Management | 4,430 | -6.12 | 160 | 4.58 | ||||
| 2025-05-15 | 13F | Talon Private Wealth, LLC | 0 | -100.00 | 0 | -100.00 | ||||
| 2025-08-12 | 13F | Change Path, LLC | 57,193 | -9.29 | 2,069 | 0.88 | ||||
| 2025-07-31 | 13F | Cambridge Investment Research Advisors, Inc. | 91,696 | 3.85 | 3 | 50.00 | ||||
| 2025-07-16 | 13F | Signature Resources Capital Management, LLC | 250 | 0.00 | 9 | 12.50 | ||||
| 2025-08-13 | 13F | Everstar Asset Management, LLC | 5,650 | 204 | ||||||
| 2025-08-15 | 13F | Resources Management Corp /ct/ /adv | 356 | 0.00 | 0 | |||||
| 2025-08-19 | 13F | Newbridge Financial Services Group, Inc. | 22,283 | 806 | ||||||
| 2025-08-29 | 13F | Centaurus Financial, Inc. | 54,102 | -2.54 | 2 | 0.00 | ||||
| 2025-08-13 | 13F | Colonial Trust Advisors | 1,500 | 0.00 | 54 | 12.50 | ||||
| 2025-08-08 | 13F | Calamos Advisors LLC | 9,808 | -7.99 | 355 | 2.31 | ||||
| 2025-07-21 | 13F | Ameritas Advisory Services, LLC | 2,664 | 96 | ||||||
| 2025-08-18 | 13F | Geneos Wealth Management Inc. | 3,216 | 0.25 | 116 | 11.54 | ||||
| 2025-07-25 | 13F | Orca Investment Management, LLC | 9,775 | 0.00 | 354 | 11.01 | ||||
| 2025-07-15 | 13F | Fortitude Family Office, LLC | 340 | 12 | ||||||
| 2025-08-08 | 13F | Larson Financial Group LLC | 1,442 | 0.00 | 52 | 13.04 | ||||
| 2025-07-31 | 13F | Oppenheimer & Co Inc | 58,928 | 17.60 | 2,132 | 30.80 | ||||
| 2025-08-05 | 13F | Key FInancial Inc | 554 | 0.00 | 20 | 11.11 | ||||
| 2025-04-21 | 13F | Nelson, Van Denburg & Campbell Wealth Management Group, LLC | 0 | -100.00 | 0 | |||||
| 2025-08-11 | 13F | Nations Financial Group Inc, /ia/ /adv | 15,575 | 0.00 | 564 | 11.26 | ||||
| 2025-07-08 | 13F/A | Salem Investment Counselors Inc | 1,246 | 0.00 | 45 | 12.50 | ||||
| 2025-08-12 | 13F | NWF Advisory Services Inc. | 25,240 | 821 | ||||||
| 2025-08-12 | 13F | Steward Partners Investment Advisory, Llc | 32,998 | 6.06 | 1,194 | 17.89 | ||||
| 2025-08-01 | 13F | Logan Capital Management Inc | 1,000 | 0.00 | 36 | 12.50 | ||||
| 2025-08-15 | 13F | CI Private Wealth, LLC | 12,841 | 465 | ||||||
| 2025-09-04 | 13F | Beacon Capital Management, Inc. | 34,500 | 43.75 | 1,248 | 50.72 | ||||
| 2025-08-12 | 13F | Laurel Wealth Advisors LLC | 90,450 | 3,518.00 | 2 | -97.53 | ||||
| 2025-08-19 | 13F | Anchor Investment Management, LLC | 1,622 | 1.69 | 59 | 13.73 | ||||
| 2025-08-08 | 13F | Avantax Advisory Services, Inc. | 16,096 | 2.73 | 582 | 14.34 | ||||
| 2025-08-14 | 13F | Comerica Bank | 19,164 | 1.70 | 693 | 13.05 | ||||
| 2025-05-07 | 13F | Ramirez Asset Management, Inc. | 0 | -100.00 | 0 | |||||
| 2025-05-12 | 13F | Virtu Financial LLC | 0 | -100.00 | 0 | |||||
| 2025-08-13 | 13F | JBR Co Financial Management Inc | 131,812 | -3.16 | 4,769 | 7.65 | ||||
| 2025-08-11 | 13F | Delta Asset Management Llc/tn | 200 | 0.00 | 7 | 16.67 | ||||
| 2025-07-08 | 13F | Atlas Brown,Inc. | 19,579 | -5.87 | 708 | 4.73 | ||||
| 2025-08-12 | 13F | Global Retirement Partners, LLC | 1,692 | 61 | ||||||
| 2025-07-09 | 13F | Sunpointe, LLC | 17,774 | -25.10 | 643 | -16.71 | ||||
| 2025-08-08 | 13F | Islay Capital Management, Llc | 0 | 0 | ||||||
| 2025-07-17 | 13F | XML Financial, LLC | 49,655 | 3.62 | 1,797 | 15.20 | ||||
| 2025-07-29 | 13F | Stratos Wealth Partners, LTD. | 40,375 | 21.78 | 1,461 | 35.44 | ||||
| 2025-04-29 | 13F | Raleigh Capital Management Inc. | 0 | -100.00 | 0 | |||||
| 2025-08-05 | 13F | GPS Wealth Strategies Group, LLC | 1,253 | 0.00 | 45 | 12.50 | ||||
| 2025-08-14 | 13F | Peapack Gladstone Financial Corp | 8,150 | -6.25 | 0 | |||||
| 2025-07-08 | 13F | Lowe Wealth Advisors, LLC | 6,250 | 1.63 | 226 | 13.00 | ||||
| 2025-08-12 | 13F | BlackRock, Inc. | 384 | 0.00 | 14 | 8.33 | ||||
| 2025-07-23 | 13F | Stonegate Investment Group, LLC | 7,171 | 0.11 | 259 | 11.16 | ||||
| 2025-07-24 | 13F | IFP Advisors, Inc | 2,307 | -51.88 | 83 | -46.45 | ||||
| 2025-07-17 | 13F | Oakworth Capital, Inc. | 9,000 | 0.00 | 326 | 11.30 | ||||
| 2025-07-16 | 13F | ORG Wealth Partners, LLC | 591 | 1.72 | 21 | 10.53 | ||||
| 2025-08-11 | 13F | Wealthspire Advisors, LLC | 97,683 | 64.07 | 3,534 | 82.45 | ||||
| 2025-07-29 | 13F | Private Trust Co Na | 1,000 | 0.00 | 36 | 12.50 | ||||
| 2025-07-10 | 13F | Wealth Enhancement Advisory Services, Llc | 54,707 | 16.46 | 1,967 | 28.73 | ||||
| 2025-08-04 | 13F | HBK Sorce Advisory LLC | 13,067 | 11.07 | 473 | 23.56 | ||||
| 2025-07-18 | 13F | PFG Investments, LLC | 14,280 | 4.18 | 517 | 15.70 | ||||
| 2025-08-08 | 13F | Atlanta Consulting Group Advisors, LLC | 24,534 | 0.22 | 888 | 11.43 | ||||
| 2025-07-21 | 13F | DHJJ Financial Advisors, Ltd. | 98 | 0.00 | 4 | 0.00 | ||||
| 2025-07-24 | 13F | Ronald Blue Trust, Inc. | 1,067 | -25.85 | 39 | -17.39 | ||||
| 2025-08-08 | 13F | Creative Planning | 23,109 | 3.42 | 836 | 14.99 | ||||
| 2025-08-04 | 13F | Flagship Harbor Advisors, Llc | 10,875 | 0.00 | 393 | 11.33 | ||||
| 2025-07-28 | 13F | Harbour Investments, Inc. | 5,152 | 0.00 | 186 | 11.38 | ||||
| 2025-08-22 | NP | Cornerstone Total Return Fund Inc | 250,007 | 92.49 | 9,045 | 114.03 | ||||
| 2025-07-11 | 13F | LongView Wealth Management | 69,680 | 0.10 | 2,521 | 11.30 | ||||
| 2025-08-07 | 13F | Montag A & Associates Inc | 0 | -100.00 | 0 | |||||
| 2025-08-14 | 13F | Raymond James Financial Inc | 287,238 | 17.78 | 10,392 | 30.96 | ||||
| 2025-07-21 | 13F | Ameriflex Group, Inc. | 4,874 | -74.07 | 173 | -71.69 | ||||
| 2025-08-14 | 13F | GWM Advisors LLC | 111,791 | 42.31 | 4,045 | 58.22 | ||||
| 2025-07-23 | 13F | Castle Rock Wealth Management, LLC | 14,736 | 549 | ||||||
| 2025-08-07 | 13F | Merrion Investment Management Co, LLC | 25,000 | 0.00 | 904 | 11.19 | ||||
| 2025-07-31 | 13F | Graybill Bartz & Assoc Ltd | 12,081 | 12.47 | 437 | 25.21 | ||||
| 2025-08-04 | 13F | Integrity Alliance, Llc. | 33,623 | 9.32 | 1,216 | 21.60 | ||||
| 2025-08-14 | 13F | Monetary Management Group Inc | 16,400 | 134.29 | 593 | 161.23 | ||||
| 2025-08-13 | 13F | Hollow Brook Wealth Management LLC | 7,606 | -11.90 | 275 | -1.79 | ||||
| 2025-07-09 | 13F | Bank of New Hampshire | 1,560 | 0.00 | 56 | 12.00 | ||||
| 2025-08-06 | 13F | Prospera Financial Services Inc | 19,496 | 10.14 | 705 | 22.40 | ||||
| 2025-07-16 | 13F | Magnus Financial Group LLC | 203,951 | 9.02 | 7,379 | 21.21 | ||||
| 2025-08-04 | 13F | Keybank National Association/oh | 12,700 | 0.00 | 459 | 11.14 | ||||
| 2025-08-14 | 13F | Benjamin Edwards Inc | 8,644 | 2.64 | 313 | 13.87 | ||||
| 2025-08-14 | 13F | Mariner, LLC | 128,952 | 2.46 | 4,665 | 13.92 | ||||
| 2025-08-11 | 13F | Reaves W H & Co Inc | 88,623 | 1.64 | 3,206 | 13.01 | ||||
| 2025-08-13 | 13F | Strategic Family Wealth Counselors, L.L.C. | 28,073 | -0.67 | 1,016 | 10.45 | ||||
| 2025-04-14 | 13F | Bruce G. Allen Investments, LLC | 0 | -100.00 | 0 | -100.00 | ||||
| 2025-08-13 | 13F | First Trust Advisors Lp | 41,144 | -0.45 | 1,489 | 10.71 | ||||
| 2025-05-16 | 13F | Jones Financial Companies Lllp | 0 | -100.00 | 0 | |||||
| 2025-07-25 | 13F | LRI Investments, LLC | 1,440 | 0.00 | 52 | 13.04 | ||||
| 2025-08-01 | 13F | Envestnet Asset Management Inc | 15,474 | 0.51 | 560 | 11.80 |