Mga Batayang Estadistika
| Pemilik Institusional | 89 total, 89 long only, 0 short only, 0 long/short - change of 5.95% MRQ |
| Alokasi Portofolio Rata-rata | 0.5995 % - change of 6.84% MRQ |
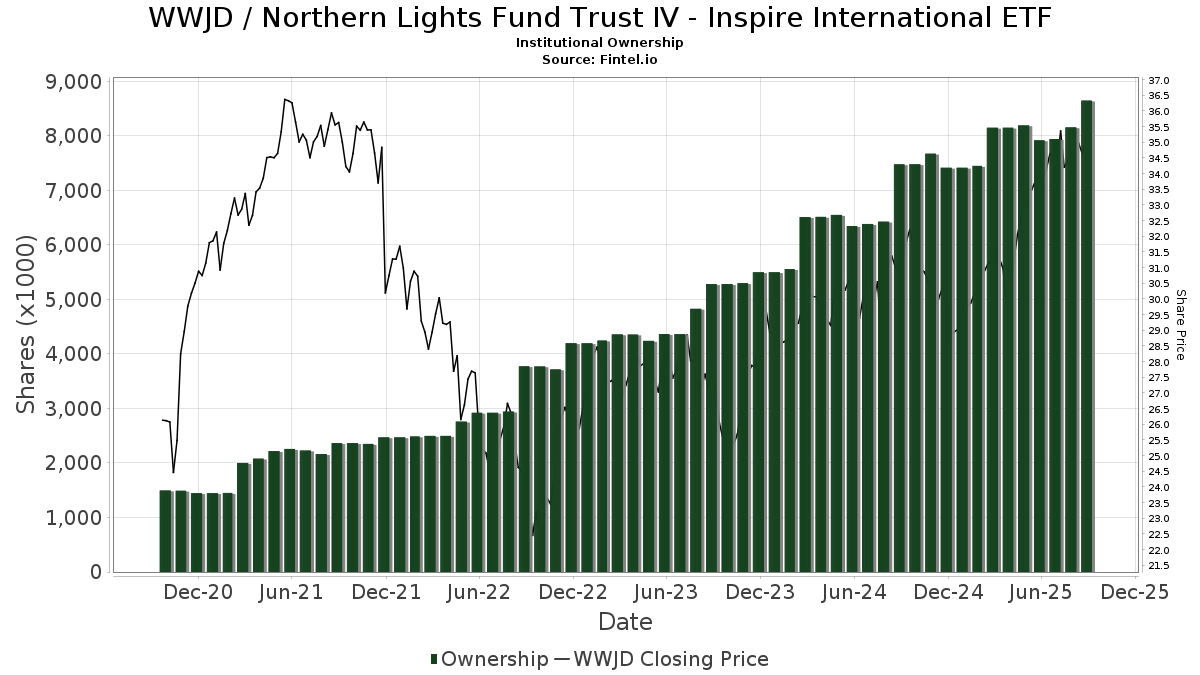
| Saham Institusional (Jangka Panjang) | 8,646,160 (ex 13D/G) - change of 0.71MM shares 8.88% MRQ |
| Nilai Institusional (Jangka Panjang) | $ 285,307 USD ($1000) |
Kepemilikan Institusional dan Pemegang Saham
Northern Lights Fund Trust IV - Inspire International ETF (US:WWJD) memiliki 89 pemilik institusional dan pemegang saham yang telah mengajukan formulir 13D/G atau 13F kepada Komisi Bursa Efek (Securities Exchange Commission/SEC). Lembaga-lembaga ini memegang total 8,646,160 saham. Pemegang saham terbesar meliputi Inspire Advisors, LLC, Ambassador Advisors, LLC, Bare Financial Services, Inc, CWM Advisors, LLC, PAX Financial Group, LLC, Creative Financial Designs Inc /adv, Turning Point Benefit Group, Inc., Fiduciary Alliance LLC, Christian Investment Advisors, Inc., and Legacy Wealth Asset Management, LLC .
Struktur kepemilikan institusional Northern Lights Fund Trust IV - Inspire International ETF (ARCA:WWJD) menunjukkan posisi terkini di perusahaan oleh institusi dan dana, serta perubahan terbaru dalam ukuran posisi. Pemegang saham utama dapat mencakup investor individu, reksa dana, dana lindung nilai, atau institusi. Jadwal 13D menunjukkan bahwa investor memegang (atau pernah memegang) lebih dari 5% saham perusahaan dan bermaksud (atau pernah bermaksud) untuk secara aktif mengejar perubahan strategi bisnis. Jadwal 13G menunjukkan investasi pasif lebih dari 5%.
The share price as of September 5, 2025 is 34.96 / share. Previously, on September 9, 2024, the share price was 30.81 / share. This represents an increase of 13.47% over that period.
Skor Sentimen Dana
Skor Sentimen Dana (sebelumnya dikenal sebagai Skor Akumulasi Kepemilikan) menemukan saham-saham yang paling banyak dibeli oleh dana. Ini adalah hasil dari model kuantitatif multi-faktor yang canggih yang mengidentifikasi perusahaan dengan tingkat akumulasi institusional tertinggi. Model penilaian menggunakan kombinasi dari total peningkatan pemilik yang diungkapkan, perubahan dalam alokasi portofolio pada pemilik tersebut, dan metrik lainnya. Angka berkisar dari 0 hingga 100, dengan angka yang lebih tinggi menunjukkan tingkat akumulasi yang lebih tinggi dibandingkan dengan perusahaan sejenisnya, dan 50 adalah rata-ratanya.
Frekuensi Pembaruan: Setiap Hari
Lihat Ownership Explorer, yang menyediakan daftar perusahaan dengan peringkat tertinggi.
Rasio Put/Call Institusional
Selain melaporkan isu ekuitas dan utang standar, institusi dengan aset di bawah manajemen lebih dari 100 juta dolar AS juga harus mengungkapkan kepemilikan opsi put dan call mereka. Karena opsi put umumnya menunjukkan sentimen negatif, dan opsi call menunjukkan sentimen positif, kita dapat mengetahui sentimen institusional secara keseluruhan dengan memplot rasio put terhadap call. Grafik di sebelah kanan memplot rasio put/call historis untuk instrumen ini.
Menggunakan Rasio Put/Call sebagai indikator sentimen investor mengatasi salah satu kekurangan utama dari penggunaan total kepemilikan institusional, yaitu sejumlah besar aset yang dikelola diinvestasikan secara pasif untuk melacak indeks. Dana yang dikelola secara pasif biasanya tidak membeli opsi, sehingga indikator rasio put/call lebih akurat dalam melacak sentimen dana yang dikelola secara aktif.
Pengajuan 13F dan NPORT
Detail pada pengajuan 13F tersedia gratis. Detail pada pengajuan NP memerlukan keanggotaan premium. Baris berwarna hijau menunjukkan posisi baru. Baris berwarna merah menunjukkan posisi yang sudah ditutup. Klik tautan ini ikon untuk melihat riwayat transaksi selengkapnya.
Tingkatkan
untuk membuka data premium dan mengekspor ke Excel ![]() .
.
| Tanggal File | Sumber | Investor | Ketik | Presyo ng Avg (Silangan) |
Saham | Δ Saham (%) |
Dilaporkan Nilai ($1000) |
Nilai Δ (%) |
Alokasi Port (%) |
|
|---|---|---|---|---|---|---|---|---|---|---|
| 2025-07-31 | 13F | Cambridge Investment Research Advisors, Inc. | 53,589 | 6.17 | 2 | 0.00 | ||||
| 2025-07-30 | 13F | FNY Investment Advisers, LLC | 30 | 0 | ||||||
| 2025-08-13 | 13F | Jones Financial Companies Lllp | 55 | 2 | ||||||
| 2025-08-14 | 13F | Aqr Capital Management Llc | 9,603 | 0.00 | 329 | 11.53 | ||||
| 2025-04-10 | 13F | TrueWealth Advisors, LLC | 0 | -100.00 | 0 | |||||
| 2025-08-14 | 13F | UBS Group AG | 0 | -100.00 | 0 | |||||
| 2025-08-18 | 13F | Geneos Wealth Management Inc. | 1,788 | 0.00 | 61 | 12.96 | ||||
| 2025-08-13 | 13F/A | StoneX Group Inc. | 0 | -100.00 | 0 | -100.00 | ||||
| 2025-08-04 | 13F | Creative Financial Designs Inc /adv | 440,058 | 6,297.12 | 15,081 | 7,046.92 | ||||
| 2025-08-08 | 13F | Cetera Investment Advisers | 22,216 | 3.76 | 761 | 15.65 | ||||
| 2025-08-01 | 13F | Envestnet Asset Management Inc | 36,760 | 1.50 | 1,260 | 13.12 | ||||
| 2025-04-29 | 13F | DT Investment Partners, LLC | 0 | -100.00 | 0 | |||||
| 2025-08-06 | 13F | Sound Financial Strategies Group, LLC | 108,586 | -5.97 | 3,721 | 4.82 | ||||
| 2025-08-29 | 13F | Centaurus Financial, Inc. | 3,149 | 0 | ||||||
| 2025-08-04 | 13F | Pensionmark Financial Group, Llc | 66,134 | 0.15 | 2,266 | 11.63 | ||||
| 2025-05-14 | 13F | Change Path, LLC | 0 | -100.00 | 0 | |||||
| 2025-08-01 | 13F | Rossby Financial, LCC | 4,662 | 1,366.04 | 160 | 1,490.00 | ||||
| 2025-07-18 | 13F | PFG Investments, LLC | 9,203 | -5.93 | 315 | 5.00 | ||||
| 2025-07-25 | 13F | Envestnet Portfolio Solutions, Inc. | 11,551 | -18.85 | 396 | -9.61 | ||||
| 2025-08-05 | 13F | Optivise Advisory Services LLC | 13,707 | -9.17 | 470 | 1.30 | ||||
| 2025-08-05 | 13F | Westside Investment Management, Inc. | 1,958 | 0.00 | 67 | 11.67 | ||||
| 2025-07-31 | 13F | Turning Point Benefit Group, Inc. | 365,836 | -8.07 | 12,537 | 3.58 | ||||
| 2025-07-09 | 13F | HFG Wealth Management, LLC | 11,160 | 15.21 | 343 | 22.50 | ||||
| 2025-07-30 | 13F | Strategic Blueprint, LLC | 15,827 | -24.83 | 542 | -16.23 | ||||
| 2025-08-12 | 13F | LPL Financial LLC | 127,306 | 24.20 | 4,363 | 38.43 | ||||
| 2025-08-13 | 13F | EverSource Wealth Advisors, LLC | 161,430 | -3.35 | 5,532 | 7.73 | ||||
| 2025-08-14 | 13F | Colony Group, LLC | 109,620 | 99.75 | 3,757 | 122.64 | ||||
| 2025-08-14 | 13F | Citadel Advisors Llc | 0 | -100.00 | 0 | |||||
| 2025-04-22 | 13F | Synergy Financial Management, LLC | 0 | -100.00 | 0 | |||||
| 2025-08-13 | 13F | Bare Financial Services, Inc | 485,086 | 2.41 | 16,624 | 14.15 | ||||
| 2025-08-13 | 13F | Northwestern Mutual Wealth Management Co | 60,421 | -25.12 | 2,071 | -16.53 | ||||
| 2025-08-14 | 13F | Fmr Llc | 884 | 6.38 | 30 | 20.00 | ||||
| 2025-07-22 | 13F | Wealthcare Advisory Partners LLC | 8,134 | 0.66 | 279 | 12.10 | ||||
| 2025-08-11 | 13F | Nations Financial Group Inc, /ia/ /adv | 6,128 | 210 | ||||||
| 2025-08-13 | 13F | IAG Wealth Partners, LLC | 224 | 0.00 | 8 | 16.67 | ||||
| 2025-08-04 | 13F | Atria Investments Llc | 56,476 | 10.41 | 1,935 | 23.09 | ||||
| 2025-05-06 | 13F | Venturi Wealth Management, LLC | 0 | -100.00 | 0 | |||||
| 2025-08-06 | 13F | Christian Investment Advisors, Inc. | 264,967 | 9,080 | ||||||
| 2025-07-10 | 13F | Trust Point Inc. | 41,589 | 68.23 | 1,425 | 87.50 | ||||
| 2025-08-08 | 13F | SageOak Financial, LLC | 44,363 | 25.19 | 1,520 | 39.58 | ||||
| 2025-08-14 | 13F | Clarity Asset Management, Inc. | 0 | -100.00 | 0 | |||||
| 2025-08-06 | 13F | Commonwealth Equity Services, Llc | 83,779 | 10.47 | 3 | 0.00 | ||||
| 2025-07-09 | 13F | Fiduciary Alliance LLC | 340,464 | 1.74 | 11,668 | 13.40 | ||||
| 2025-08-13 | 13F | Continuum Advisory, LLC | 0 | -100.00 | 0 | |||||
| 2025-05-14 | 13F | Mml Investors Services, Llc | 0 | -100.00 | 0 | |||||
| 2025-08-14 | 13F | Mercer Global Advisors Inc /adv | 0 | -100.00 | 0 | |||||
| 2025-08-13 | 13F | Flow Traders U.s. Llc | 0 | -100.00 | 0 | |||||
| 2025-08-14 | 13F | Royal Bank Of Canada | 937 | 32 | ||||||
| 2025-07-16 | 13F | Moneywise, Inc. | 25,100 | 16.35 | 860 | 29.71 | ||||
| 2025-08-14 | 13F | Harvest Investment Services, LLC | 10,171 | -22.85 | 349 | -14.07 | ||||
| 2025-07-22 | 13F | Simplicity Wealth,LLC | 22,778 | 36.05 | 781 | 51.75 | ||||
| 2025-08-12 | 13F | Frontier Asset Management, LLC | 91,615 | -6.63 | 3,140 | 4.08 | ||||
| 2025-08-14 | 13F | Schwallier Wealth Management LLC | 15,277 | 9.74 | 524 | 22.20 | ||||
| 2025-08-19 | 13F | Advisory Services Network, LLC | 13,688 | -9.64 | 463 | -0.65 | ||||
| 2025-07-21 | 13F | Ameritas Advisory Services, LLC | 2,519 | 86 | ||||||
| 2025-07-28 | 13F | Harbour Investments, Inc. | 634 | 5.67 | 22 | 16.67 | ||||
| 2025-08-11 | 13F | PAX Financial Group, LLC | 458,915 | -21.17 | 15,727 | -12.12 | ||||
| 2025-08-18 | 13F | N.E.W. Advisory Services LLC | 0 | -100.00 | 0 | |||||
| 2025-08-14 | 13F | Smartleaf Asset Management LLC | 223 | -7.08 | 8 | 0.00 | ||||
| 2025-08-11 | 13F | Principal Securities, Inc. | 3,001 | -16.78 | 103 | -1.92 | ||||
| 2025-08-11 | 13F | Mosaic Family Wealth Partners, Llc | 27,951 | 1.50 | 958 | 13.12 | ||||
| 2025-07-17 | 13F | Sterling Investment Advisors, Ltd. | 15,600 | 38.05 | 535 | 53.89 | ||||
| 2025-08-11 | 13F | United Capital Financial Advisers, Llc | 62,752 | 46.30 | 2,151 | 63.13 | ||||
| 2025-08-14 | 13F | Jane Street Group, Llc | 30,278 | 26.95 | 1,038 | 41.47 | ||||
| 2025-08-12 | 13F | OneAscent Financial Services LLC | 158,185 | 59.51 | 5 | 66.67 | ||||
| 2025-08-12 | 13F | Proequities, Inc. | 0 | 0 | ||||||
| 2025-08-14 | 13F | Raymond James Financial Inc | 55,287 | -2.33 | 1,895 | 8.85 | ||||
| 2025-08-15 | 13F | Morgan Stanley | 527 | 21.43 | 18 | 38.46 | ||||
| 2025-08-13 | 13F | Transce3nd, LLC | 271 | 0.37 | 9 | 12.50 | ||||
| 2025-05-16 | 13F/A | Goldman Sachs Group Inc | 0 | -100.00 | 0 | -100.00 | ||||
| 2025-08-06 | 13F | AE Wealth Management LLC | 26,970 | 43.98 | 924 | 60.70 | ||||
| 2025-08-14 | 13F | Benjamin Edwards Inc | 16,168 | 13.94 | 554 | 27.06 | ||||
| 2025-08-15 | 13F | Kestra Advisory Services, LLC | 55,779 | 27.47 | 1,912 | 42.08 | ||||
| 2025-07-28 | 13F | Sagespring Wealth Partners, Llc | 7,477 | 256 | ||||||
| 2025-07-07 | 13F | Whitaker-Myers Wealth Managers, LTD. | 9,353 | -3.84 | 321 | 7.02 | ||||
| 2025-08-12 | 13F | SRS Capital Advisors, Inc. | 168 | 0.00 | 6 | 0.00 | ||||
| 2025-08-15 | 13F | Keel Point, LLC | 19,238 | -1.01 | 659 | 10.39 | ||||
| 2025-05-02 | 13F | Transcendent Capital Group LLC | 0 | -100.00 | 0 | |||||
| 2025-07-25 | 13F | Atria Wealth Solutions, Inc. | 8,984 | 311 | ||||||
| 2025-08-12 | 13F | Ameritas Investment Partners, Inc. | 4,775 | -0.56 | 164 | 10.88 | ||||
| 2025-07-24 | 13F | CWM Advisors, LLC | 468,358 | -9.63 | 16,051 | 0.73 | ||||
| 2025-08-11 | 13F | Inspire Advisors, LLC | 2,589,116 | -4.52 | 88,729 | 6.43 | ||||
| 2025-07-30 | 13F | Legacy Wealth Asset Management, LLC | 248,865 | 55.02 | 8,529 | 72.81 | ||||
| 2025-08-01 | 13F | Koss-Olinger Consulting, LLC | 16,307 | -19.25 | 559 | -10.14 | ||||
| 2025-08-08 | 13F | Security Financial Services, INC. | 46,955 | -1.78 | 1,609 | 9.53 | ||||
| 2025-08-08 | 13F | Gts Securities Llc | 49,910 | -41.88 | 1,710 | -35.20 | ||||
| 2025-07-08 | 13F | Range Financial Group LLC | 57,789 | 2.58 | 1,980 | 14.38 | ||||
| 2025-07-17 | 13F | LifeGuide Financial Advisors, LLC | 47,282 | 0.42 | 1,620 | 11.96 | ||||
| 2025-08-14 | 13F | TCG Advisory Services, LLC | 9,000 | 0.00 | 308 | 11.59 | ||||
| 2025-08-07 | 13F | Winch Advisory Services, LLC | 292 | 0.34 | 10 | 12.50 | ||||
| 2025-03-10 | 13F | Mattson Financial Services, LLC | 0 | -100.00 | 0 | |||||
| 2025-05-15 | 13F | Vident Advisory, LLC | 0 | -100.00 | 0 | -100.00 | ||||
| 2025-08-11 | 13F | Strategic Equity Management | 29,526 | 15.48 | 1,012 | 28.63 | ||||
| 2025-08-04 | 13F | AlphaStar Capital Management, LLC | 6,944 | -14.23 | 238 | -4.44 | ||||
| 2025-07-10 | 13F | Oliver Lagore Vanvalin Investment Group | 2,075 | -28.82 | 64 | -25.00 | ||||
| 2025-07-25 | 13F | Cwm, Llc | 4,809 | -3.88 | 0 | |||||
| 2025-08-12 | 13F | Bedel Financial Consulting, Inc. | 6,985 | -2.47 | 239 | 2.14 | ||||
| 2025-08-14 | 13F | Ambassador Advisors, LLC | 616,831 | -0.35 | 21,139 | 11.07 | ||||
| 2025-08-12 | 13F | Financial Advocates Investment Management | 13,346 | 28.08 | 457 | 42.81 | ||||
| 2025-04-23 | 13F | Mascagni Wealth Management, Inc. | 0 | -100.00 | 0 | -100.00 | ||||
| 2025-07-14 | 13F | AdvisorNet Financial, Inc | 222 | 8 | ||||||
| 2025-04-22 | 13F | Jfs Wealth Advisors, Llc | 0 | -100.00 | 0 | |||||
| 2025-08-14 | 13F | LaSalle St. Investment Advisors, LLC | 8,745 | -0.22 | 0 | |||||
| 2025-08-14 | 13F | GWM Advisors LLC | 400 | 0.00 | 14 | 8.33 | ||||
| 2025-05-13 | 13F | Steward Partners Investment Advisory, Llc | 0 | -100.00 | 0 | |||||
| 2025-08-14 | 13F | Betterment LLC | 6,252 | 0 | ||||||
| 2025-07-22 | 13F | Belpointe Asset Management LLC | 133,079 | 561.16 | 4,561 | 637.86 | ||||
| 2025-07-24 | 13F | Ronald Blue Trust, Inc. | 250 | 9 | ||||||
| 2025-07-24 | 13F | IFP Advisors, Inc | 19,549 | 42.49 | 670 | 58.91 | ||||
| 2025-07-11 | 13F | SILVER OAK SECURITIES, Inc | 93,686 | 61.14 | 3,211 | 79.03 | ||||
| 2025-09-04 | 13F/A | Advisor Group Holdings, Inc. | 58,223 | 7.23 | 1,998 | 19.65 |