Mga Batayang Estadistika
| Pemilik Institusional | 112 total, 112 long only, 0 short only, 0 long/short - change of -0.88% MRQ |
| Alokasi Portofolio Rata-rata | 0.4110 % - change of -7.79% MRQ |
| Saham Institusional (Jangka Panjang) | 13,033,121 (ex 13D/G) - change of 0.75MM shares 6.09% MRQ |
| Nilai Institusional (Jangka Panjang) | $ 684,227 USD ($1000) |
Kepemilikan Institusional dan Pemegang Saham
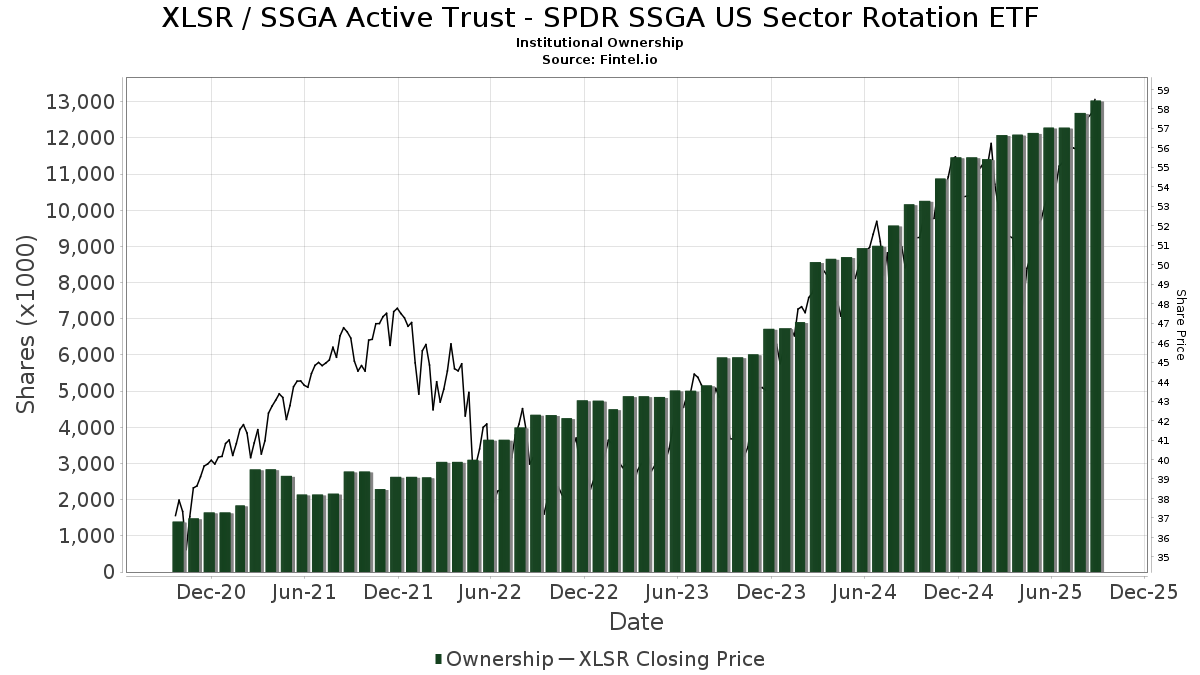
SSGA Active Trust - SPDR SSGA US Sector Rotation ETF (US:XLSR) memiliki 112 pemilik institusional dan pemegang saham yang telah mengajukan formulir 13D/G atau 13F kepada Komisi Bursa Efek (Securities Exchange Commission/SEC). Lembaga-lembaga ini memegang total 13,033,121 saham. Pemegang saham terbesar meliputi LPL Financial LLC, Envestnet Portfolio Solutions, Inc., Envestnet Asset Management Inc, Park Avenue Securities Llc, Hibernia Wealth Partners, LLC, Austin Private Wealth, LLC, GWM Advisors LLC, Landmark Wealth Management, Inc., Mariner, LLC, and Aspire Private Capital, LLC .
Struktur kepemilikan institusional SSGA Active Trust - SPDR SSGA US Sector Rotation ETF (ARCA:XLSR) menunjukkan posisi terkini di perusahaan oleh institusi dan dana, serta perubahan terbaru dalam ukuran posisi. Pemegang saham utama dapat mencakup investor individu, reksa dana, dana lindung nilai, atau institusi. Jadwal 13D menunjukkan bahwa investor memegang (atau pernah memegang) lebih dari 5% saham perusahaan dan bermaksud (atau pernah bermaksud) untuk secara aktif mengejar perubahan strategi bisnis. Jadwal 13G menunjukkan investasi pasif lebih dari 5%.
The share price as of September 5, 2025 is 58.20 / share. Previously, on September 6, 2024, the share price was 48.78 / share. This represents an increase of 19.31% over that period.
Skor Sentimen Dana
Skor Sentimen Dana (sebelumnya dikenal sebagai Skor Akumulasi Kepemilikan) menemukan saham-saham yang paling banyak dibeli oleh dana. Ini adalah hasil dari model kuantitatif multi-faktor yang canggih yang mengidentifikasi perusahaan dengan tingkat akumulasi institusional tertinggi. Model penilaian menggunakan kombinasi dari total peningkatan pemilik yang diungkapkan, perubahan dalam alokasi portofolio pada pemilik tersebut, dan metrik lainnya. Angka berkisar dari 0 hingga 100, dengan angka yang lebih tinggi menunjukkan tingkat akumulasi yang lebih tinggi dibandingkan dengan perusahaan sejenisnya, dan 50 adalah rata-ratanya.
Frekuensi Pembaruan: Setiap Hari
Lihat Ownership Explorer, yang menyediakan daftar perusahaan dengan peringkat tertinggi.
Rasio Put/Call Institusional
Selain melaporkan isu ekuitas dan utang standar, institusi dengan aset di bawah manajemen lebih dari 100 juta dolar AS juga harus mengungkapkan kepemilikan opsi put dan call mereka. Karena opsi put umumnya menunjukkan sentimen negatif, dan opsi call menunjukkan sentimen positif, kita dapat mengetahui sentimen institusional secara keseluruhan dengan memplot rasio put terhadap call. Grafik di sebelah kanan memplot rasio put/call historis untuk instrumen ini.
Menggunakan Rasio Put/Call sebagai indikator sentimen investor mengatasi salah satu kekurangan utama dari penggunaan total kepemilikan institusional, yaitu sejumlah besar aset yang dikelola diinvestasikan secara pasif untuk melacak indeks. Dana yang dikelola secara pasif biasanya tidak membeli opsi, sehingga indikator rasio put/call lebih akurat dalam melacak sentimen dana yang dikelola secara aktif.
Pengajuan 13F dan NPORT
Detail pada pengajuan 13F tersedia gratis. Detail pada pengajuan NP memerlukan keanggotaan premium. Baris berwarna hijau menunjukkan posisi baru. Baris berwarna merah menunjukkan posisi yang sudah ditutup. Klik tautan ini ikon untuk melihat riwayat transaksi selengkapnya.
Tingkatkan
untuk membuka data premium dan mengekspor ke Excel ![]() .
.
| Tanggal File | Sumber | Investor | Ketik | Presyo ng Avg (Silangan) |
Saham | Δ Saham (%) |
Dilaporkan Nilai ($1000) |
Nilai Δ (%) |
Alokasi Port (%) |
|
|---|---|---|---|---|---|---|---|---|---|---|
| 2025-07-01 | 13F | Private Client Services, Llc | 5,790 | -15.15 | 318 | -8.38 | ||||
| 2025-07-25 | 13F | Envestnet Portfolio Solutions, Inc. | 1,907,224 | 9.11 | 104,745 | 18.03 | ||||
| 2025-05-01 | 13F | Quest 10 Wealth Builders, Inc. | 373 | 5.07 | 19 | 0.00 | ||||
| 2025-07-17 | 13F | Raleigh Capital Management Inc. | 130,338 | 2.35 | 7,158 | 10.72 | ||||
| 2025-08-14 | 13F | Smartleaf Asset Management LLC | 5,371 | 18.93 | 294 | 28.51 | ||||
| 2025-08-06 | 13F | AE Wealth Management LLC | 117,311 | 10.72 | 6,443 | 19.76 | ||||
| 2025-07-24 | 13F | M1 Capital Management LLC | 5,081 | -10.20 | 279 | -2.79 | ||||
| 2025-08-12 | 13F | Richard W. Paul & Associates, LLC | 12,002 | -5.77 | 659 | 2.01 | ||||
| 2025-08-14 | 13F | Mpwm Advisory Solutions, Llc | 3 | 0.00 | 0 | |||||
| 2025-08-13 | 13F | VestGen Advisors, LLC | 15,382 | 40.80 | 858 | 54.69 | ||||
| 2025-08-01 | 13F | Austin Private Wealth, LLC | 304,084 | 70.58 | 16,700 | 84.53 | ||||
| 2025-07-07 | 13F | Capital Asset Advisory Services LLC | 12,340 | -14.37 | 678 | -8.51 | ||||
| 2025-07-24 | 13F | Lokken Investment Group LLC | 17,612 | -2.57 | 967 | 5.45 | ||||
| 2025-08-11 | 13F | Annis Gardner Whiting Capital Advisors, LLC | 517 | 0.00 | 28 | 7.69 | ||||
| 2025-07-22 | 13F | Merit Financial Group, LLC | 26,619 | 1,462 | ||||||
| 2025-08-12 | 13F | Proequities, Inc. | 0 | 0 | ||||||
| 2025-08-14 | 13F | CoreCap Advisors, LLC | 621 | 130.00 | 34 | 161.54 | ||||
| 2025-08-12 | 13F | Gladstone Institutional Advisory LLC | 14,260 | -6.64 | 783 | 1.03 | ||||
| 2025-08-12 | 13F | Absolute Capital Management, LLC | 11,275 | 6.77 | 619 | 15.49 | ||||
| 2025-08-12 | 13F | SRS Capital Advisors, Inc. | 258 | 0.00 | 14 | 7.69 | ||||
| 2025-08-14 | 13F | Novus Advisors, Llc | 56,974 | -1.21 | 3,129 | 6.83 | ||||
| 2025-07-29 | 13F | Private Trust Co Na | 1,573 | 57.46 | 86 | 72.00 | ||||
| 2025-08-12 | 13F | LPL Financial LLC | 4,590,149 | 5.93 | 252,091 | 14.59 | ||||
| 2025-08-11 | 13F | Private Advisor Group, LLC | 77,458 | 17.67 | 4,254 | 27.29 | ||||
| 2025-08-04 | 13F | Atria Investments Llc | 7,776 | -18.43 | 427 | -11.59 | ||||
| 2025-08-13 | 13F | GeoWealth Management, LLC | 58,729 | -0.22 | 3,225 | 7.93 | ||||
| 2025-07-29 | 13F | Stratos Wealth Partners, LTD. | 14,487 | 796 | ||||||
| 2025-08-12 | 13F | Maripau Wealth Management Llc | 3,846 | -4.09 | 211 | 3.94 | ||||
| 2025-05-12 | 13F | Aveo Capital Partners, LLC | 0 | -100.00 | 0 | -100.00 | ||||
| 2025-07-31 | 13F | Cambridge Investment Research Advisors, Inc. | 33,869 | -0.23 | 2 | 0.00 | ||||
| 2025-08-14 | 13F | Susquehanna International Group, Llp | 0 | -100.00 | 0 | |||||
| 2025-07-15 | 13F | Spectrum Planning & Advisory Services Inc. | 15,938 | 2.23 | 875 | 10.62 | ||||
| 2025-08-15 | 13F | Kestra Advisory Services, LLC | 27,677 | 0.57 | 1,520 | 8.80 | ||||
| 2025-08-12 | 13F | Argent Trust Co | 13,597 | -0.13 | 747 | 7.96 | ||||
| 2025-08-04 | 13F | Hantz Financial Services, Inc. | 159 | -50.00 | 0 | |||||
| 2025-08-11 | 13F | October Effect Ltd | 18,066 | 992 | ||||||
| 2025-08-12 | 13F | Virtu Financial LLC | 0 | -100.00 | 0 | |||||
| 2025-08-14 | 13F | GWM Advisors LLC | 285,889 | 2.55 | 15,701 | 10.94 | ||||
| 2025-07-14 | 13F | Capital CS Group, LLC | 9,359 | -7.02 | 514 | 0.59 | ||||
| 2025-08-06 | 13F | Mascagni Wealth Management, Inc. | 0 | -100.00 | 0 | |||||
| 2025-08-11 | 13F | Outlook Wealth Advisors, LLC | 39,102 | -1.47 | 2,147 | 6.60 | ||||
| 2025-08-13 | 13F | Townsquare Capital Llc | 0 | -100.00 | 0 | |||||
| 2025-08-14 | 13F | UBS Group AG | 0 | -100.00 | 0 | |||||
| 2025-07-16 | 13F | Castleview Partners, Llc | 5,887 | 1.40 | 323 | 9.86 | ||||
| 2025-08-05 | 13F | Landmark Wealth Management, Inc. | 264,502 | 4.28 | 14,526 | 12.81 | ||||
| 2025-07-11 | 13F | International Private Wealth Advisors LLC | 58,091 | 4.86 | 3,190 | 13.44 | ||||
| 2025-08-15 | 13F | First Heartland Consultants, Inc. | 6,865 | 377 | ||||||
| 2025-07-10 | 13F | Sharkey, Howes & Javer | 166,085 | 3.15 | 9,121 | 11.59 | ||||
| 2025-07-25 | 13F | Atria Wealth Solutions, Inc. | 0 | -100.00 | 0 | |||||
| 2025-07-25 | 13F | Richardson Financial Services Inc. | 2,109 | 0.00 | 116 | 7.48 | ||||
| 2025-08-14 | 13F | Fort Point Capital Partners LLC | 6,657 | 0.03 | 366 | 8.31 | ||||
| 2025-08-07 | 13F | Nwam Llc | 5,408 | 0.00 | 303 | 10.22 | ||||
| 2025-07-17 | 13F | Worth Financial Advisory Group, LLC | 35,133 | -0.00 | 1,930 | 8.19 | ||||
| 2025-08-11 | 13F | Covestor Ltd | 557 | 204.37 | 0 | |||||
| 2025-08-01 | 13F | FSA Advisors, Inc. | 7,511 | 0.48 | 412 | 8.71 | ||||
| 2025-08-08 | 13F | Foundations Investment Advisors, LLC | 209,026 | 10.25 | 11,480 | 19.25 | ||||
| 2025-07-18 | 13F | Truist Financial Corp | 6,986 | 7.96 | 384 | 16.77 | ||||
| 2025-07-29 | 13F | Balboa Wealth Partners | 29,710 | -2.62 | 1,632 | 5.36 | ||||
| 2025-07-17 | 13F | Kelly Financial Services LLC | 10,936 | -4.74 | 601 | 3.09 | ||||
| 2025-09-04 | 13F/A | Advisor Group Holdings, Inc. | 4,527 | -15.26 | 249 | -8.49 | ||||
| 2025-07-10 | 13F | Global Financial Private Client, LLC | 55,312 | 8.29 | 3,038 | 17.12 | ||||
| 2025-08-06 | 13F | Commonwealth Equity Services, Llc | 65,667 | -0.94 | 4 | 0.00 | ||||
| 2025-07-28 | 13F | Axxcess Wealth Management, Llc | 95,282 | -5.35 | 5,233 | 2.39 | ||||
| 2025-07-14 | 13F | Iams Wealth Management, Llc | 30,058 | 3.42 | 1,651 | 11.86 | ||||
| 2025-08-01 | 13F | Envestnet Asset Management Inc | 1,639,645 | 12.16 | 90,049 | 21.33 | ||||
| 2025-07-11 | 13F | SILVER OAK SECURITIES, Inc | 12,126 | 0.36 | 666 | 9.02 | ||||
| 2025-07-14 | 13F | AdvisorNet Financial, Inc | 199 | 11 | ||||||
| 2025-08-08 | 13F | Kingsview Wealth Management, LLC | 4,635 | -55.80 | 255 | -52.26 | ||||
| 2025-07-18 | 13F | Lockerman Financial Group, Inc. | 37,096 | 6.63 | 2,037 | 15.35 | ||||
| 2025-08-13 | 13F | Transce3nd, LLC | 3,786 | 8.67 | 208 | 17.61 | ||||
| 2025-07-21 | 13F | Future Financial Wealth Managment LLC | 181 | 0.00 | 10 | 0.00 | ||||
| 2025-07-24 | 13F | Forefront Analytics, LLC | 23,586 | 1,295 | ||||||
| 2025-07-15 | 13F | FLP Wealth Management, LLC | 0 | -100.00 | 0 | |||||
| 2025-07-08 | 13F | Apella Capital, LLC | 28,268 | 0.08 | 1,555 | 12.03 | ||||
| 2025-08-12 | 13F | Jpmorgan Chase & Co | 0 | -100.00 | 0 | |||||
| 2025-08-14 | 13F | Mml Investors Services, Llc | 30,863 | 2 | ||||||
| 2025-07-23 | 13F | True Vision MN LLC | 7,559 | -0.05 | 415 | 8.36 | ||||
| 2025-08-07 | 13F | Allworth Financial LP | 4,061 | -38.26 | 223 | -30.96 | ||||
| 2025-08-11 | 13F | HighTower Advisors, LLC | 106,620 | 18.15 | 5,856 | 27.81 | ||||
| 2025-08-29 | 13F | Evolution Wealth Management Inc. | 3,872 | 213 | ||||||
| 2025-08-11 | 13F | Principal Securities, Inc. | 13,450 | 3.80 | 739 | 6.65 | ||||
| 2025-08-14 | 13F | Wells Fargo & Company/mn | 1,090 | 14.02 | 60 | 22.92 | ||||
| 2025-07-14 | 13F | Park Avenue Securities Llc | 443,412 | 2.90 | 24 | 14.29 | ||||
| 2025-08-14 | 13F | Royal Bank Of Canada | 12,008 | -43.90 | 660 | -39.28 | ||||
| 2025-08-04 | 13F | MeadowBrook Investment Advisors LLC | 2,509 | 0.00 | 138 | 7.87 | ||||
| 2025-08-12 | 13F | Global Retirement Partners, LLC | 486 | 2.75 | 27 | 4.00 | ||||
| 2025-07-21 | 13F | J2 Capital Management Inc | 4,223 | -0.42 | 232 | 7.44 | ||||
| 2025-04-17 | 13F | Authentikos Wealth Advisory, LLC | 0 | -100.00 | 0 | |||||
| 2025-07-29 | 13F | Kraft, Davis & Associates, LLC | 5,945 | 17.58 | 334 | 39.33 | ||||
| 2025-08-08 | 13F | TD Capital Management LLC | 1,365 | 0.00 | 75 | 7.25 | ||||
| 2025-07-10 | 13F | Signal Advisors Wealth, LLC | 188,472 | 9.55 | 10,351 | 18.50 | ||||
| 2025-07-28 | 13F | Harbour Investments, Inc. | 172,402 | -0.15 | 9,468 | 8.02 | ||||
| 2025-08-13 | 13F | Maia Wealth LLC | 5,719 | -0.44 | 314 | 13.36 | ||||
| 2025-08-08 | 13F | Creative Planning | 6,840 | 0.00 | 376 | 8.07 | ||||
| 2025-08-08 | 13F | Hibernia Wealth Partners, LLC | 420,646 | 98.89 | 23,102 | 115.15 | ||||
| 2025-08-14 | 13F/A | Skopos Labs, Inc. | 159 | 0.00 | 9 | 0.00 | ||||
| 2025-08-14 | 13F | Jane Street Group, Llc | 0 | -100.00 | 0 | |||||
| 2025-08-14 | 13F | Raymond James Financial Inc | 5,189 | 285 | ||||||
| 2025-07-09 | 13F | VisionPoint Advisory Group, LLC | 5,448 | -1.27 | 299 | 6.79 | ||||
| 2025-08-14 | 13F | Great Valley Advisor Group, Inc. | 0 | -100.00 | 0 | |||||
| 2025-07-09 | 13F | Triumph Capital Management | 11,192 | 0.22 | 615 | 8.48 | ||||
| 2025-08-04 | 13F | Family Wealth Group, LLC | 11,962 | -3.44 | 657 | 4.46 | ||||
| 2025-08-08 | 13F | Cetera Investment Advisers | 137,575 | 21.54 | 7,556 | 31.48 | ||||
| 2025-07-22 | 13F | Aspire Private Capital, LLC | 223,750 | -3.09 | 12,288 | 4.84 | ||||
| 2025-07-15 | 13F | Armis Advisers, LLC | 12,948 | -14.52 | 711 | -7.54 | ||||
| 2025-05-15 | 13F | Citadel Advisors Llc | 0 | -100.00 | 0 | |||||
| 2025-08-14 | 13F | Mariner, LLC | 237,979 | 9.65 | 13,070 | 18.61 | ||||
| 2025-07-23 | 13F | REAP Financial Group, LLC | 468 | 0.00 | 26 | 8.70 | ||||
| 2025-08-08 | 13F | Croban | 23,586 | 4.85 | 1,295 | 13.40 | ||||
| 2025-08-12 | 13F | Change Path, LLC | 104,843 | 5.94 | 5,758 | 14.59 | ||||
| 2025-08-14 | 13F | Stifel Financial Corp | 10,932 | 5.31 | 600 | 13.85 | ||||
| 2025-08-01 | 13F | Rossby Financial, LCC | 25 | 0.00 | 1 | 0.00 | ||||
| 2025-08-14 | 13F | Synovus Financial Corp | 6,681 | 0.00 | 367 | 7.96 | ||||
| 2025-05-15 | 13F | Talon Private Wealth, LLC | 0 | -100.00 | 0 | -100.00 | ||||
| 2025-08-11 | 13F | Aptus Capital Advisors, LLC | 1,150 | 63 | ||||||
| 2025-08-14 | 13F | Hilltop Holdings Inc. | 23,365 | 0.15 | 1,283 | 8.36 | ||||
| 2025-08-13 | 13F | Northwestern Mutual Wealth Management Co | 1,669 | 34.16 | 92 | 44.44 | ||||
| 2025-08-14 | 13F | Two Sigma Investments, Lp | 48,200 | 2,647 | ||||||
| 2025-08-04 | 13F | Creative Financial Designs Inc /adv | 2,545 | 65.26 | 140 | 78.21 | ||||
| 2025-07-25 | 13F | NorthRock Partners, LLC | 6,864 | -67.77 | 377 | -65.22 | ||||
| 2025-08-15 | 13F | Morgan Stanley | 48,092 | -5.42 | 2,641 | 2.32 | ||||
| 2025-07-11 | 13F | Farther Finance Advisors, LLC | 1,752 | 23.03 | 96 | 33.33 | ||||
| 2025-08-25 | 13F | Silverlake Wealth Management Llc | 6,834 | -24.18 | 375 | -17.94 | ||||
| 2025-05-02 | 13F | Capital A Wealth Management, LLC | 15 | -59.46 | 1 | -100.00 | ||||
| 2025-08-14 | 13F | Atomi Financial Group, Inc. | 6,842 | -0.16 | 376 | 8.07 | ||||
| 2025-07-21 | 13F | Patriot Financial Group Insurance Agency, LLC | 3,862 | 212 | ||||||
| 2025-07-28 | 13F | Frazier Financial Advisors, LLC | 712 | 0.14 | 39 | 8.33 |