Mga Batayang Estadistika
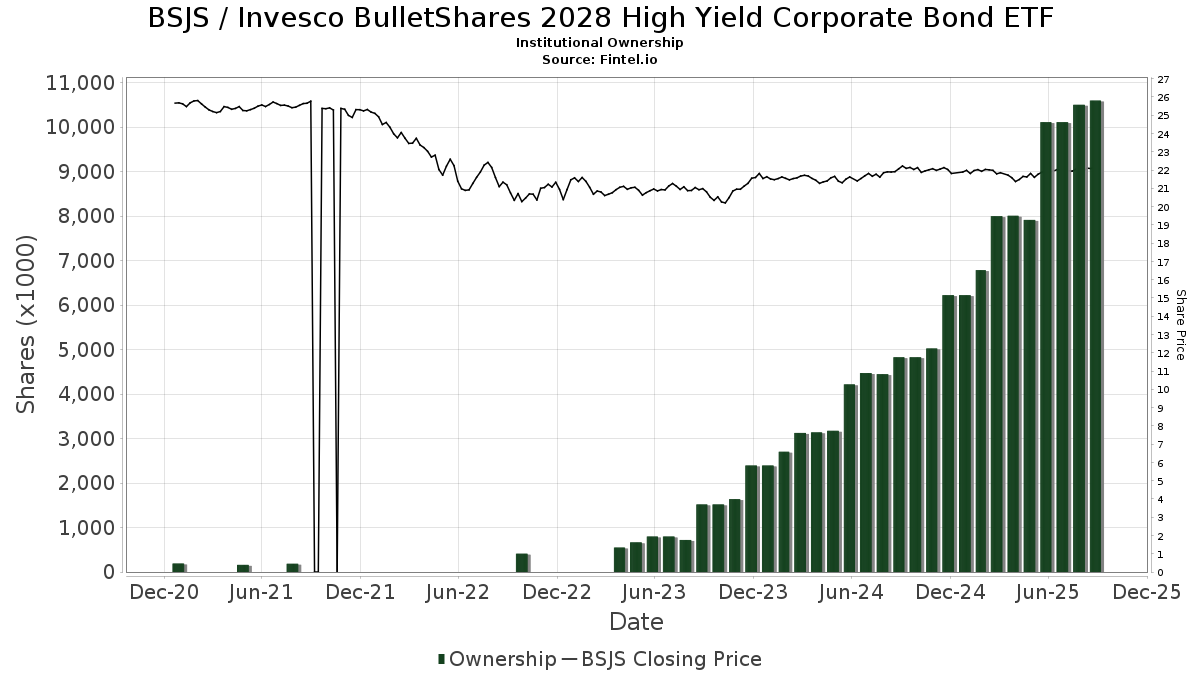
| Pemilik Institusional | 116 total, 116 long only, 0 short only, 0 long/short - change of 10.48% MRQ |
| Alokasi Portofolio Rata-rata | 0.1732 % - change of -16.84% MRQ |
| Saham Institusional (Jangka Panjang) | 10,575,822 (ex 13D/G) - change of 0.47MM shares 4.61% MRQ |
| Nilai Institusional (Jangka Panjang) | $ 221,372 USD ($1000) |
Kepemilikan Institusional dan Pemegang Saham
Invesco BulletShares 2028 High Yield Corporate Bond ETF (US:BSJS) memiliki 116 pemilik institusional dan pemegang saham yang telah mengajukan formulir 13D/G atau 13F kepada Komisi Bursa Efek (Securities Exchange Commission/SEC). Lembaga-lembaga ini memegang total 10,575,822 saham. Pemegang saham terbesar meliputi LPL Financial LLC, Wells Fargo & Company/mn, Morgan Stanley, Envestnet Asset Management Inc, Cetera Investment Advisers, UBS Group AG, SFE Investment Counsel, Equitable Holdings, Inc., Mercer Global Advisors Inc /adv, and Steward Partners Investment Advisory, Llc .
Struktur kepemilikan institusional Invesco BulletShares 2028 High Yield Corporate Bond ETF (NasdaqGM:BSJS) menunjukkan posisi terkini di perusahaan oleh institusi dan dana, serta perubahan terbaru dalam ukuran posisi. Pemegang saham utama dapat mencakup investor individu, reksa dana, dana lindung nilai, atau institusi. Jadwal 13D menunjukkan bahwa investor memegang (atau pernah memegang) lebih dari 5% saham perusahaan dan bermaksud (atau pernah bermaksud) untuk secara aktif mengejar perubahan strategi bisnis. Jadwal 13G menunjukkan investasi pasif lebih dari 5%.
The share price as of September 5, 2025 is 22.17 / share. Previously, on September 6, 2024, the share price was 21.98 / share. This represents an increase of 0.86% over that period.
Skor Sentimen Dana
Skor Sentimen Dana (sebelumnya dikenal sebagai Skor Akumulasi Kepemilikan) menemukan saham-saham yang paling banyak dibeli oleh dana. Ini adalah hasil dari model kuantitatif multi-faktor yang canggih yang mengidentifikasi perusahaan dengan tingkat akumulasi institusional tertinggi. Model penilaian menggunakan kombinasi dari total peningkatan pemilik yang diungkapkan, perubahan dalam alokasi portofolio pada pemilik tersebut, dan metrik lainnya. Angka berkisar dari 0 hingga 100, dengan angka yang lebih tinggi menunjukkan tingkat akumulasi yang lebih tinggi dibandingkan dengan perusahaan sejenisnya, dan 50 adalah rata-ratanya.
Frekuensi Pembaruan: Setiap Hari
Lihat Ownership Explorer, yang menyediakan daftar perusahaan dengan peringkat tertinggi.
Rasio Put/Call Institusional
Selain melaporkan isu ekuitas dan utang standar, institusi dengan aset di bawah manajemen lebih dari 100 juta dolar AS juga harus mengungkapkan kepemilikan opsi put dan call mereka. Karena opsi put umumnya menunjukkan sentimen negatif, dan opsi call menunjukkan sentimen positif, kita dapat mengetahui sentimen institusional secara keseluruhan dengan memplot rasio put terhadap call. Grafik di sebelah kanan memplot rasio put/call historis untuk instrumen ini.
Menggunakan Rasio Put/Call sebagai indikator sentimen investor mengatasi salah satu kekurangan utama dari penggunaan total kepemilikan institusional, yaitu sejumlah besar aset yang dikelola diinvestasikan secara pasif untuk melacak indeks. Dana yang dikelola secara pasif biasanya tidak membeli opsi, sehingga indikator rasio put/call lebih akurat dalam melacak sentimen dana yang dikelola secara aktif.
Pengajuan 13F dan NPORT
Detail pada pengajuan 13F tersedia gratis. Detail pada pengajuan NP memerlukan keanggotaan premium. Baris berwarna hijau menunjukkan posisi baru. Baris berwarna merah menunjukkan posisi yang sudah ditutup. Klik tautan ini ikon untuk melihat riwayat transaksi selengkapnya.
Tingkatkan
untuk membuka data premium dan mengekspor ke Excel ![]() .
.
| Tanggal File | Sumber | Investor | Ketik | Presyo ng Avg (Silangan) |
Saham | Δ Saham (%) |
Dilaporkan Nilai ($1000) |
Nilai Δ (%) |
Alokasi Port (%) |
|
|---|---|---|---|---|---|---|---|---|---|---|
| 2025-08-01 | 13F | Envestnet Asset Management Inc | 485,597 | 4.84 | 10,707 | 6.82 | ||||
| 2025-04-17 | 13F | Rebalance, Llc | 0 | -100.00 | 0 | |||||
| 2025-08-05 | 13F | Pacific Wealth Strategies Group, Inc. | 31,328 | 172.42 | 687 | 177.02 | ||||
| 2025-04-21 | 13F | Nelson, Van Denburg & Campbell Wealth Management Group, LLC | 0 | -100.00 | 0 | |||||
| 2025-08-12 | 13F | Proequities, Inc. | 0 | 0 | ||||||
| 2025-07-29 | 13F | Tradewinds Capital Management, LLC | 1,215 | 1.76 | 27 | 4.00 | ||||
| 2025-07-28 | 13F | Harbour Investments, Inc. | 48,227 | 2.12 | 1,063 | 4.11 | ||||
| 2025-07-22 | 13F | Net Worth Advisory Group | 17,403 | 21.52 | 384 | 23.95 | ||||
| 2025-07-24 | 13F | IFP Advisors, Inc | 0 | -100.00 | 0 | |||||
| 2025-08-14 | 13F | Arete Wealth Advisors, LLC | 13,923 | 0.00 | 0 | |||||
| 2025-04-22 | 13F | Tassel Capital Management, Inc. | 0 | -100.00 | 0 | |||||
| 2025-08-13 | 13F | VestGen Advisors, LLC | 20,337 | 35.48 | 448 | 37.96 | ||||
| 2025-07-25 | 13F | We Are One Seven, LLC | 9,228 | 203 | ||||||
| 2025-08-14 | 13F | Royal Bank Of Canada | 197,775 | 3.89 | 4,361 | 5.88 | ||||
| 2025-08-18 | 13F | Geneos Wealth Management Inc. | 9,751 | 3.32 | 215 | 5.39 | ||||
| 2025-08-19 | 13F | Anchor Investment Management, LLC | 1,425 | 235.29 | 31 | 244.44 | ||||
| 2025-08-12 | 13F | BlackRock, Inc. | 0 | -100.00 | 0 | |||||
| 2025-08-14 | 13F | Integrated Wealth Concepts LLC | 32,804 | 6.52 | 723 | 8.56 | ||||
| 2025-08-08 | 13F | Cetera Investment Advisers | 423,448 | -10.59 | 9,337 | -8.89 | ||||
| 2025-08-12 | 13F | Fca Corp /tx | 49,014 | 1.90 | 1,081 | 3.85 | ||||
| 2025-08-11 | 13F | Aptus Capital Advisors, LLC | 450 | 0.00 | 10 | 0.00 | ||||
| 2025-08-07 | 13F | Private Advisory Group LLC | 22,960 | -2.71 | 506 | -0.78 | ||||
| 2025-07-29 | 13F | BXM Wealth LLC | 10,025 | 221 | ||||||
| 2025-07-11 | 13F | Farther Finance Advisors, LLC | 8,423 | 186 | ||||||
| 2025-09-04 | 13F/A | Advisor Group Holdings, Inc. | 173,216 | 45.01 | 3,820 | 47.79 | ||||
| 2025-07-31 | 13F | Glass Jacobson Investment Advisors llc | 21,559 | 89.30 | 475 | 93.09 | ||||
| 2025-07-09 | 13F | Sarver Vrooman Wealth Advisors | 1,328 | 0.00 | 29 | 3.57 | ||||
| 2025-08-08 | 13F | Foundations Investment Advisors, LLC | 27,282 | 143.52 | 602 | 148.35 | ||||
| 2025-07-22 | 13F | Siligmueller & Norvid Wealth Advisors LLC | 22,520 | -5.74 | 495 | -4.26 | ||||
| 2025-08-06 | 13F | Valtinson Bruner Financial Planning LLC | 19,471 | 0.65 | 429 | 2.63 | ||||
| 2025-08-14 | 13F | Wells Fargo & Company/mn | 747,270 | 0.25 | 16,477 | 2.15 | ||||
| 2025-08-14 | 13F | TCG Advisory Services, LLC | 299,313 | 9.51 | 6,600 | 11.58 | ||||
| 2025-08-14 | 13F | Jane Street Group, Llc | 27,714 | -42.91 | 611 | -41.81 | ||||
| 2025-08-15 | 13F | WFA of San Diego, LLC | 2,294 | 51 | ||||||
| 2025-07-30 | 13F | Brookstone Capital Management | 27,104 | -5.29 | 598 | -3.55 | ||||
| 2025-07-31 | 13F | Oppenheimer & Co Inc | 12,006 | -2.78 | 265 | -1.12 | ||||
| 2025-05-12 | 13F | Fmr Llc | 0 | -100.00 | 0 | |||||
| 2025-08-01 | 13F | Advisory Alpha, LLC | 265,313 | 18.99 | 5,850 | 21.24 | ||||
| 2025-08-12 | 13F | Horizon Financial Services, Llc | 1,582 | -8.87 | 35 | -8.11 | ||||
| 2025-07-10 | 13F | Wealth Enhancement Advisory Services, Llc | 38,571 | -19.98 | 850 | -18.50 | ||||
| 2025-08-12 | 13F | Jpmorgan Chase & Co | 169 | -99.29 | 4 | -99.42 | ||||
| 2025-08-14 | 13F | Susquehanna International Group, Llp | 25,348 | 559 | ||||||
| 2025-08-12 | 13F | J.w. Cole Advisors, Inc. | 11,412 | 0.98 | 252 | 2.87 | ||||
| 2025-07-11 | 13F | AA Financial Advisors, LLC | 15,797 | 348 | ||||||
| 2025-08-07 | 13F | Hennion & Walsh Asset Management, Inc. | 72,463 | 3.98 | 1,598 | 5.90 | ||||
| 2025-08-12 | 13F | Steward Partners Investment Advisory, Llc | 307,039 | -5.26 | 6,770 | -3.46 | ||||
| 2025-07-31 | 13F | Topsail Wealth Management, LLC | 16,060 | 21.76 | 354 | 24.21 | ||||
| 2025-08-08 | 13F | IMA Wealth, Inc. | 32,491 | 0.75 | 716 | 2.73 | ||||
| 2025-07-22 | 13F | 4Thought Financial Group Inc. | 20,899 | -3.25 | 461 | -1.50 | ||||
| 2025-08-13 | 13F | Vermillion & White Wealth Management Group, LLC | 21,269 | -27.28 | 469 | -25.95 | ||||
| 2025-07-29 | 13F | Kraft, Davis & Associates, LLC | 24,925 | 7.57 | 547 | 10.30 | ||||
| 2025-07-24 | 13F | Leo Wealth, LLC | 217,208 | 4,789 | ||||||
| 2025-08-13 | 13F | Capital Analysts, Inc. | 14,703 | 1.15 | 0 | |||||
| 2025-08-15 | 13F | Morgan Stanley | 506,340 | -15.96 | 11,165 | -14.37 | ||||
| 2025-05-12 | 13F | Independent Advisor Alliance | 0 | -100.00 | 0 | |||||
| 2025-08-01 | 13F | MorganRosel Wealth Management, LLC | 5,911 | 0.00 | 130 | 2.36 | ||||
| 2025-08-06 | 13F | Prospera Financial Services Inc | 130,790 | 2.41 | 2,884 | 4.34 | ||||
| 2025-08-06 | 13F | Commonwealth Equity Services, Llc | 95,458 | 24.76 | 2 | 100.00 | ||||
| 2025-07-21 | 13F | Empirical Financial Services, LLC d.b.a. Empirical Wealth Management | 33,891 | 2.64 | 747 | 4.62 | ||||
| 2025-08-14 | 13F | Comerica Bank | 15,260 | -2.40 | 336 | -0.59 | ||||
| 2025-08-07 | 13F | SFE Investment Counsel | 355,613 | 2.05 | 7,841 | 3.99 | ||||
| 2025-07-11 | 13F | Meriwether Wealth & Planning, LLC | 23,005 | 3.93 | 507 | 5.85 | ||||
| 2025-08-05 | 13F | Key FInancial Inc | 18,835 | 41.88 | 415 | 44.60 | ||||
| 2025-07-14 | 13F | Sound Stewardship, LLC | 53,005 | 11.47 | 1,169 | 13.51 | ||||
| 2025-07-31 | 13F | Cambridge Investment Research Advisors, Inc. | 83,117 | 4.18 | 2 | 0.00 | ||||
| 2025-08-18 | 13F | Tyler-Stone Wealth Management | 38,707 | 3.65 | 853 | 5.57 | ||||
| 2025-04-17 | 13F | Missouri Trust & Investment Co | 0 | -100.00 | 0 | |||||
| 2025-04-25 | 13F | Albion Financial Group /ut | 0 | -100.00 | 0 | |||||
| 2025-07-08 | 13F | S.E.E.D. Planning Group LLC | 74,566 | 3.15 | 1,644 | 5.12 | ||||
| 2025-07-24 | 13F | Vantage Point Financial LLC | 46,375 | -1.98 | 1,023 | -0.10 | ||||
| 2025-08-15 | 13F | Captrust Financial Advisors | 259,885 | 6.03 | 5,730 | 8.03 | ||||
| 2025-07-14 | 13F | GAMMA Investing LLC | 4,311 | -92.30 | 95 | -92.15 | ||||
| 2025-08-05 | 13F | Summit Investment Advisory Services, LLC | 112,928 | 2,490 | ||||||
| 2025-08-14 | 13F | UBS Group AG | 391,338 | -15.19 | 8,629 | -13.57 | ||||
| 2025-08-01 | 13F | GPM Growth Investors, Inc. | 210,775 | 11.94 | 4,648 | 14.06 | ||||
| 2025-07-25 | 13F | Cwm, Llc | 0 | -100.00 | 0 | |||||
| 2025-08-01 | 13F | Koss-Olinger Consulting, LLC | 15,643 | -7.43 | 345 | -6.01 | ||||
| 2025-08-04 | 13F | IFG Advisory, LLC | 16,307 | 20.79 | 360 | 22.95 | ||||
| 2025-07-29 | 13F | Alaska Permanent Capital Management | 6,933 | 152 | ||||||
| 2025-08-11 | 13F | Principal Securities, Inc. | 2,926 | 58.76 | 65 | 64.10 | ||||
| 2025-08-14 | 13F | Old Mission Capital Llc | 0 | -100.00 | 0 | |||||
| 2025-08-14 | 13F | Mercer Global Advisors Inc /adv | 341,181 | -2.78 | 7,523 | -0.93 | ||||
| 2025-08-14 | 13F | GWM Advisors LLC | 61,387 | 0.15 | 1,354 | 2.04 | ||||
| 2025-07-23 | 13F | Ironwood Financial, llc | 88,704 | 0.00 | 1,920 | 0.00 | ||||
| 2025-08-04 | 13F | AlphaStar Capital Management, LLC | 16,836 | 1.21 | 371 | 3.34 | ||||
| 2025-07-08 | 13F | Ballew Advisors, Inc | 25,316 | 0.00 | 558 | 4.10 | ||||
| 2025-08-13 | 13F | Brown Advisory Inc | 29,062 | 0.00 | 641 | 1.91 | ||||
| 2025-07-14 | 13F | AdvisorNet Financial, Inc | 28 | 0.00 | 1 | |||||
| 2025-07-29 | 13F | APCM Wealth Management for Individuals | 9,114 | 201 | ||||||
| 2025-08-12 | 13F | SRS Capital Advisors, Inc. | 471 | 10 | ||||||
| 2025-08-13 | 13F | Jones Financial Companies Lllp | 138,195 | 23.01 | 3,035 | 24.70 | ||||
| 2025-08-14 | 13F | Atomi Financial Group, Inc. | 43,273 | 13.51 | 954 | 15.78 | ||||
| 2025-08-07 | 13F | Allworth Financial LP | 300 | 7 | ||||||
| 2025-07-21 | 13F | Ashton Thomas Securities, Llc | 57,764 | 0.38 | 1,274 | 2.25 | ||||
| 2025-08-12 | 13F | Kaye Capital Management | 0 | -100.00 | 0 | |||||
| 2025-08-14 | 13F | Ameriprise Financial Inc | 209,104 | 5.52 | 4,611 | 7.66 | ||||
| 2025-07-18 | 13F | Consolidated Portfolio Review Corp | 42,491 | 8.19 | 937 | 10.25 | ||||
| 2025-08-05 | 13F | Bank Of Montreal /can/ | 0 | -100.00 | 0 | |||||
| 2025-08-14 | 13F | Stifel Financial Corp | 83,155 | 15.18 | 1,834 | 17.35 | ||||
| 2025-07-11 | 13F | Quad-Cities Investment Group, LLC | 9,161 | 202 | ||||||
| 2025-08-14 | 13F | Bank Of America Corp /de/ | 91,342 | 34.77 | 2,014 | 37.38 | ||||
| 2025-07-29 | 13F | Stephens Inc /ar/ | 16,006 | -18.49 | 353 | -16.98 | ||||
| 2025-08-06 | 13F | Summit Investment Advisors, Inc. | 121,173 | 10.19 | 2,662 | 11.99 | ||||
| 2025-08-11 | 13F | Oder Investment Management, LLC | 29,059 | 5.54 | 641 | 7.56 | ||||
| 2025-08-19 | 13F | Asset Dedication, LLC | 4,350 | 96 | ||||||
| 2025-08-11 | 13F | Cornerstone Planning Group LLC | 93 | 2 | ||||||
| 2025-08-14 | 13F | Mml Investors Services, Llc | 124,541 | 18.26 | 3 | 0.00 | ||||
| 2025-08-11 | 13F | Private Advisor Group, LLC | 21,742 | 6.55 | 479 | 8.62 | ||||
| 2025-07-31 | 13F | Strait & Sound Wealth Management LLC | 65,231 | 33.61 | 1,438 | 36.17 | ||||
| 2025-07-31 | 13F | Turning Point Benefit Group, Inc. | 33,075 | 64.45 | 729 | 72.75 | ||||
| 2025-08-08 | 13F | Larson Financial Group LLC | 7,866 | 1.69 | 173 | 3.59 | ||||
| 2025-08-11 | 13F | Shufro Rose & Co Llc | 10,000 | 0.00 | 216 | 0.00 | ||||
| 2025-07-31 | 13F | Carnegie Capital Asset Management, LLC | 14,350 | 316 | ||||||
| 2025-08-06 | 13F | Altrius Capital Management Inc | 30,679 | 50.57 | 676 | 53.64 | ||||
| 2025-07-07 | 13F | Horizons Wealth Management | 3,069 | 0.00 | 68 | 1.52 | ||||
| 2025-07-21 | 13F | Segment Wealth Management, LLC | 52,060 | -1.42 | 1,148 | 0.44 | ||||
| 2025-08-14 | 13F | Raymond James Financial Inc | 156,154 | -47.81 | 3,443 | -46.82 | ||||
| 2025-07-17 | 13F | Wolff Wiese Magana Llc | 1,025 | 48.12 | 23 | 57.14 | ||||
| 2025-05-07 | 13F | Vista Private Wealth Partners. LLC | 0 | -100.00 | 0 | |||||
| 2025-08-11 | 13F | Howard Wealth Management, Llc | 97,735 | -0.53 | 2,155 | 1.36 | ||||
| 2025-08-13 | 13F | Invesco Ltd. | 124,113 | 29.12 | 2,737 | 31.54 | ||||
| 2025-07-15 | 13F | Legacy Financial Group LLC | 27,076 | 6.28 | 597 | 8.35 | ||||
| 2025-08-12 | 13F | LPL Financial LLC | 1,382,592 | 21.46 | 30,486 | 23.76 | ||||
| 2025-04-10 | 13F | Retireful, LLC | 0 | -100.00 | 0 | |||||
| 2025-08-15 | 13F | Equitable Holdings, Inc. | 343,562 | -4.26 | 7,576 | -2.45 | ||||
| 2025-07-29 | 13F | Latitude Advisors, LLC | 10,760 | 237 | ||||||
| 2025-07-18 | 13F | Ledgewood Wealth Advisors, LLC | 17,332 | 0.57 | 382 | 2.69 | ||||
| 2025-08-13 | 13F | MONECO Advisors, LLC | 25,499 | -26.02 | 562 | -24.56 | ||||
| 2025-05-15 | 13F | Ancora Advisors, LLC | 0 | -100.00 | 0 | -100.00 | ||||
| 2025-08-14 | 13F | Guardian Wealth Advisors, Llc / Nc | 450 | 0.00 | 10 | 0.00 | ||||
| 2025-07-25 | 13F | Astoria Portfolio Advisors LLC. | 57,742 | 1.26 | 1,268 | 3.59 | ||||
| 2025-08-06 | 13F | Financial Advisory Corp /ut/ /adv | 199,085 | -1.14 | 4 | 0.00 | ||||
| 2025-07-29 | 13F | Private Trust Co Na | 941 | 159.23 | 21 | 185.71 |