Mga Batayang Estadistika
| Pemilik Institusional | 242 total, 242 long only, 0 short only, 0 long/short - change of 11.52% MRQ |
| Alokasi Portofolio Rata-rata | 0.3505 % - change of 3.17% MRQ |
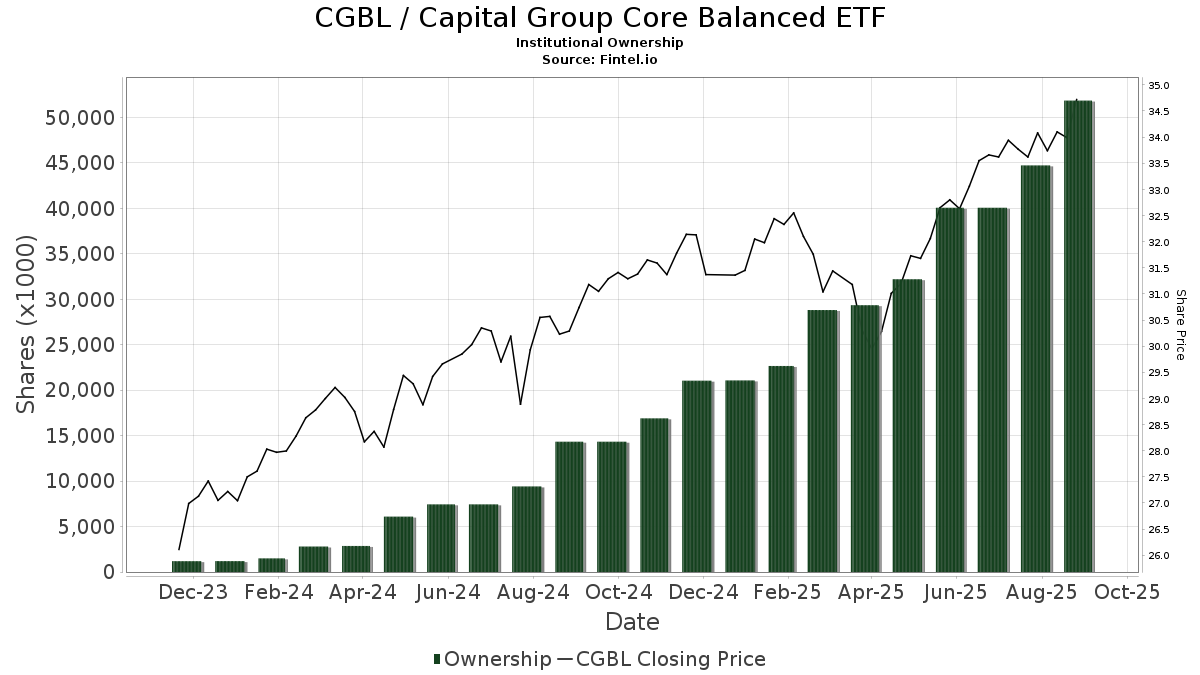
| Saham Institusional (Jangka Panjang) | 51,850,165 (ex 13D/G) - change of 11.79MM shares 29.42% MRQ |
| Nilai Institusional (Jangka Panjang) | $ 1,502,536 USD ($1000) |
Kepemilikan Institusional dan Pemegang Saham
Capital Group Core Balanced ETF (US:CGBL) memiliki 242 pemilik institusional dan pemegang saham yang telah mengajukan formulir 13D/G atau 13F kepada Komisi Bursa Efek (Securities Exchange Commission/SEC). Lembaga-lembaga ini memegang total 51,850,165 saham. Pemegang saham terbesar meliputi LPL Financial LLC, Envestnet Asset Management Inc, Advance Capital Management, Inc., Morgan Stanley, Cwm, Llc, Raymond James Financial Inc, Commonwealth Equity Services, Llc, Wealth Enhancement Advisory Services, Llc, Cetera Investment Advisers, and Cambridge Investment Research Advisors, Inc. .
Struktur kepemilikan institusional Capital Group Core Balanced ETF (ARCA:CGBL) menunjukkan posisi terkini di perusahaan oleh institusi dan dana, serta perubahan terbaru dalam ukuran posisi. Pemegang saham utama dapat mencakup investor individu, reksa dana, dana lindung nilai, atau institusi. Jadwal 13D menunjukkan bahwa investor memegang (atau pernah memegang) lebih dari 5% saham perusahaan dan bermaksud (atau pernah bermaksud) untuk secara aktif mengejar perubahan strategi bisnis. Jadwal 13G menunjukkan investasi pasif lebih dari 5%.
The share price as of September 5, 2025 is 34.38 / share. Previously, on September 9, 2024, the share price was 29.99 / share. This represents an increase of 14.64% over that period.
Skor Sentimen Dana
Skor Sentimen Dana (sebelumnya dikenal sebagai Skor Akumulasi Kepemilikan) menemukan saham-saham yang paling banyak dibeli oleh dana. Ini adalah hasil dari model kuantitatif multi-faktor yang canggih yang mengidentifikasi perusahaan dengan tingkat akumulasi institusional tertinggi. Model penilaian menggunakan kombinasi dari total peningkatan pemilik yang diungkapkan, perubahan dalam alokasi portofolio pada pemilik tersebut, dan metrik lainnya. Angka berkisar dari 0 hingga 100, dengan angka yang lebih tinggi menunjukkan tingkat akumulasi yang lebih tinggi dibandingkan dengan perusahaan sejenisnya, dan 50 adalah rata-ratanya.
Frekuensi Pembaruan: Setiap Hari
Lihat Ownership Explorer, yang menyediakan daftar perusahaan dengan peringkat tertinggi.
Rasio Put/Call Institusional
Selain melaporkan isu ekuitas dan utang standar, institusi dengan aset di bawah manajemen lebih dari 100 juta dolar AS juga harus mengungkapkan kepemilikan opsi put dan call mereka. Karena opsi put umumnya menunjukkan sentimen negatif, dan opsi call menunjukkan sentimen positif, kita dapat mengetahui sentimen institusional secara keseluruhan dengan memplot rasio put terhadap call. Grafik di sebelah kanan memplot rasio put/call historis untuk instrumen ini.
Menggunakan Rasio Put/Call sebagai indikator sentimen investor mengatasi salah satu kekurangan utama dari penggunaan total kepemilikan institusional, yaitu sejumlah besar aset yang dikelola diinvestasikan secara pasif untuk melacak indeks. Dana yang dikelola secara pasif biasanya tidak membeli opsi, sehingga indikator rasio put/call lebih akurat dalam melacak sentimen dana yang dikelola secara aktif.
Pengajuan 13F dan NPORT
Detail pada pengajuan 13F tersedia gratis. Detail pada pengajuan NP memerlukan keanggotaan premium. Baris berwarna hijau menunjukkan posisi baru. Baris berwarna merah menunjukkan posisi yang sudah ditutup. Klik tautan ini ikon untuk melihat riwayat transaksi selengkapnya.
Tingkatkan
untuk membuka data premium dan mengekspor ke Excel ![]() .
.
| Tanggal File | Sumber | Investor | Ketik | Presyo ng Avg (Silangan) |
Saham | Δ Saham (%) |
Dilaporkan Nilai ($1000) |
Nilai Δ (%) |
Alokasi Port (%) |
|
|---|---|---|---|---|---|---|---|---|---|---|
| 2025-07-29 | 13F | Burford Brothers, Inc. | 38,845 | 18.69 | 1,299 | 28.13 | ||||
| 2025-08-15 | 13F | First Heartland Consultants, Inc. | 56,571 | 59.51 | 1,892 | 72.22 | ||||
| 2025-07-22 | 13F | Merit Financial Group, LLC | 156,348 | 119.34 | 5,228 | 136.78 | ||||
| 2025-07-29 | 13F | Stratos Wealth Advisors, LLC | 40,162 | 40.47 | 1,343 | 51.75 | ||||
| 2025-08-13 | 13F | Certior Financial Group, Llc | 13,308 | 9.51 | 445 | 18.35 | ||||
| 2025-08-14 | 13F | UBS Group AG | 113,689 | 24.39 | 3,802 | 34.26 | ||||
| 2025-08-19 | 13F | National Asset Management, Inc. | 384,074 | 514.41 | 12,843 | 557.27 | ||||
| 2025-08-14 | 13F | TCG Advisory Services, LLC | 35,093 | -52.27 | 1,173 | -48.48 | ||||
| 2025-08-12 | 13F | Financial Advocates Investment Management | 34,722 | -8.52 | 1,161 | -1.19 | ||||
| 2025-07-29 | 13F | Signature Estate & Investment Advisors Llc | 89,976 | 13.75 | 3,009 | 22.78 | ||||
| 2025-07-14 | 13F | Sweeney & Michel, Llc | 6,437 | 216 | ||||||
| 2025-07-16 | 13F | Kiley Juergens Wealth Management, Llc | 15,061 | 32.73 | 504 | 43.30 | ||||
| 2025-07-09 | 13F | Keystone Wealth Services, LLC | 30,000 | -16.86 | 1,003 | -10.21 | ||||
| 2025-08-11 | 13F | Bell Investment Advisors, Inc | 46 | 0.00 | 2 | 0.00 | ||||
| 2025-08-08 | 13F | Gts Securities Llc | 15,693 | 525 | ||||||
| 2025-08-14 | 13F | Diversify Wealth Management, Llc | 11,911 | 14.05 | 405 | 25.39 | ||||
| 2025-08-11 | 13F | Private Advisor Group, LLC | 444,601 | 20.12 | 14,867 | 29.66 | ||||
| 2025-07-29 | 13F | Koshinski Asset Management, Inc. | 64,610 | 4.76 | 2,161 | 13.09 | ||||
| 2025-07-29 | 13F | Balboa Wealth Partners | 14,723 | 492 | ||||||
| 2025-07-29 | 13F | Private Trust Co Na | 9,866 | 0.00 | 330 | 7.87 | ||||
| 2025-07-28 | 13F | Sagespring Wealth Partners, Llc | 119,313 | 27.27 | 3,990 | 37.36 | ||||
| 2025-08-12 | 13F | Lodestone Wealth Management LLC | 12,927 | 0.32 | 432 | 8.27 | ||||
| 2025-08-07 | 13F | Cvfg Llc | 103,662 | 17.84 | 3,466 | 27.19 | ||||
| 2025-08-06 | 13F | Vantage Financial Partners, LLC | 33,821 | 1,131 | ||||||
| 2025-08-11 | 13F | Principal Securities, Inc. | 1,985 | 66 | ||||||
| 2025-05-02 | 13F | Capital A Wealth Management, LLC | 1,858 | -8.92 | 58 | -9.52 | ||||
| 2025-07-22 | 13F | Simplicity Wealth,LLC | 6,402 | 214 | ||||||
| 2025-08-12 | 13F | Jpmorgan Chase & Co | 8,040 | 269 | ||||||
| 2025-08-18 | 13F | Tyler-Stone Wealth Management | 20,990 | 15.20 | 702 | 24.29 | ||||
| 2025-07-10 | 13F | Financial Management Network Inc | 7,614 | -8.78 | 257 | 6.22 | ||||
| 2025-08-04 | 13F | Mesirow Financial Investment Management, Inc. | 289,500 | 10.40 | 9,681 | 19.15 | ||||
| 2025-08-12 | 13F | SRS Capital Advisors, Inc. | 4,453 | 85.08 | 149 | 100.00 | ||||
| 2025-07-25 | 13F | McNamara Financial Services, Inc. | 10,271 | -54.94 | 343 | -51.42 | ||||
| 2025-08-14 | 13F | Wells Fargo & Company/mn | 612,948 | 369,145.78 | 20,497 | 409,820.00 | ||||
| 2025-08-14 | 13F | GWM Advisors LLC | 133,638 | 293.72 | 4,469 | 325.12 | ||||
| 2025-08-14 | 13F | IHT Wealth Management, LLC | 15,668 | 77.92 | 524 | 92.28 | ||||
| 2025-08-13 | 13F | Bare Financial Services, Inc | 36,522 | 22.55 | 1,221 | 32.29 | ||||
| 2025-07-22 | 13F | DAVENPORT & Co LLC | 47,186 | 74.80 | 1,578 | 88.64 | ||||
| 2025-08-14 | 13F | Wiley Bros.-aintree Capital, Llc | 164,127 | 46.97 | 5,527 | 58.59 | ||||
| 2025-07-17 | 13F | KWB Wealth | 232,371 | 68.01 | 7,199 | 66.47 | ||||
| 2025-07-28 | 13F | Holistic Planning, LLC | 6,398 | -39.56 | 214 | -34.86 | ||||
| 2025-07-25 | 13F | Atria Wealth Solutions, Inc. | 60,108 | -59.28 | 2,020 | -56.00 | ||||
| 2025-08-12 | 13F | NWF Advisory Services Inc. | 17,815 | 20.45 | 552 | 19.26 | ||||
| 2025-08-14 | 13F | Great Valley Advisor Group, Inc. | 344,272 | 25.35 | 11,513 | 35.31 | ||||
| 2025-07-25 | 13F | Cwm, Llc | 2,207,565 | 208.62 | 74 | 231.82 | ||||
| 2025-05-08 | 13F | Plante Moran Financial Advisors, LLC | 0 | -100.00 | 0 | |||||
| 2025-08-15 | 13F | High Falls Advisors, Inc | 9,635 | 0.00 | 322 | 8.05 | ||||
| 2025-08-14 | 13F | Tudor Financial Inc. | 11,394 | 50.75 | 381 | 62.82 | ||||
| 2025-08-08 | 13F | Kingsview Wealth Management, LLC | 27,787 | -12.25 | 929 | -5.30 | ||||
| 2025-08-08 | 13F | Creative Planning | 6,530 | 218 | ||||||
| 2025-08-14 | 13F | Clg Llc | 92,348 | 125.22 | 3,088 | 143.15 | ||||
| 2025-07-21 | 13F | Patriot Financial Group Insurance Agency, LLC | 55,705 | 27.74 | 1,863 | 37.93 | ||||
| 2025-08-08 | 13F | CWS Financial Advisors, LLC | 93,389 | 32.24 | 3,123 | 42.75 | ||||
| 2025-08-14 | 13F | Mpwm Advisory Solutions, Llc | 444 | 1.83 | 15 | 7.69 | ||||
| 2025-08-04 | 13F | Bridgewealth Advisory Group, LLC | 16,631 | 5.96 | 556 | 14.40 | ||||
| 2025-08-14 | 13F | Benjamin Edwards Inc | 265,893 | 40.89 | 8,891 | 52.09 | ||||
| 2025-08-13 | 13F | Baird Financial Group, Inc. | 203,993 | 3.58 | 6,822 | 11.80 | ||||
| 2025-08-01 | 13F | Gwn Securities Inc. | 0 | -100.00 | 0 | |||||
| 2025-08-11 | 13F | United Advisor Group, LLC | 28,694 | 69.85 | 960 | 83.37 | ||||
| 2025-08-11 | 13F | Regal Investment Advisors LLC | 9,166 | 307 | ||||||
| 2025-07-24 | 13F | IFP Advisors, Inc | 210,471 | 16.47 | 7,038 | 25.72 | ||||
| 2025-07-08 | 13F | Advance Capital Management, Inc. | 2,707,404 | 24.39 | 90,536 | 34.27 | ||||
| 2025-07-29 | 13F | Latitude Advisors, LLC | 16,433 | 7.70 | 550 | 16.31 | ||||
| 2025-08-12 | 13F | Steward Partners Investment Advisory, Llc | 51,829 | 14.97 | 1,733 | 24.14 | ||||
| 2025-07-23 | 13F | Clear Creek Financial Management, LLC | 89,959 | 6.48 | 3,008 | 14.94 | ||||
| 2025-08-14 | 13F | Royal Bank Of Canada | 1,533,507 | 1.59 | 51,281 | 9.66 | ||||
| 2025-07-10 | 13F | High Net Worth Advisory Group LLC | 164,745 | 18.93 | 5,509 | 28.38 | ||||
| 2025-08-04 | 13F | Flagship Harbor Advisors, Llc | 194,959 | 6,519 | ||||||
| 2025-08-15 | 13F | Morgan Stanley | 2,402,025 | 9.23 | 80,324 | 17.91 | ||||
| 2025-08-12 | 13F | Proequities, Inc. | 0 | 0 | ||||||
| 2025-07-30 | 13F | Financial Perspectives, Inc | 5,821 | 225.92 | 195 | 252.73 | ||||
| 2025-08-14 | 13F | Visionary Wealth Advisors | 18,078 | 6.66 | 605 | 15.05 | ||||
| 2025-07-23 | 13F | Capital Management Associates, Inc | 186,189 | -40.48 | 6,226 | -35.75 | ||||
| 2025-08-14 | 13F | Susquehanna International Group, Llp | 304,914 | 10,196 | ||||||
| 2025-08-08 | 13F | Thoroughbred Financial Services, Llc | 112,179 | 27.12 | 4 | 50.00 | ||||
| 2025-08-12 | 13F | Franklin Resources Inc | 61,621 | 2,061 | ||||||
| 2025-07-15 | 13F | Colonial River Wealth Management, LLC | 12,173 | 22.00 | 411 | 32.69 | ||||
| 2025-08-13 | 13F | Continuum Advisory, LLC | 24,225 | 23.00 | 810 | 32.79 | ||||
| 2025-07-10 | 13F | Wealth Enhancement Advisory Services, Llc | 1,796,522 | 3.42 | 60,543 | 12.50 | ||||
| 2025-08-08 | 13F | Security Financial Services, INC. | 23,733 | 794 | ||||||
| 2025-07-24 | 13F | MSH Capital Advisors LLC | 0 | -100.00 | 0 | |||||
| 2025-08-12 | 13F | J.w. Cole Advisors, Inc. | 22,544 | 61.09 | 754 | 73.90 | ||||
| 2025-08-14 | 13F | Challenger Wealth Management | 109,258 | -6.08 | 3,654 | 1.39 | ||||
| 2025-07-07 | 13F | Thurston, Springer, Miller, Herd & Titak, Inc. | 9,916 | 110.58 | 332 | 128.28 | ||||
| 2025-07-16 | 13F | Strategic Investment Solutions, Inc. /IL | 2,437 | 0.00 | 81 | 8.00 | ||||
| 2025-07-30 | 13F | Smith Thornton Advisors LLC | 20,073 | 50.45 | 671 | 62.47 | ||||
| 2025-05-15 | 13F | Fft Wealth Management Llc | 0 | -100.00 | 0 | |||||
| 2025-07-09 | 13F | Pines Wealth Management, LLC | 19,984 | 11.18 | 673 | 30.93 | ||||
| 2025-08-15 | 13F | Captrust Financial Advisors | 81,796 | 20.32 | 2,735 | 29.87 | ||||
| 2025-08-26 | 13F | Nautilus Advisors LLC | 33,518 | -27.19 | 1,121 | -21.46 | ||||
| 2025-08-08 | 13F | Cetera Investment Advisers | 1,744,688 | 12.21 | 58,342 | 21.12 | ||||
| 2025-08-06 | 13F | Prospera Financial Services Inc | 87,584 | 42.44 | 2,929 | 53.75 | ||||
| 2025-07-21 | 13F | Ameritas Advisory Services, LLC | 33,764 | -39.72 | 1,129 | -35.26 | ||||
| 2025-08-14 | 13F | Old Mission Capital Llc | 261,722 | 563.04 | 8,752 | 616.12 | ||||
| 2025-08-11 | 13F | TD Waterhouse Canada Inc. | 5,645 | 0.00 | 188 | 7.43 | ||||
| 2025-08-07 | 13F | Allworth Financial LP | 4,666 | 9.12 | 156 | 19.08 | ||||
| 2025-08-12 | 13F | Leigh Baldwin & Co., Llc | 30,925 | 56.34 | 1,034 | 68.95 | ||||
| 2025-07-16 | 13F | Essex Financial Services, Inc. | 85,482 | 48.78 | 2,859 | 60.56 | ||||
| 2025-08-15 | 13F | Equitable Holdings, Inc. | 89,923 | 353.79 | 3,007 | 390.54 | ||||
| 2025-08-13 | 13F | Keystone Financial Group | 9,071 | 21.06 | 303 | 30.60 | ||||
| 2025-05-14 | 13F | Oarsman Capital, Inc. | 0 | -100.00 | 0 | |||||
| 2025-07-22 | 13F | Iron Horse Wealth Management, LLC | 1,000 | 0.00 | 33 | 10.00 | ||||
| 2025-07-28 | 13F | Axxcess Wealth Management, Llc | 12,173 | 22.00 | 407 | 31.72 | ||||
| 2025-04-14 | 13F | Strategic Wealth Designers | 0 | -100.00 | 0 | -100.00 | ||||
| 2025-07-21 | 13F | Warner Financial, Inc | 7,289 | -10.98 | 0 | |||||
| 2025-08-13 | 13F | Capital Group Private Client Services, Inc. | 173,825 | 9.23 | 5,813 | 17.89 | ||||
| 2025-07-30 | 13F | Strategic Blueprint, LLC | 131,834 | 316.20 | 4,409 | 349.34 | ||||
| 2025-08-05 | 13F | Dahring | Cusmano Llc | 49,786 | -6.38 | 1,665 | 1.03 | ||||
| 2025-08-06 | 13F | Mark Sheptoff Financial Planning, Llc | 2,088 | 0.00 | 70 | 7.81 | ||||
| 2025-07-17 | 13F | Janney Montgomery Scott LLC | 310,430 | 69.54 | 10 | 100.00 | ||||
| 2025-07-14 | 13F | Ai Financial Services Llc | 8,179 | 0.00 | 274 | 7.91 | ||||
| 2025-08-14 | 13F | Gerber Kawasaki Wealth & Investment Management | 91,327 | 23.10 | 3,054 | 32.90 | ||||
| 2025-07-31 | 13F | Cambridge Investment Research Advisors, Inc. | 1,636,062 | 5.62 | 55 | 14.89 | ||||
| 2025-08-14 | 13F | Integrated Wealth Concepts LLC | 106,710 | 32.59 | 3,568 | 43.12 | ||||
| 2025-08-13 | 13F | Cary Street Partners Financial Llc | 367,032 | 4,825.94 | 12,274 | 5,236.09 | ||||
| 2025-07-16 | 13F | St Germain D J Co Inc | 652,940 | -7.48 | 21,834 | -0.13 | ||||
| 2025-08-12 | 13F | LPL Financial LLC | 7,448,979 | 35.32 | 249,094 | 46.06 | ||||
| 2025-08-14 | 13F | Modern Wealth Management, LLC | 9,480 | -0.42 | 317 | 7.82 | ||||
| 2025-08-13 | 13F | Smith, Moore & Co. | 153,168 | 23.59 | 5,122 | 33.39 | ||||
| 2025-08-06 | 13F | Founders Financial Securities Llc | 182,165 | 11.98 | 6,092 | 21.31 | ||||
| 2025-08-14 | 13F | Tennessee Valley Asset Management Partners | 0 | -100.00 | 0 | |||||
| 2025-08-14 | 13F | Raymond James Financial Inc | 1,838,766 | 75.56 | 61,488 | 89.50 | ||||
| 2025-07-25 | 13F | Concurrent Investment Advisors, LLC | 355,793 | 78.57 | 11,898 | 92.76 | ||||
| 2025-07-29 | 13F | Stephens Inc /ar/ | 11,695 | 391 | ||||||
| 2025-07-31 | 13F | Buckingham Strategic Partners | 16,144 | 30.73 | 540 | 41.10 | ||||
| 2025-08-14 | 13F | Hilltop Holdings Inc. | 9,750 | 0.00 | 326 | 7.95 | ||||
| 2025-08-14 | 13F | Jane Street Group, Llc | 140,000 | -50.23 | 4,682 | -46.28 | ||||
| 2025-07-16 | 13F | ORG Partners LLC | 27,604 | 4,700.70 | 921 | 5,317.65 | ||||
| 2025-07-16 | 13F | Spinnaker Investment Group, LLC | 12,541 | 419 | ||||||
| 2025-08-11 | 13F | Advisor Resource Council | 6,533 | -96.04 | 218 | -95.73 | ||||
| 2025-05-14 | 13F | Orion Portfolio Solutions, LLC | 8,450 | 0.00 | 264 | 0.00 | ||||
| 2025-07-10 | 13F | Worth Asset Management, LLC | 161,429 | 70.43 | 5,398 | 83.98 | ||||
| 2025-07-11 | 13F | AA Financial Advisors, LLC | 57,599 | -2.21 | 1,926 | 5.59 | ||||
| 2025-07-28 | 13F | SFG Wealth Management, LLC. | 0 | -100.00 | 0 | |||||
| 2025-07-09 | 13F | Massmutual Trust Co Fsb/adv | 11 | 0.00 | 0 | |||||
| 2025-08-14 | 13F | Colony Group, LLC | 7,472 | 250 | ||||||
| 2025-07-24 | 13F | Us Bancorp \de\ | 540 | 0.00 | 18 | 12.50 | ||||
| 2025-09-04 | 13F/A | Advisor Group Holdings, Inc. | 1,432,969 | -12.18 | 47,923 | -5.20 | ||||
| 2025-07-23 | 13F | Seamount Financial Group Inc | 126,907 | 19.54 | 4,244 | 29.05 | ||||
| 2025-08-12 | 13F | Richmond Investment Services, LLC | 24,583 | 91.52 | 822 | 107.05 | ||||
| 2025-04-10 | 13F | Eclectic Associates Inc /adv | 0 | -100.00 | 0 | |||||
| 2025-07-17 | 13F | Venture Visionary Partners LLC | 85,405 | 52.55 | 2,856 | 64.65 | ||||
| 2025-08-04 | 13F | Northwest Financial Advisors | 13,195 | 441 | ||||||
| 2025-08-14 | 13F | Citadel Advisors Llc | 255,847 | 469.08 | 8,556 | 514.58 | ||||
| 2025-07-15 | 13F | tru Independence LLC | 8,370 | 7.85 | 280 | 16.25 | ||||
| 2025-07-15 | 13F | Hartmann Taylor Wealth Management, LLC | 287,133 | -1.53 | 9,602 | 6.29 | ||||
| 2025-05-14 | 13F | Capital Analysts, Inc. | 0 | -100.00 | 0 | |||||
| 2025-07-09 | 13F | Dynamic Advisor Solutions LLC | 8,107 | -3.57 | 271 | 4.23 | ||||
| 2025-05-12 | 13F | WealthPLAN Partners, LLC | 0 | -100.00 | 0 | |||||
| 2025-07-25 | 13F | Apollon Wealth Management, LLC | 57,599 | 1,926 | ||||||
| 2025-08-12 | 13F | Summit Global Investments | 13,015 | 10.13 | 0 | |||||
| 2025-05-15 | 13F | MAI Capital Management | 0 | -100.00 | 0 | |||||
| 2025-07-31 | 13F | Moloney Securities Asset Management, LLC | 28,516 | 9.02 | 954 | 17.65 | ||||
| 2025-08-01 | 13F | Taylor Financial Group, Inc. | 104,370 | 11.05 | 3,490 | 19.89 | ||||
| 2025-08-15 | 13F | Kestra Advisory Services, LLC | 807,188 | 19.99 | 26,992 | 29.51 | ||||
| 2025-07-28 | 13F | Eq Wealth Advisors, Llc | 280 | 0.36 | 9 | 12.50 | ||||
| 2025-08-13 | 13F | VestGen Advisors, LLC | 277,245 | 5.15 | 9,271 | 13.50 | ||||
| 2025-07-14 | 13F | Armstrong Advisory Group, Inc | 0 | -100.00 | 0 | |||||
| 2025-07-31 | 13F | Richards, Merrill & Peterson, Inc. | 0 | -100.00 | 0 | |||||
| 2025-04-30 | 13F | J Hagan Capital, Inc. | 120,264 | 3,761 | ||||||
| 2025-07-02 | 13F | HBW Advisory Services LLC | 18,755 | 134.53 | 627 | 153.85 | ||||
| 2025-08-15 | 13F | Lantern Wealth Advisors, LLC | 18,220 | 609 | ||||||
| 2025-07-25 | 13F | We Are One Seven, LLC | 31,293 | 6.46 | 1,046 | 14.95 | ||||
| 2025-07-17 | 13F | Prepared Retirement Institute LLC | 9,528 | 0.40 | 319 | 8.16 | ||||
| 2025-07-21 | 13F | Ashton Thomas Securities, Llc | 29,780 | 64.43 | 996 | 77.36 | ||||
| 2025-07-25 | 13F | Transcendent Capital Group LLC | 8,592 | -11.01 | 287 | -4.01 | ||||
| 2025-07-25 | 13F | Quantum Financial Planning Services, Inc. | 237,715 | 2,113.77 | 7,949 | 2,294.28 | ||||
| 2025-08-14 | 13F | Evergreen Wealth Solutions, LLC | 6,850 | 229 | ||||||
| 2025-07-17 | 13F | Tempus Wealth Planning, LLC | 134,649 | 2.51 | 4,503 | 10.64 | ||||
| 2025-08-05 | 13F | Claro Advisors LLC | 6,675 | 0.60 | 223 | 8.78 | ||||
| 2025-07-11 | 13F | LongView Wealth Management | 158,837 | 18.21 | 5,312 | 27.61 | ||||
| 2025-08-07 | 13F | Clarity Wealth Advisors, LLC | 106,568 | 19.67 | 3,564 | 29.19 | ||||
| 2025-08-13 | 13F | Renaissance Technologies Llc | 93,100 | 3,113 | ||||||
| 2025-07-17 | 13F | Johnson Bixby & Associates, LLC | 206,975 | -0.59 | 6,921 | 7.30 | ||||
| 2025-08-05 | 13F | Magnolia Capital Advisors Llc | 10,738 | 0.00 | 359 | 8.13 | ||||
| 2025-08-11 | 13F | Rothschild Investment Llc | 7,620 | 0.86 | 255 | 8.55 | ||||
| 2025-07-03 | 13F | Arvest Investments, Inc. | 1,765 | 0.00 | 59 | 9.26 | ||||
| 2025-07-22 | 13F | Beacon Financial Advisory LLC | 39,538 | 25.39 | 1,322 | 35.45 | ||||
| 2025-08-13 | 13F | RIA Advisory Group LLC | 30,785 | 3.83 | 1,029 | 12.09 | ||||
| 2025-07-23 | 13F | Valmark Advisers, Inc. | 64,442 | 35.59 | 2,155 | 46.33 | ||||
| 2025-07-28 | 13F | RFG Advisory, LLC | 82,545 | 76.79 | 2,760 | 90.87 | ||||
| 2025-08-04 | 13F | Spire Wealth Management | 4,845 | -43.87 | 162 | -39.33 | ||||
| 2025-08-07 | 13F | Kestra Private Wealth Services, Llc | 459,776 | 125.94 | 15,375 | 143.88 | ||||
| 2025-07-31 | 13F | Hobart Private Capital, LLC | 6,549 | -1.00 | 219 | 6.86 | ||||
| 2025-08-11 | 13F | HighTower Advisors, LLC | 184,414 | 8.68 | 6,167 | 17.29 | ||||
| 2025-08-01 | 13F | Brookwood Investment Group LLC | 20,367 | -2.61 | 681 | 5.26 | ||||
| 2025-08-11 | 13F | Synergy Investment Management, LLC | 0 | -100.00 | 0 | |||||
| 2025-07-28 | 13F | Harbour Investments, Inc. | 436,456 | 37.28 | 14,595 | 48.19 | ||||
| 2025-08-05 | 13F | Carson Advisory Inc. | 13,075 | 0.00 | 437 | 7.90 | ||||
| 2025-08-07 | 13F | PFG Advisors | 49,998 | 54.59 | 1,672 | 66.93 | ||||
| 2025-08-14 | 13F | Harmony Asset Management Llc | 5,993 | 200 | ||||||
| 2025-08-05 | 13F | Westside Investment Management, Inc. | 108,068 | 8.57 | 3,614 | 17.19 | ||||
| 2025-08-04 | 13F | WNY Asset Management, LLC | 42,077 | -12.17 | 1,407 | -5.19 | ||||
| 2025-08-14 | 13F | Comerica Bank | 56,672 | -9.92 | 1,895 | -2.72 | ||||
| 2025-07-14 | 13F | Golden State Equity Partners | 0 | -100.00 | 0 | |||||
| 2025-08-19 | 13F | Advisory Services Network, LLC | 121,134 | -34.49 | 4,074 | -28.89 | ||||
| 2025-07-14 | 13F | Opal Wealth Advisors, LLC | 1,372 | 106.94 | 46 | 125.00 | ||||
| 2025-08-29 | 13F | Centaurus Financial, Inc. | 93,507 | 28.06 | 3 | 50.00 | ||||
| 2025-08-14 | 13F | Bank Of America Corp /de/ | 1 | 0 | ||||||
| 2025-07-10 | 13F | Sovran Advisors, LLC | 75,663 | 1,024.26 | 2,529 | 1,158.21 | ||||
| 2025-08-01 | 13F | Envestnet Asset Management Inc | 4,140,219 | 31.55 | 138,449 | 42.00 | ||||
| 2025-08-13 | 13F | Capital International Investors | 21,704 | -31.43 | 726 | -26.02 | ||||
| 2025-07-30 | 13F | Bleakley Financial Group, LLC | 94,682 | 52.48 | 3,166 | 64.64 | ||||
| 2025-08-11 | 13F | Nations Financial Group Inc, /ia/ /adv | 15,490 | 101.14 | 518 | 117.65 | ||||
| 2025-08-27 | 13F/A | Brinker Capital Investments, LLC | 6,385 | 214 | ||||||
| 2025-08-04 | 13F | Pensionmark Financial Group, Llc | 132,554 | 25.74 | 4,433 | 35.74 | ||||
| 2025-07-29 | 13F | Creekside Partners | 12,456 | 417 | ||||||
| 2025-08-14 | 13F | Mml Investors Services, Llc | 706,202 | 24.75 | 24 | 35.29 | ||||
| 2025-08-14 | 13F | Smartleaf Asset Management LLC | 336,809 | 13.43 | 11,263 | 22.43 | ||||
| 2025-08-12 | 13F | Global Retirement Partners, LLC | 9,683 | 289.81 | 324 | 319.48 | ||||
| 2025-07-16 | 13F | Owen LaRue, LLC | 22,420 | -48.80 | 750 | -44.76 | ||||
| 2025-07-16 | 13F | Independent Wealth Network Inc. | 25,006 | 18.18 | 836 | 27.63 | ||||
| 2025-07-16 | 13F | Dakota Wealth Management | 23,184 | -6.69 | 779 | 0.78 | ||||
| 2025-08-14 | 13F | Herold Advisors, Inc. | 18,220 | 609 | ||||||
| 2025-08-04 | 13F | Creative Financial Designs Inc /adv | 1,300 | 0.00 | 43 | 7.50 | ||||
| 2025-07-30 | 13F | Cullen/frost Bankers, Inc. | 155,280 | 41.37 | 5,193 | 52.62 | ||||
| 2025-08-04 | 13F | Assetmark, Inc | 22,668 | 758 | ||||||
| 2025-08-01 | 13F | Rossby Financial, LCC | 29 | 1 | ||||||
| 2025-07-17 | 13F | Greenbush Financial Group, LLC | 435,176 | 30.55 | 14,552 | 40.93 | ||||
| 2025-08-05 | 13F | Strategic Financial Concepts, LLC | 9,602 | -23.58 | 321 | -17.48 | ||||
| 2025-08-07 | 13F | Midwest Trust Co | 9,783 | 327 | ||||||
| 2025-07-14 | 13F | AdvisorNet Financial, Inc | 26,163 | 26.27 | 875 | 36.35 | ||||
| 2025-07-29 | 13F | Uhlmann Price Securities, Llc | 16,032 | 18.81 | 536 | 28.23 | ||||
| 2025-07-21 | 13F | Ameriflex Group, Inc. | 0 | -100.00 | 0 | |||||
| 2025-08-06 | 13F | Commonwealth Equity Services, Llc | 1,818,806 | -0.16 | 61 | 7.14 | ||||
| 2025-08-18 | 13F | N.E.W. Advisory Services LLC | 4,287 | -49.80 | 143 | -45.83 | ||||
| 2025-08-14 | 13F | Stifel Financial Corp | 439,413 | 56.41 | 14,694 | 68.84 | ||||
| 2025-07-29 | 13F | Stratos Wealth Partners, LTD. | 83,082 | 237.25 | 2,778 | 264.09 | ||||
| 2025-08-13 | 13F | Rockport Wealth LLC | 0 | -100.00 | 0 | |||||
| 2025-07-23 | 13F | Armstrong, Fleming & Moore, Inc | 15,918 | 532 | ||||||
| 2025-08-14 | 13F | Ausdal Financial Partners, Inc. | 13,665 | 17.62 | 457 | 27.02 | ||||
| 2025-08-14 | 13F | Sunbelt Securities, Inc. | 156,919 | 0.29 | 4,907 | 1.22 | ||||
| 2025-08-18 | 13F | Geneos Wealth Management Inc. | 110,417 | 439.12 | 3,692 | 482.33 | ||||
| 2025-07-09 | 13F | Divergent Planning, LLC | 66,782 | 2,233 | ||||||
| 2025-07-30 | 13F/A | KPP Advisory Services LLC | 17,533 | 0.00 | 586 | 7.92 | ||||
| 2025-05-12 | 13F | Independent Advisor Alliance | 0 | -100.00 | 0 | |||||
| 2025-07-18 | 13F | Truist Financial Corp | 79,312 | 9.60 | 2,652 | 18.34 | ||||
| 2025-08-13 | 13F | Jones Financial Companies Lllp | 644,046 | 103.28 | 21,537 | 119.42 | ||||
| 2025-07-28 | 13F | Mutual Advisors, LLC | 32,788 | -11.04 | 1,113 | -1.85 | ||||
| 2025-08-14 | 13F | Acas, Llc | 127,742 | 9.35 | 4,353 | 19.92 | ||||
| 2025-08-08 | 13F | Davies Financial Advisors, Inc. | 55,223 | -2.11 | 1,847 | 5.67 | ||||
| 2025-08-13 | 13F | Gateway Wealth Partners, LLC | 24,810 | 28.40 | 830 | 38.63 | ||||
| 2025-08-13 | 13F | Vermillion & White Wealth Management Group, LLC | 8,120 | 4.09 | 272 | 12.45 | ||||
| 2025-08-14 | 13F | Advisor OS, LLC | 19,521 | 1.50 | 653 | 9.58 | ||||
| 2025-07-22 | 13F | Confluence Wealth Services, Inc. | 271,820 | 3.49 | 9,090 | 14.30 | ||||
| 2025-07-25 | 13F | Envestnet Portfolio Solutions, Inc. | 85,501 | -54.70 | 2,859 | -51.10 | ||||
| 2025-08-06 | 13F | Mascagni Wealth Management, Inc. | 67,080 | -12.85 | 2,243 | -5.91 | ||||
| 2025-07-30 | 13F | D.a. Davidson & Co. | 263,062 | 11.33 | 8,797 | 20.16 | ||||
| 2025-07-24 | 13F | Endeavor Private Wealth, Inc. | 183,381 | 24.83 | 6,162 | 34.87 | ||||
| 2025-07-09 | 13F | StrongBox Wealth, LLC | 66,782 | 4.39 | 2,233 | 12.72 | ||||
| 2025-08-04 | 13F | Savvy Advisors, Inc. | 6,069 | 203 | ||||||
| 2025-08-14 | 13F | Mariner, LLC | 560,777 | 6.75 | 18,752 | 15.22 | ||||
| 2025-07-29 | 13F | Nicholson Wealth Management Group, LLC | 6,392 | 214 | ||||||
| 2025-08-05 | 13F | Sigma Planning Corp | 100,967 | 35.03 | 3,376 | 45.77 | ||||
| 2025-08-13 | 13F | Fi3 FINANCIAL ADVISORS, LLC | 7,351 | 247 | ||||||
| 2025-08-13 | 13F | Northwestern Mutual Wealth Management Co | 22,545 | 194.24 | 754 | 217.72 | ||||
| 2025-07-18 | 13F | Vicus Capital | 16,578 | 61.47 | 554 | 74.21 | ||||
| 2025-08-05 | 13F | GPS Wealth Strategies Group, LLC | 49,010 | 26.71 | 1,639 | 36.73 | ||||
| 2025-08-08 | 13F | Capital Investment Advisory Services, LLC | 9,176 | 20.72 | 307 | 30.21 | ||||
| 2025-08-08 | 13F | Avantax Advisory Services, Inc. | 58,702 | 38.02 | 1,963 | 48.97 | ||||
| 2025-07-30 | 13F | Onyx Bridge Wealth Group LLC | 6,280 | 210 | ||||||
| 2025-08-07 | 13F | PCG Wealth Advisors, LLC | 0 | -100.00 | 0 | |||||
| 2025-08-12 | 13F | Wisconsin Wealth Advisors, LLC | 7,955 | 266 |