Mga Batayang Estadistika
| Pemilik Institusional | 99 total, 98 long only, 0 short only, 1 long/short - change of 6.38% MRQ |
| Alokasi Portofolio Rata-rata | 0.0143 % - change of -26.58% MRQ |
| Saham Institusional (Jangka Panjang) | 3,993,183 (ex 13D/G) - change of 0.56MM shares 16.21% MRQ |
| Nilai Institusional (Jangka Panjang) | $ 89,446 USD ($1000) |
Kepemilikan Institusional dan Pemegang Saham
Global X Funds - Global X Cloud Computing ETF (US:CLOU) memiliki 99 pemilik institusional dan pemegang saham yang telah mengajukan formulir 13D/G atau 13F kepada Komisi Bursa Efek (Securities Exchange Commission/SEC). Lembaga-lembaga ini memegang total 3,993,183 saham. Pemegang saham terbesar meliputi Morgan Stanley, UBS Group AG, Bank Of America Corp /de/, Two Sigma Investments, Lp, Mirae Asset Global Investments Co., Ltd., LPL Financial LLC, Wells Fargo & Company/mn, Raymond James Financial Inc, Clearwater Capital Advisors, LLC, and Royal Bank Of Canada .
Struktur kepemilikan institusional Global X Funds - Global X Cloud Computing ETF (NasdaqGM:CLOU) menunjukkan posisi terkini di perusahaan oleh institusi dan dana, serta perubahan terbaru dalam ukuran posisi. Pemegang saham utama dapat mencakup investor individu, reksa dana, dana lindung nilai, atau institusi. Jadwal 13D menunjukkan bahwa investor memegang (atau pernah memegang) lebih dari 5% saham perusahaan dan bermaksud (atau pernah bermaksud) untuk secara aktif mengejar perubahan strategi bisnis. Jadwal 13G menunjukkan investasi pasif lebih dari 5%.
The share price as of September 5, 2025 is 22.84 / share. Previously, on September 6, 2024, the share price was 19.02 / share. This represents an increase of 20.08% over that period.

Skor Sentimen Dana
Skor Sentimen Dana (sebelumnya dikenal sebagai Skor Akumulasi Kepemilikan) menemukan saham-saham yang paling banyak dibeli oleh dana. Ini adalah hasil dari model kuantitatif multi-faktor yang canggih yang mengidentifikasi perusahaan dengan tingkat akumulasi institusional tertinggi. Model penilaian menggunakan kombinasi dari total peningkatan pemilik yang diungkapkan, perubahan dalam alokasi portofolio pada pemilik tersebut, dan metrik lainnya. Angka berkisar dari 0 hingga 100, dengan angka yang lebih tinggi menunjukkan tingkat akumulasi yang lebih tinggi dibandingkan dengan perusahaan sejenisnya, dan 50 adalah rata-ratanya.
Frekuensi Pembaruan: Setiap Hari
Lihat Ownership Explorer, yang menyediakan daftar perusahaan dengan peringkat tertinggi.
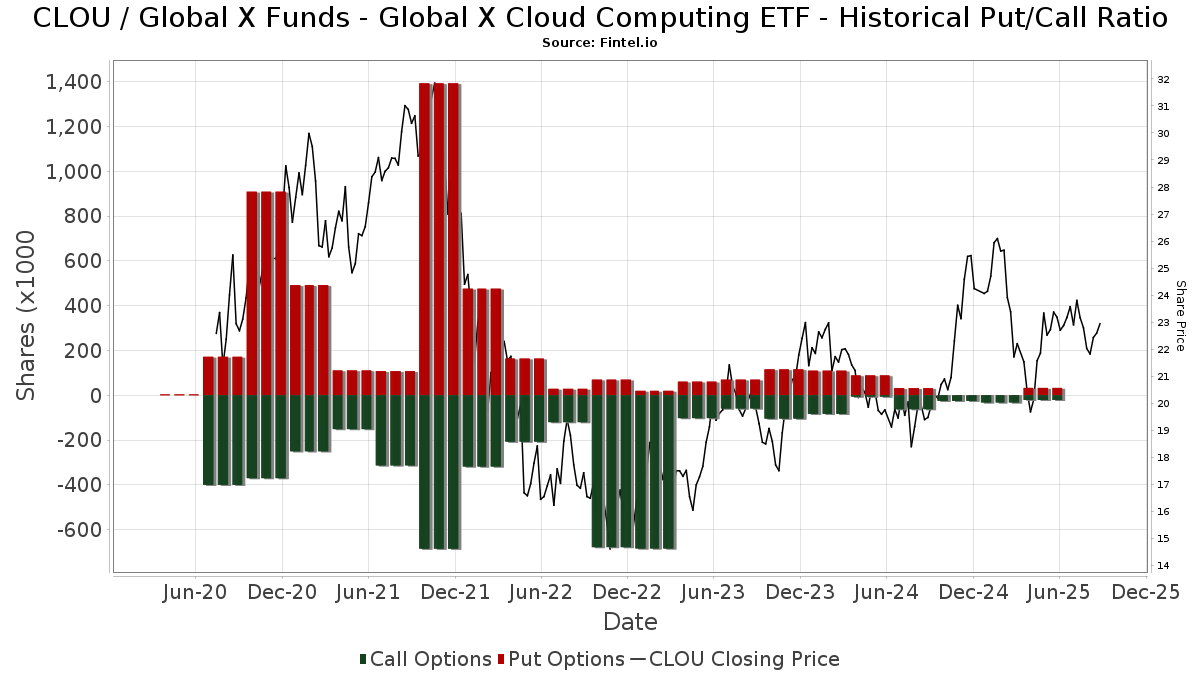
Rasio Put/Call Institusional
Selain melaporkan isu ekuitas dan utang standar, institusi dengan aset di bawah manajemen lebih dari 100 juta dolar AS juga harus mengungkapkan kepemilikan opsi put dan call mereka. Karena opsi put umumnya menunjukkan sentimen negatif, dan opsi call menunjukkan sentimen positif, kita dapat mengetahui sentimen institusional secara keseluruhan dengan memplot rasio put terhadap call. Grafik di sebelah kanan memplot rasio put/call historis untuk instrumen ini.
Menggunakan Rasio Put/Call sebagai indikator sentimen investor mengatasi salah satu kekurangan utama dari penggunaan total kepemilikan institusional, yaitu sejumlah besar aset yang dikelola diinvestasikan secara pasif untuk melacak indeks. Dana yang dikelola secara pasif biasanya tidak membeli opsi, sehingga indikator rasio put/call lebih akurat dalam melacak sentimen dana yang dikelola secara aktif.
Pengajuan 13F dan NPORT
Detail pada pengajuan 13F tersedia gratis. Detail pada pengajuan NP memerlukan keanggotaan premium. Baris berwarna hijau menunjukkan posisi baru. Baris berwarna merah menunjukkan posisi yang sudah ditutup. Klik tautan ini ikon untuk melihat riwayat transaksi selengkapnya.
Tingkatkan
untuk membuka data premium dan mengekspor ke Excel ![]() .
.
| Tanggal File | Sumber | Investor | Ketik | Presyo ng Avg (Silangan) |
Saham | Δ Saham (%) |
Dilaporkan Nilai ($1000) |
Nilai Δ (%) |
Alokasi Port (%) |
|
|---|---|---|---|---|---|---|---|---|---|---|
| 2025-08-08 | 13F | Pnc Financial Services Group, Inc. | 23,415 | 0.00 | 546 | 11.20 | ||||
| 2025-08-14 | 13F | Qube Research & Technologies Ltd | 35,482 | 66.09 | 828 | 84.60 | ||||
| 2025-08-08 | 13F | Gts Securities Llc | 9,575 | 223 | ||||||
| 2025-08-05 | 13F | Dunhill Financial, LLC | 199 | 0.00 | 5 | 0.00 | ||||
| 2025-08-12 | 13F | Jpmorgan Chase & Co | 4,994 | 1.63 | 117 | 12.62 | ||||
| 2025-07-17 | 13F | Archford Capital Strategies, LLC | 10,852 | -3.63 | 253 | 7.20 | ||||
| 2025-08-14 | 13F | Two Sigma Investments, Lp | 266,200 | 50.99 | 6,210 | 67.84 | ||||
| 2025-05-09 | 13F | GeoWealth Management, LLC | 0 | -100.00 | 0 | |||||
| 2025-08-14 | 13F | Sunbelt Securities, Inc. | 640 | 2.07 | 15 | 15.38 | ||||
| 2025-07-14 | 13F | Armstrong Advisory Group, Inc | 573 | 0.00 | 13 | 0.00 | ||||
| 2025-07-15 | 13F | James J. Burns & Company, LLC | 9,371 | 219 | ||||||
| 2025-08-11 | 13F | Principal Securities, Inc. | 77,766 | 13,962.57 | 1,814 | 13,853.85 | ||||
| 2025-07-31 | 13F | Oppenheimer & Co Inc | 49,134 | -8.46 | 1,146 | 1.78 | ||||
| 2025-08-14 | 13F | Ameriprise Financial Inc | 10,431 | 243 | ||||||
| 2025-08-12 | 13F | Clearwater Capital Advisors, LLC | 105,121 | -7.56 | 2,452 | 2.72 | ||||
| 2025-08-12 | 13F | Ameritas Investment Partners, Inc. | 5,850 | -1.10 | 136 | 9.68 | ||||
| 2025-07-31 | 13F | Cambridge Investment Research Advisors, Inc. | 18,719 | -3.56 | 0 | |||||
| 2025-08-14 | 13F | Glen Eagle Advisors, LLC | 150 | 0.00 | 4 | 0.00 | ||||
| 2025-08-12 | 13F | Main Management LLC | 409 | 0.00 | 0 | |||||
| 2025-08-14 | 13F | Cubist Systematic Strategies, LLC | 14,247 | 332 | ||||||
| 2025-08-13 | 13F | Beutel, Goodman & Co Ltd. | 270 | 0.00 | 0 | |||||
| 2025-07-08 | 13F | Parallel Advisors, LLC | 79 | 0.00 | 2 | 0.00 | ||||
| 2025-08-06 | 13F | Golden State Wealth Management, LLC | 500 | 0.00 | 12 | 10.00 | ||||
| 2025-08-12 | 13F | Park Square Financial Group, LLC | 600 | 0.00 | 14 | 8.33 | ||||
| 2025-08-08 | 13F | Capital Investment Advisory Services, LLC | 0 | -100.00 | 0 | |||||
| 2025-08-05 | 13F | Bank Of Montreal /can/ | 1,411 | 0.00 | 33 | 10.34 | ||||
| 2025-08-19 | 13F | Newbridge Financial Services Group, Inc. | 1,850 | -13.95 | 43 | -4.44 | ||||
| 2025-04-21 | 13F | Nelson, Van Denburg & Campbell Wealth Management Group, LLC | 0 | -100.00 | 0 | |||||
| 2025-08-14 | 13F | Citadel Advisors Llc | Put | 0 | -100.00 | 0 | ||||
| 2025-08-11 | 13F | HighTower Advisors, LLC | 13,976 | -14.18 | 326 | -4.40 | ||||
| 2025-07-22 | 13F | Coastal Investment Advisors, Inc. | 1,240 | 0.00 | 29 | 7.69 | ||||
| 2025-07-25 | 13F | Cwm, Llc | 40,069 | -0.57 | 1 | |||||
| 2025-08-06 | 13F | Commonwealth Equity Services, Llc | 27,135 | 4.78 | 1 | |||||
| 2025-07-28 | 13F | Harbour Investments, Inc. | 714 | -3.38 | 17 | 6.67 | ||||
| 2025-08-14 | 13F | Jane Street Group, Llc | 31,549 | 736 | ||||||
| 2025-07-21 | 13F | Ameritas Advisory Services, LLC | 7,497 | -36.13 | 175 | -38.08 | ||||
| 2025-07-17 | 13F | Global Trust Asset Management, LLC | 255 | 0.00 | 6 | 0.00 | ||||
| 2025-08-07 | 13F | Runnymede Capital Advisors, Inc. | 0 | -100.00 | 0 | |||||
| 2025-07-07 | 13F | Thurston, Springer, Miller, Herd & Titak, Inc. | 164 | 0.00 | 4 | 0.00 | ||||
| 2025-08-05 | 13F | Tsfg, Llc | 250 | 0.00 | 0 | |||||
| 2025-07-14 | 13F | UMA Financial Services, Inc. | 395 | 0.00 | 9 | 12.50 | ||||
| 2025-08-14 | 13F | Citadel Advisors Llc | Call | 11,200 | -65.64 | 261 | -61.84 | |||
| 2025-05-12 | 13F | Founders Financial Alliance, LLC | 0 | -100.00 | 0 | -100.00 | ||||
| 2025-08-08 | 13F | Cetera Investment Advisers | 34,014 | 2.54 | 794 | 13.94 | ||||
| 2025-08-14 | 13F | Fwl Investment Management, Llc | 280 | 0.00 | 7 | 20.00 | ||||
| 2025-08-13 | 13F | Flow Traders U.s. Llc | 38,007 | -61.44 | 1 | -100.00 | ||||
| 2025-08-14 | 13F | UBS Group AG | 606,080 | 2.51 | 14,140 | 13.94 | ||||
| 2025-07-24 | 13F | Us Bancorp \de\ | 200 | 0.00 | 5 | 0.00 | ||||
| 2025-08-07 | 13F | Sierra Ocean, Llc | 3,830 | 0.00 | 89 | 11.25 | ||||
| 2025-08-12 | 13F | Wood Tarver Financial Group, LLC | 4,114 | 0.00 | 0 | -100.00 | ||||
| 2025-08-11 | 13F | TD Waterhouse Canada Inc. | 27 | 0.00 | 1 | |||||
| 2025-08-14 | 13F | Bank Of America Corp /de/ | 553,640 | 2.46 | 12,916 | 13.89 | ||||
| 2025-07-18 | 13F | Pennsylvania Capital Management Inc /adv | 9,248 | -13.13 | 216 | -3.59 | ||||
| 2025-08-13 | 13F | Northwestern Mutual Wealth Management Co | 992 | -28.74 | 23 | -20.69 | ||||
| 2025-08-14 | 13F | Prestige Wealth Management Group LLC | 2,689 | -0.77 | 63 | 10.71 | ||||
| 2025-08-13 | 13F | Congress Wealth Management LLC / DE / | 40,965 | -1.61 | 956 | 9.27 | ||||
| 2025-08-15 | 13F | Tower Research Capital LLC (TRC) | 163 | 757.89 | 4 | |||||
| 2025-04-29 | 13F | Hm Payson & Co | 100 | 0.00 | 2 | 0.00 | ||||
| 2025-08-14 | 13F | Sei Investments Co | 8,946 | 209 | ||||||
| 2025-08-01 | 13F | Motco | 500 | 11 | ||||||
| 2025-08-13 | 13F | Marshall Wace, Llp | 10,501 | 245 | ||||||
| 2025-08-01 | 13F | Envestnet Asset Management Inc | 32,604 | 12.11 | 761 | 24.59 | ||||
| 2025-08-14 | 13F | Wells Fargo & Company/mn | 113,394 | -8.37 | 2,645 | 1.85 | ||||
| 2025-08-14 | 13F | Wiley Bros.-aintree Capital, Llc | 13,215 | 0.00 | 308 | 10.00 | ||||
| 2025-07-30 | 13F | Eqis Capital Management, Inc. | 16,971 | -0.70 | 396 | 10.34 | ||||
| 2025-08-12 | 13F | LPL Financial LLC | 217,543 | 8.28 | 5,075 | 20.35 | ||||
| 2025-08-14 | 13F | Old Mission Capital Llc | 48,332 | 1,128 | ||||||
| 2025-07-31 | 13F | CVA Family Office, LLC | 6,416 | 0.00 | 150 | 11.19 | ||||
| 2025-07-28 | 13F | Mowery & Schoenfeld Wealth Management, LLC | 245 | 0.00 | 6 | 0.00 | ||||
| 2025-08-14 | 13F | Raymond James Financial Inc | 112,323 | -18.33 | 2,620 | -9.22 | ||||
| 2025-09-04 | 13F/A | Advisor Group Holdings, Inc. | 44,209 | 90.29 | 1,030 | 111.50 | ||||
| 2025-08-11 | 13F | Aptus Capital Advisors, LLC | 703 | 0.00 | 16 | 14.29 | ||||
| 2025-07-30 | 13F | Insight Advisors, LLC/ PA | 21,536 | -10.91 | 502 | -0.99 | ||||
| 2025-04-30 | 13F | Bank Hapoalim Bm | 0 | -100.00 | 0 | |||||
| 2025-05-14 | 13F | BOK Financial Private Wealth, Inc. | 0 | -100.00 | 0 | |||||
| 2025-08-08 | 13F | Avantax Advisory Services, Inc. | 0 | -100.00 | 0 | |||||
| 2025-08-12 | 13F | CIBC Private Wealth Group, LLC | 102 | 2 | ||||||
| 2025-05-12 | 13F | Independent Advisor Alliance | 0 | -100.00 | 0 | |||||
| 2025-08-14 | 13F | Citadel Advisors Llc | 0 | -100.00 | 0 | |||||
| 2025-05-16 | 13F | Coppell Advisory Solutions LLC | 0 | -100.00 | 0 | |||||
| 2025-08-13 | 13F | Mount Yale Investment Advisors, LLC | 110 | 3 | ||||||
| 2025-07-11 | 13F | Farther Finance Advisors, LLC | 2 | 0.00 | 0 | |||||
| 2025-08-05 | 13F | Huntington National Bank | 51 | |||||||
| 2025-08-14 | 13F | Fmr Llc | 1,157 | 173.52 | 27 | 237.50 | ||||
| 2025-05-15 | 13F | Glenmede Trust Co Na | 1,301 | 0.00 | 27 | -12.90 | ||||
| 2025-08-14 | 13F | Comerica Bank | 0 | -100.00 | 0 | |||||
| 2025-07-21 | 13F | HighMark Wealth Management LLC | 25 | 0.00 | 1 | |||||
| 2025-08-12 | 13F | Proequities, Inc. | Put | 0 | 0 | |||||
| 2025-08-08 | 13F | Creative Planning | 0 | -100.00 | 0 | |||||
| 2025-08-12 | 13F | Global Retirement Partners, LLC | 128 | 3 | ||||||
| 2025-07-29 | 13F | Private Trust Co Na | 800 | 0.00 | 19 | 12.50 | ||||
| 2025-08-14 | 13F | Daiwa Securities Group Inc. | 20,000 | 0.00 | 0 | |||||
| 2025-08-14 | 13F | GWM Advisors LLC | 4,092 | 0.00 | 95 | 11.76 | ||||
| 2025-08-18 | 13F | Geneos Wealth Management Inc. | 2,200 | 0.00 | 51 | 10.87 | ||||
| 2025-08-14 | 13F | Colony Group, LLC | 19,424 | -5.13 | 453 | 5.59 | ||||
| 2025-05-15 | 13F | Running Point Capital Advisors, LLC | 0 | -100.00 | 0 | |||||
| 2025-08-29 | 13F | Centaurus Financial, Inc. | 5,181 | 5.91 | 0 | |||||
| 2025-08-11 | 13F | Citigroup Inc | 5,767 | 135 | ||||||
| 2025-08-11 | 13F | Oder Investment Management, LLC | 21,593 | 0.00 | 504 | 11.04 | ||||
| 2025-07-10 | 13F | Wealth Enhancement Advisory Services, Llc | 0 | -100.00 | 0 | |||||
| 2025-08-14 | 13F | Bnp Paribas Arbitrage, Sa | 67 | 26.42 | 2 | 0.00 | ||||
| 2025-07-21 | 13F | Mirae Asset Global Investments Co., Ltd. | 255,063 | -13.58 | 5,951 | -5.00 | ||||
| 2025-08-14 | 13F | AllSquare Wealth Management LLC | 1,290 | 0.00 | 30 | 11.11 | ||||
| 2025-08-14 | 13F | Federation des caisses Desjardins du Quebec | 15 | 0.00 | 0 | |||||
| 2025-08-04 | 13F | Creative Financial Designs Inc /adv | 2,296 | -8.31 | 54 | 1.92 | ||||
| 2025-08-15 | 13F | Morgan Stanley | 708,396 | 120.46 | 16,527 | 145.05 | ||||
| 2025-08-14 | 13F | Royal Bank Of Canada | 80,368 | 9.61 | 1,875 | 21.83 | ||||
| 2025-08-06 | 13F | AE Wealth Management LLC | 444 | 219.42 | 10 | 400.00 | ||||
| 2025-07-22 | 13F | Macroview Investment Management Llc | 11,141 | 0.00 | 260 | 11.16 | ||||
| 2025-08-14 | 13F | Susquehanna International Group, Llp | 56,805 | 3.83 | 1,325 | 15.42 | ||||
| 2025-08-14 | 13F | Susquehanna International Group, Llp | Call | 10,100 | 236 | |||||
| 2025-08-14 | 13F | Susquehanna International Group, Llp | Put | 33,700 | 786 | |||||
| 2025-08-15 | 13F | Kestra Advisory Services, LLC | 9,753 | 228 | ||||||
| 2025-08-11 | 13F | Banque Cantonale Vaudoise | 2,603 | 0.00 | 0 | |||||
| 2025-08-13 | 13F | Jones Financial Companies Lllp | 41,946 | 74.63 | 970 | 90.57 | ||||
| 2025-08-08 | 13F | SBI Securities Co., Ltd. | 6,659 | -1.80 | 155 | 9.15 | ||||
| 2025-08-11 | 13F | Blue Bell Private Wealth Management, Llc | 101 | -66.45 | 2 | -66.67 | ||||
| 2025-05-05 | 13F | Lindbrook Capital, Llc | 470 | 0.00 | 10 | -18.18 | ||||
| 2025-08-14 | 13F | Integrated Wealth Concepts LLC | 21,015 | 1.87 | 490 | 13.16 |
Other Listings
| MX:CLOU |