Mga Batayang Estadistika
| Pemilik Institusional | 90 total, 90 long only, 0 short only, 0 long/short - change of 12.50% MRQ |
| Alokasi Portofolio Rata-rata | 0.2896 % - change of -11.40% MRQ |
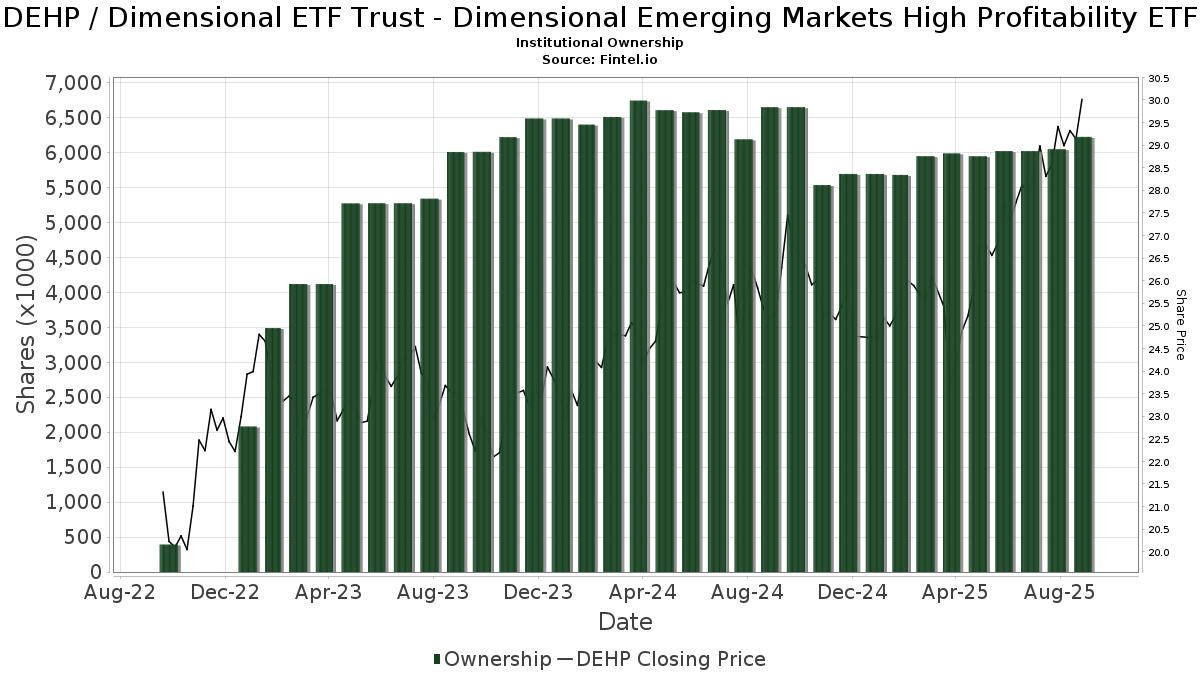
| Saham Institusional (Jangka Panjang) | 6,223,977 (ex 13D/G) - change of 0.20MM shares 3.38% MRQ |
| Nilai Institusional (Jangka Panjang) | $ 160,753 USD ($1000) |
Kepemilikan Institusional dan Pemegang Saham
Dimensional ETF Trust - Dimensional Emerging Markets High Profitability ETF (US:DEHP) memiliki 90 pemilik institusional dan pemegang saham yang telah mengajukan formulir 13D/G atau 13F kepada Komisi Bursa Efek (Securities Exchange Commission/SEC). Lembaga-lembaga ini memegang total 6,223,977 saham. Pemegang saham terbesar meliputi Unison Advisors LLC, Vestmark Advisory Solutions, Inc., Beacon Pointe Advisors, LLC, RFG Advisory, LLC, von Borstel & Associates, Inc., DiNuzzo Private Wealth, Inc., SPILX - Symmetry Panoramic International Equity Fund Class I Shares, Fortress Wealth Management, Inc., United Wealth Management, LLC, and GWM Advisors LLC .
Struktur kepemilikan institusional Dimensional ETF Trust - Dimensional Emerging Markets High Profitability ETF (ARCA:DEHP) menunjukkan posisi terkini di perusahaan oleh institusi dan dana, serta perubahan terbaru dalam ukuran posisi. Pemegang saham utama dapat mencakup investor individu, reksa dana, dana lindung nilai, atau institusi. Jadwal 13D menunjukkan bahwa investor memegang (atau pernah memegang) lebih dari 5% saham perusahaan dan bermaksud (atau pernah bermaksud) untuk secara aktif mengejar perubahan strategi bisnis. Jadwal 13G menunjukkan investasi pasif lebih dari 5%.
The share price as of September 5, 2025 is 29.39 / share. Previously, on September 9, 2024, the share price was 25.12 / share. This represents an increase of 16.99% over that period.
Skor Sentimen Dana
Skor Sentimen Dana (sebelumnya dikenal sebagai Skor Akumulasi Kepemilikan) menemukan saham-saham yang paling banyak dibeli oleh dana. Ini adalah hasil dari model kuantitatif multi-faktor yang canggih yang mengidentifikasi perusahaan dengan tingkat akumulasi institusional tertinggi. Model penilaian menggunakan kombinasi dari total peningkatan pemilik yang diungkapkan, perubahan dalam alokasi portofolio pada pemilik tersebut, dan metrik lainnya. Angka berkisar dari 0 hingga 100, dengan angka yang lebih tinggi menunjukkan tingkat akumulasi yang lebih tinggi dibandingkan dengan perusahaan sejenisnya, dan 50 adalah rata-ratanya.
Frekuensi Pembaruan: Setiap Hari
Lihat Ownership Explorer, yang menyediakan daftar perusahaan dengan peringkat tertinggi.
Rasio Put/Call Institusional
Selain melaporkan isu ekuitas dan utang standar, institusi dengan aset di bawah manajemen lebih dari 100 juta dolar AS juga harus mengungkapkan kepemilikan opsi put dan call mereka. Karena opsi put umumnya menunjukkan sentimen negatif, dan opsi call menunjukkan sentimen positif, kita dapat mengetahui sentimen institusional secara keseluruhan dengan memplot rasio put terhadap call. Grafik di sebelah kanan memplot rasio put/call historis untuk instrumen ini.
Menggunakan Rasio Put/Call sebagai indikator sentimen investor mengatasi salah satu kekurangan utama dari penggunaan total kepemilikan institusional, yaitu sejumlah besar aset yang dikelola diinvestasikan secara pasif untuk melacak indeks. Dana yang dikelola secara pasif biasanya tidak membeli opsi, sehingga indikator rasio put/call lebih akurat dalam melacak sentimen dana yang dikelola secara aktif.
Pengajuan 13F dan NPORT
Detail pada pengajuan 13F tersedia gratis. Detail pada pengajuan NP memerlukan keanggotaan premium. Baris berwarna hijau menunjukkan posisi baru. Baris berwarna merah menunjukkan posisi yang sudah ditutup. Klik tautan ini ikon untuk melihat riwayat transaksi selengkapnya.
Tingkatkan
untuk membuka data premium dan mengekspor ke Excel ![]() .
.
| Tanggal File | Sumber | Investor | Ketik | Presyo ng Avg (Silangan) |
Saham | Δ Saham (%) |
Dilaporkan Nilai ($1000) |
Nilai Δ (%) |
Alokasi Port (%) |
|
|---|---|---|---|---|---|---|---|---|---|---|
| 2025-04-29 | 13F | Hm Payson & Co | 33,892 | 1.10 | 855 | 3.02 | ||||
| 2025-07-11 | 13F | Farther Finance Advisors, LLC | 815 | 0.00 | 23 | 10.00 | ||||
| 2025-08-13 | 13F | SageView Advisory Group, LLC | 8,386 | -1.87 | 238 | 10.70 | ||||
| 2025-08-29 | 13F | Total Investment Management Inc | 86 | 2 | ||||||
| 2025-04-16 | 13F | Lam Group, Inc. | 0 | -100.00 | 0 | -100.00 | ||||
| 2025-07-28 | 13F | RCS Financial Planning, LLC | 13,995 | -27.00 | 392 | -19.05 | ||||
| 2025-05-08 | 13F | Altiora Financial Group, LLC | 0 | -100.00 | 0 | |||||
| 2025-07-14 | 13F | Maryland Capital Advisors Inc. | 11,273 | 20.76 | 316 | 34.04 | ||||
| 2025-07-17 | 13F | Applied Capital LLC | 57,800 | -16.90 | 1,618 | -7.75 | ||||
| 2025-07-15 | 13F | Vestment Financial LLC | 10,471 | 0.03 | 294 | 10.53 | ||||
| 2025-08-06 | 13F | AE Wealth Management LLC | 2,176 | 61 | ||||||
| 2025-08-13 | 13F | Jones Financial Companies Lllp | 1,040 | 29 | ||||||
| 2025-08-15 | 13F | Kestra Advisory Services, LLC | 33,252 | 2.94 | 931 | 14.37 | ||||
| 2025-08-14 | 13F | Great Valley Advisor Group, Inc. | 7,387 | 207 | ||||||
| 2025-05-12 | 13F | Hantz Financial Services, Inc. | 0 | -100.00 | 0 | |||||
| 2025-08-06 | 13F | Vestmark Advisory Solutions, Inc. | 449,820 | 107.23 | 12,595 | 130.07 | ||||
| 2025-07-28 | NP | SPGTX - Symmetry Panoramic Tax Managed Global Equity Fund Class I Shares | 54,475 | 0.00 | 1,433 | 5.45 | ||||
| 2025-05-12 | 13F | Fmr Llc | 0 | -100.00 | 0 | |||||
| 2025-07-23 | 13F | Pillar Financial Advisors, LLC | 915 | 0.00 | 26 | 8.70 | ||||
| 2025-08-07 | 13F | Allworth Financial LP | 1,680 | -5.46 | 47 | 6.82 | ||||
| 2025-08-12 | 13F | Tableaux Llc | 0 | -100.00 | 0 | |||||
| 2025-07-29 | 13F | Two West Capital Advisors LLC | 19,399 | 1.02 | 556 | 19.61 | ||||
| 2025-08-14 | 13F | UBS Group AG | 8,792 | 25.60 | 246 | 39.77 | ||||
| 2025-08-01 | 13F | Envestnet Asset Management Inc | 139,655 | 6.10 | 3,910 | 17.81 | ||||
| 2025-08-13 | 13F | M Holdings Securities, Inc. | 30,171 | 1 | ||||||
| 2025-08-14 | 13F/A | Skopos Labs, Inc. | 3,051 | 85 | ||||||
| 2025-08-13 | 13F | GeoWealth Management, LLC | 0 | -100.00 | 0 | |||||
| 2025-08-11 | 13F | Principal Securities, Inc. | 76 | 0.00 | 2 | 100.00 | ||||
| 2025-08-06 | 13F | Savant Capital, LLC | 68,211 | -14.81 | 1,910 | -5.45 | ||||
| 2025-08-12 | 13F | Jpmorgan Chase & Co | 58,521 | -15.15 | 1,639 | -5.81 | ||||
| 2025-07-14 | 13F | Park Avenue Securities Llc | 68,955 | 76.59 | 2 | |||||
| 2025-07-24 | 13F | Wealth Advisors Northwest LLC | 86,939 | 1.61 | 2,434 | 12.84 | ||||
| 2025-07-25 | 13F | Sequoia Financial Advisors, LLC | 78,388 | -9.82 | 2,195 | 0.09 | ||||
| 2025-08-05 | 13F | Arrowroot Family Office, LLC | 8,579 | 0.86 | 240 | 14.29 | ||||
| 2025-08-14 | 13F | Integrated Wealth Concepts LLC | 31,572 | 0.74 | 884 | 11.90 | ||||
| 2025-07-28 | NP | SPILX - Symmetry Panoramic International Equity Fund Class I Shares | 193,506 | -14.02 | 5,089 | -9.32 | ||||
| 2025-08-12 | 13F | O'shaughnessy Asset Management, Llc | 0 | -100.00 | 0 | |||||
| 2025-07-22 | 13F | Firethorn Wealth Partners, Llc | 13,387 | -4.12 | 375 | 6.25 | ||||
| 2025-08-01 | 13F | Austin Private Wealth, LLC | 14,178 | 14.89 | 397 | 27.33 | ||||
| 2025-08-11 | 13F | Citigroup Inc | 6,292 | -3.13 | 176 | 7.98 | ||||
| 2025-08-14 | 13F | Envision Financial Planning, LLC | 29,651 | 830 | ||||||
| 2025-08-12 | 13F | LPL Financial LLC | 16,804 | 12.20 | 471 | 24.67 | ||||
| 2025-08-14 | 13F | Jane Street Group, Llc | 125,465 | 37.59 | 3,513 | 52.81 | ||||
| 2025-07-10 | 13F | Fortress Wealth Management, Inc. | 162,462 | 5.50 | 4,549 | 17.13 | ||||
| 2025-08-14 | 13F | Old Mission Capital Llc | 10,963 | 307 | ||||||
| 2025-08-11 | 13F | HighTower Advisors, LLC | 30,428 | 0.00 | 852 | 10.95 | ||||
| 2025-07-15 | 13F | Evanson Asset Management, LLC | 40,815 | 0.52 | 1,143 | 11.63 | ||||
| 2025-08-11 | 13F | Ritter Daniher Financial Advisory LLC / DE | 6 | 0 | ||||||
| 2025-08-12 | 13F | Steward Partners Investment Advisory, Llc | 400 | 0.00 | 11 | 10.00 | ||||
| 2025-08-14 | 13F | GWM Advisors LLC | 154,701 | -4.82 | 4,332 | 5.66 | ||||
| 2025-08-13 | 13F | Daner Wealth Management, LLC | 11,728 | -7.04 | 340 | 6.27 | ||||
| 2025-08-12 | 13F | Cowa, Llc | 7,909 | 221 | ||||||
| 2025-08-14 | 13F | Goldman Sachs Group Inc | 0 | -100.00 | 0 | |||||
| 2025-07-22 | 13F | Wealthcare Advisory Partners LLC | 23,989 | 17.52 | 672 | 30.54 | ||||
| 2025-07-21 | 13F | Yeomans Consulting Group, Inc. | 56,467 | 5.78 | 1,582 | 17.46 | ||||
| 2025-07-23 | 13F | Sax Wealth Advisors, Llc | 10,873 | -1.63 | 304 | 9.35 | ||||
| 2025-07-16 | 13F | Meredith Wealth Planning | 95,802 | 8.31 | 2,682 | 20.27 | ||||
| 2025-08-08 | 13F | Pinney & Scofield, Inc. | 15,385 | -2.20 | 431 | 8.59 | ||||
| 2025-08-14 | 13F | Wells Fargo & Company/mn | 874 | 24 | ||||||
| 2025-07-14 | 13F | UMA Financial Services, Inc. | 2,751 | 0.00 | 77 | 11.59 | ||||
| 2025-04-17 | 13F | Retirement Solution Inc. | 0 | -100.00 | 0 | -100.00 | ||||
| 2025-08-07 | 13F | Resources Investment Advisors, LLC. | 42,620 | 5.45 | 1,193 | 17.08 | ||||
| 2025-08-14 | 13F | Bank Of America Corp /de/ | 49,972 | 8.76 | 1,399 | 20.81 | ||||
| 2025-07-29 | 13F | Schubert & Co | 29,144 | -32.47 | 816 | -25.00 | ||||
| 2025-07-18 | 13F | Truist Financial Corp | 13,246 | 2.13 | 371 | 13.15 | ||||
| 2025-08-14 | 13F | Betterment LLC | 53,737 | -4.04 | 2 | 0.00 | ||||
| 2025-08-13 | 13F | Beacon Pointe Advisors, LLC | 345,990 | -9.68 | 9,688 | 0.28 | ||||
| 2025-07-29 | 13F | Unison Advisors LLC | 1,271,042 | 0.61 | 35,589 | 11.70 | ||||
| 2025-08-06 | 13F | Commonwealth Equity Services, Llc | 40,060 | -66.91 | 1 | -66.67 | ||||
| 2025-08-14 | 13F | Citadel Advisors Llc | 0 | -100.00 | 0 | |||||
| 2025-08-14 | 13F | Raymond James Financial Inc | 795 | 22 | ||||||
| 2025-05-08 | 13F | IFG Advisory, LLC | 0 | -100.00 | 0 | |||||
| 2025-08-14 | 13F | Royal Bank Of Canada | 3,402 | 74.28 | 95 | 93.88 | ||||
| 2025-08-13 | 13F | Summit Wealth Group Llc / Co | 59,352 | 1,662 | ||||||
| 2025-07-29 | 13F | Chicago Partners Investment Group LLC | 136,103 | 1.13 | 3,944 | 13.53 | ||||
| 2025-07-30 | 13F | Rehmann Capital Advisory Group | 11,272 | 7.30 | 316 | 19.32 | ||||
| 2025-08-14 | 13F | Comerica Bank | 120 | -6.25 | 3 | 0.00 | ||||
| 2025-08-14 | 13F | Acorn Wealth Advisors, LLC | 11,073 | 13.17 | 310 | 26.02 | ||||
| 2025-07-28 | 13F | RFG Advisory, LLC | 287,928 | -1.48 | 8,062 | 9.38 | ||||
| 2025-08-12 | 13F | Quadcap Wealth Management, LLC | 150,436 | -10.23 | 4,212 | -0.33 | ||||
| 2025-07-10 | 13F | Pacific Asset Management, LLC | 12,313 | 0.57 | 345 | 11.69 | ||||
| 2025-07-31 | 13F | Glass Jacobson Investment Advisors llc | 14,634 | -16.93 | 410 | -5.98 | ||||
| 2025-08-13 | 13F | United Wealth Management, LLC | 162,045 | 2.82 | 4,537 | 14.17 | ||||
| 2025-08-13 | 13F | Millstone Evans Group, LLC | 634 | -64.22 | 18 | -61.36 | ||||
| 2025-07-17 | 13F | DiNuzzo Private Wealth, Inc. | 235,741 | 3.40 | 6,601 | 14.80 | ||||
| 2025-07-30 | 13F | Mills Wealth Advisors LLC | 49,520 | 20.60 | 1,387 | 33.91 | ||||
| 2025-08-12 | 13F | Proequities, Inc. | 0 | 0 | ||||||
| 2025-08-04 | 13F | Integrity Alliance, Llc. | 104,017 | 0.09 | 2,912 | 11.15 | ||||
| 2025-08-08 | 13F | Capital Investment Advisory Services, LLC | 7,359 | 24.18 | 206 | 38.26 | ||||
| 2025-08-27 | 13F/A | Brinker Capital Investments, LLC | 48,234 | 449.55 | 1,351 | 510.86 | ||||
| 2025-07-24 | 13F | IFP Advisors, Inc | 32 | -54.93 | 1 | -100.00 | ||||
| 2025-05-15 | 13F/A | Orion Portfolio Solutions, LLC | 8,777 | 221 | ||||||
| 2025-07-28 | NP | SPGEX - Symmetry Panoramic Global Equity Fund Class I Shares | 122,990 | 0.00 | 3,235 | 5.45 | ||||
| 2025-07-23 | 13F | Abel Hall, LLC | 57,886 | -0.82 | 1,621 | 10.05 | ||||
| 2025-08-11 | 13F | TAGStone Capital, Inc. | 8,621 | 248 | ||||||
| 2025-07-22 | 13F | Sutton Place Investors Llc | 19,853 | 36.06 | 556 | 51.23 | ||||
| 2025-08-08 | 13F | Tortoise Investment Management, LLC | 41,775 | -4.33 | 1,170 | 6.18 | ||||
| 2025-08-07 | 13F | Alpha Financial Advisors, LLC | 51,705 | -9.87 | 1,448 | 0.07 | ||||
| 2025-05-15 | 13F | Morgan Stanley | 0 | -100.00 | 0 | -100.00 | ||||
| 2025-08-07 | 13F | Sollinda Capital Management LLC | 13,459 | 22.61 | 377 | 36.23 | ||||
| 2025-08-11 | 13F | von Borstel & Associates, Inc. | 267,984 | 2.88 | 8 | 16.67 | ||||
| 2025-08-11 | 13F | Wealthspire Advisors, LLC | 107,979 | -9.31 | 3,023 | 0.70 | ||||
| 2025-09-04 | 13F/A | Advisor Group Holdings, Inc. | 67,519 | -26.52 | 1,891 | -18.42 |