Mga Batayang Estadistika
| Pemilik Institusional | 93 total, 92 long only, 0 short only, 1 long/short - change of -2.08% MRQ |
| Alokasi Portofolio Rata-rata | 0.0716 % - change of -11.13% MRQ |
| Saham Institusional (Jangka Panjang) | 6,196,260 (ex 13D/G) - change of -0.37MM shares -5.68% MRQ |
| Nilai Institusional (Jangka Panjang) | $ 519,658 USD ($1000) |
Kepemilikan Institusional dan Pemegang Saham
Invesco Exchange-Traded Fund Trust II - Invesco Dorsey Wright SmallCap Momentum ETF (US:DWAS) memiliki 93 pemilik institusional dan pemegang saham yang telah mengajukan formulir 13D/G atau 13F kepada Komisi Bursa Efek (Securities Exchange Commission/SEC). Lembaga-lembaga ini memegang total 6,196,260 saham. Pemegang saham terbesar meliputi Wealth Enhancement Advisory Services, Llc, Morgan Stanley, Bank Of America Corp /de/, LPL Financial LLC, Bank Of America Corp /de/, Royal Bank Of Canada, UBS Group AG, Wells Fargo & Company/mn, Raymond James Financial Inc, and Goldman Sachs Group Inc .
Struktur kepemilikan institusional Invesco Exchange-Traded Fund Trust II - Invesco Dorsey Wright SmallCap Momentum ETF (NasdaqGM:DWAS) menunjukkan posisi terkini di perusahaan oleh institusi dan dana, serta perubahan terbaru dalam ukuran posisi. Pemegang saham utama dapat mencakup investor individu, reksa dana, dana lindung nilai, atau institusi. Jadwal 13D menunjukkan bahwa investor memegang (atau pernah memegang) lebih dari 5% saham perusahaan dan bermaksud (atau pernah bermaksud) untuk secara aktif mengejar perubahan strategi bisnis. Jadwal 13G menunjukkan investasi pasif lebih dari 5%.
The share price as of September 5, 2025 is 89.41 / share. Previously, on September 9, 2024, the share price was 85.73 / share. This represents an increase of 4.29% over that period.

Skor Sentimen Dana
Skor Sentimen Dana (sebelumnya dikenal sebagai Skor Akumulasi Kepemilikan) menemukan saham-saham yang paling banyak dibeli oleh dana. Ini adalah hasil dari model kuantitatif multi-faktor yang canggih yang mengidentifikasi perusahaan dengan tingkat akumulasi institusional tertinggi. Model penilaian menggunakan kombinasi dari total peningkatan pemilik yang diungkapkan, perubahan dalam alokasi portofolio pada pemilik tersebut, dan metrik lainnya. Angka berkisar dari 0 hingga 100, dengan angka yang lebih tinggi menunjukkan tingkat akumulasi yang lebih tinggi dibandingkan dengan perusahaan sejenisnya, dan 50 adalah rata-ratanya.
Frekuensi Pembaruan: Setiap Hari
Lihat Ownership Explorer, yang menyediakan daftar perusahaan dengan peringkat tertinggi.
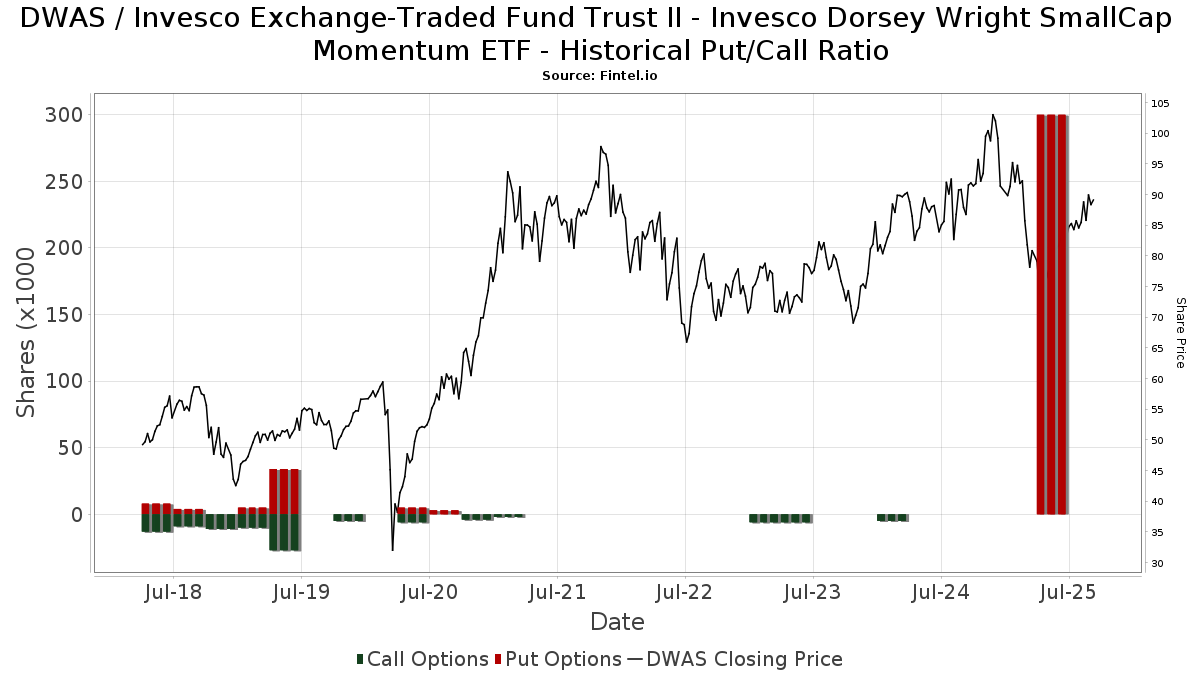
Rasio Put/Call Institusional
Selain melaporkan isu ekuitas dan utang standar, institusi dengan aset di bawah manajemen lebih dari 100 juta dolar AS juga harus mengungkapkan kepemilikan opsi put dan call mereka. Karena opsi put umumnya menunjukkan sentimen negatif, dan opsi call menunjukkan sentimen positif, kita dapat mengetahui sentimen institusional secara keseluruhan dengan memplot rasio put terhadap call. Grafik di sebelah kanan memplot rasio put/call historis untuk instrumen ini.
Menggunakan Rasio Put/Call sebagai indikator sentimen investor mengatasi salah satu kekurangan utama dari penggunaan total kepemilikan institusional, yaitu sejumlah besar aset yang dikelola diinvestasikan secara pasif untuk melacak indeks. Dana yang dikelola secara pasif biasanya tidak membeli opsi, sehingga indikator rasio put/call lebih akurat dalam melacak sentimen dana yang dikelola secara aktif.
Pengajuan 13F dan NPORT
Detail pada pengajuan 13F tersedia gratis. Detail pada pengajuan NP memerlukan keanggotaan premium. Baris berwarna hijau menunjukkan posisi baru. Baris berwarna merah menunjukkan posisi yang sudah ditutup. Klik tautan ini ikon untuk melihat riwayat transaksi selengkapnya.
Tingkatkan
untuk membuka data premium dan mengekspor ke Excel ![]() .
.
| Tanggal File | Sumber | Investor | Ketik | Presyo ng Avg (Silangan) |
Saham | Δ Saham (%) |
Dilaporkan Nilai ($1000) |
Nilai Δ (%) |
Alokasi Port (%) |
|
|---|---|---|---|---|---|---|---|---|---|---|
| 2025-04-21 | 13F | Nelson, Van Denburg & Campbell Wealth Management Group, LLC | 0 | -100.00 | 0 | |||||
| 2025-07-17 | 13F | Janney Montgomery Scott LLC | 25,932 | -4.71 | 2 | 0.00 | ||||
| 2025-07-22 | 13F | Belpointe Asset Management LLC | 2,411 | 205 | ||||||
| 2025-08-14 | 13F | Mercer Global Advisors Inc /adv | 3,728 | -16.19 | 316 | -8.67 | ||||
| 2025-04-23 | 13F | Pinnacle Bancorp, Inc. | 0 | -100.00 | 0 | |||||
| 2025-08-13 | 13F | Flow Traders U.s. Llc | 3,706 | -26.90 | 0 | |||||
| 2025-05-14 | 13F | Kestra Advisory Services, LLC | 0 | -100.00 | 0 | |||||
| 2025-08-12 | 13F | Global Retirement Partners, LLC | 37 | 0.00 | 3 | 0.00 | ||||
| 2025-08-14 | 13F | Goldman Sachs Group Inc | 91,386 | 89.87 | 7,755 | 106.63 | ||||
| 2025-08-06 | 13F | Prospera Financial Services Inc | 32,015 | 11.22 | 2,717 | 21.08 | ||||
| 2025-08-14 | 13F | IHT Wealth Management, LLC | 4,680 | -65.97 | 397 | -62.97 | ||||
| 2025-05-12 | 13F | Independent Advisor Alliance | 0 | -100.00 | 0 | |||||
| 2025-08-14 | 13F | Aqr Capital Management Llc | 5,655 | 53.04 | 480 | 66.32 | ||||
| 2025-07-16 | 13F | Register Financial Advisors LLC | 0 | -100.00 | 0 | |||||
| 2025-04-15 | 13F | Simplicity Wealth,LLC | 0 | -100.00 | 0 | |||||
| 2025-07-10 | 13F | Wealth Enhancement Advisory Services, Llc | 4,154,304 | -1.16 | 357,353 | 9.03 | ||||
| 2025-08-12 | 13F | BlackRock, Inc. | 3,024 | -10.05 | 257 | -2.29 | ||||
| 2025-08-15 | 13F | Tower Research Capital LLC (TRC) | 0 | -100.00 | 0 | |||||
| 2025-08-08 | 13F | MTM Investment Management, LLC | 2,329 | 0.00 | 198 | 9.44 | ||||
| 2025-08-14 | 13F | UBS Group AG | 141,263 | 25.05 | 11,988 | 36.08 | ||||
| 2025-08-14 | 13F | Mml Investors Services, Llc | 12,137 | -18.84 | 1 | 0.00 | ||||
| 2025-07-11 | 13F | Farther Finance Advisors, LLC | 16,702 | -9.09 | 1,417 | -0.63 | ||||
| 2025-08-19 | 13F | Newbridge Financial Services Group, Inc. | 430 | 0.00 | 36 | 9.09 | ||||
| 2025-08-04 | 13F | Assetmark, Inc | 221 | 8.33 | 19 | 20.00 | ||||
| 2025-07-28 | 13F | Harbour Investments, Inc. | 377 | -74.63 | 32 | -73.04 | ||||
| 2025-04-28 | 13F | Private Trust Co Na | 0 | -100.00 | 0 | |||||
| 2025-07-22 | 13F | Partners Wealth Management, Llc | 5,448 | -4.39 | 423 | -4.95 | ||||
| 2025-07-31 | 13F | LJI Wealth Management, LLC | 0 | -100.00 | 0 | |||||
| 2025-08-12 | 13F | Nemes Rush Group LLC | 5,392 | -36.30 | 458 | -30.76 | ||||
| 2025-08-06 | 13F | Centerpoint Advisory Group | 0 | -100.00 | 0 | |||||
| 2025-04-07 | 13F | AdvisorNet Financial, Inc | 0 | -100.00 | 0 | |||||
| 2025-07-30 | 13F | Family Capital Trust Co | 55,312 | 0.46 | 4,694 | 9.34 | ||||
| 2025-07-22 | 13F | Coastal Investment Advisors, Inc. | 200 | -89.22 | 17 | -88.89 | ||||
| 2025-08-14 | 13F | GWM Advisors LLC | 3,390 | -17.82 | 288 | -10.59 | ||||
| 2025-08-04 | 13F | Spire Wealth Management | 1,785 | -6.05 | 151 | 2.03 | ||||
| 2025-05-09 | 13F | Thoroughbred Financial Services, Llc | 0 | -100.00 | 0 | |||||
| 2025-07-22 | 13F | Strid Group, LLC | 4,007 | 0.02 | 340 | 8.65 | ||||
| 2025-07-31 | 13F | Oppenheimer & Co Inc | 16,784 | -18.10 | 1,424 | -10.89 | ||||
| 2025-08-18 | 13F/A | National Bank Of Canada /fi/ | 2,550 | 0.00 | 217 | 9.09 | ||||
| 2025-05-12 | 13F | Blueprint Investment Partners LLC | 0 | -100.00 | 0 | |||||
| 2025-08-04 | 13F | Atria Investments Llc | 21,321 | -51.27 | 1,809 | -46.97 | ||||
| 2025-08-14 | 13F/A | Barclays Plc | 300 | 0.00 | 0 | |||||
| 2025-05-12 | 13F | Founders Financial Alliance, LLC | 0 | -100.00 | 0 | -100.00 | ||||
| 2025-08-14 | 13F | Fwl Investment Management, Llc | 332 | 0.00 | 28 | 12.00 | ||||
| 2025-04-22 | 13F | Synergy Financial Management, LLC | 0 | -100.00 | 0 | |||||
| 2025-07-30 | 13F | Nottingham Advisors, Inc. | 13,149 | 0.00 | 1,116 | 8.78 | ||||
| 2025-07-22 | 13F | Red Tortoise LLC | 255 | 22 | ||||||
| 2025-07-24 | 13F | IFP Advisors, Inc | 3,436 | 28.74 | 292 | 39.90 | ||||
| 2025-08-14 | 13F | Great Valley Advisor Group, Inc. | 3,116 | 13.64 | 264 | 23.94 | ||||
| 2025-08-12 | 13F | Jpmorgan Chase & Co | 946 | 951.11 | 80 | 1,042.86 | ||||
| 2025-08-14 | 13F | Raymond James Financial Inc | 92,603 | -57.55 | 7,858 | -53.80 | ||||
| 2025-08-07 | 13F | Vise Technologies, Inc. | 43,258 | 28.07 | 3,671 | 19.04 | ||||
| 2025-08-14 | 13F | Citadel Advisors Llc | 4,022 | -68.12 | 341 | -65.31 | ||||
| 2025-08-13 | 13F | Scotia Capital Inc. | 3,557 | 0.00 | 302 | 8.66 | ||||
| 2025-08-12 | 13F | Steward Partners Investment Advisory, Llc | 2,579 | 0.00 | 219 | 8.46 | ||||
| 2025-08-14 | 13F | Snowden Capital Advisors LLC | 15,954 | -5.83 | 1,354 | 2.42 | ||||
| 2025-07-17 | 13F | Fifth Third Securities, Inc. | 0 | -100.00 | 0 | |||||
| 2025-08-14 | 13F | Wells Fargo & Company/mn | 135,511 | -32.47 | 11,500 | -26.52 | ||||
| 2025-08-01 | 13F | Bessemer Group Inc | 432 | 0 | ||||||
| 2025-07-09 | 13F | Dynamic Advisor Solutions LLC | 0 | -100.00 | 0 | |||||
| 2025-07-10 | 13F | Kmg Fiduciary Partners, Llc | 26,650 | 13.18 | 2,262 | 23.15 | ||||
| 2025-08-14 | 13F | Bank Of America Corp /de/ | Put | 300,000 | 25,458 | |||||
| 2025-08-01 | 13F | Envestnet Asset Management Inc | 15,004 | -21.43 | 1,273 | -14.51 | ||||
| 2025-07-10 | 13F | NorthCrest Asset Manangement, LLC | 15,044 | 29.96 | 1,294 | 43.46 | ||||
| 2025-07-15 | 13F | Financial Partners Group, Inc | 7,474 | -0.01 | 634 | 8.93 | ||||
| 2025-07-24 | 13F | Capital Advisors, Ltd. LLC | 0 | -100.00 | 0 | |||||
| 2025-08-13 | 13F | Jones Financial Companies Lllp | 476 | 32.59 | 40 | 48.15 | ||||
| 2025-08-14 | 13F | Bank Of America Corp /de/ | 144,875 | -1.19 | 12,294 | 7.53 | ||||
| 2025-08-14 | 13F | Mariner, LLC | 2,427 | 206 | ||||||
| 2025-04-25 | 13F | Kendall Capital Management | 0 | -100.00 | 0 | |||||
| 2025-08-14 | 13F | EP Wealth Advisors, Inc. | 9,223 | 0.00 | 783 | 8.76 | ||||
| 2025-07-24 | 13F | Ronald Blue Trust, Inc. | 0 | -100.00 | 0 | |||||
| 2025-07-25 | 13F | LRI Investments, LLC | 200 | 0.00 | 17 | 6.67 | ||||
| 2025-08-14 | 13F | Stifel Financial Corp | 22,227 | -4.33 | 1,886 | 4.14 | ||||
| 2025-04-23 | 13F | GHP Investment Advisors, Inc. | 0 | -100.00 | 0 | |||||
| 2025-08-08 | 13F | Pnc Financial Services Group, Inc. | 50 | -72.38 | 4 | -71.43 | ||||
| 2025-07-23 | 13F | Trueblood Wealth Management, LLC | 9,432 | 0.01 | 800 | 8.84 | ||||
| 2025-08-14 | 13F | Ameriprise Financial Inc | 3,520 | -0.40 | 299 | 8.36 | ||||
| 2025-07-25 | 13F | Cwm, Llc | 8,552 | -68.20 | 1 | -100.00 | ||||
| 2025-08-11 | 13F | Citigroup Inc | 66 | 0.00 | 6 | 0.00 | ||||
| 2025-08-14 | 13F | Old Mission Capital Llc | 3,321 | 47,342.86 | 282 | |||||
| 2025-08-08 | 13F | Gts Securities Llc | 4,336 | 368 | ||||||
| 2025-08-11 | 13F | Principal Securities, Inc. | 23 | 2 | ||||||
| 2025-08-14 | 13F | CoreCap Advisors, LLC | 1,123 | 0.18 | 95 | 9.20 | ||||
| 2025-08-05 | 13F | Key FInancial Inc | 108 | 0.00 | 9 | 12.50 | ||||
| 2025-08-11 | 13F | Nations Financial Group Inc, /ia/ /adv | 2,487 | -11.71 | 211 | -3.65 | ||||
| 2025-08-14 | 13F | Susquehanna International Group, Llp | 9,456 | -42.63 | 802 | -37.59 | ||||
| 2025-07-21 | 13F | Monticello Wealth Management, Llc | 15,730 | -3.08 | 1,335 | 5.45 | ||||
| 2025-08-14 | 13F | Royal Bank Of Canada | 141,663 | -22.46 | 12,021 | -15.62 | ||||
| 2025-07-29 | 13F | Stratos Wealth Partners, LTD. | 3,938 | -2.14 | 334 | 6.71 | ||||
| 2025-07-31 | 13F | Cambridge Investment Research Advisors, Inc. | 63,415 | -1.01 | 5 | 25.00 | ||||
| 2025-08-18 | 13F | Geneos Wealth Management Inc. | 8,388 | 1.62 | 712 | 10.58 | ||||
| 2025-08-14 | 13F | Jane Street Group, Llc | 0 | -100.00 | 0 | |||||
| 2025-08-14 | 13F | Comerica Bank | 115 | -12.21 | 10 | -10.00 | ||||
| 2025-08-11 | 13F | Pineridge Advisors LLC | 64 | -56.76 | 5 | -54.55 | ||||
| 2025-07-25 | 13F | Hemington Wealth Management | 912 | 0.00 | 0 | |||||
| 2025-08-05 | 13F | Bank Of Montreal /can/ | 306 | 26 | ||||||
| 2025-08-12 | 13F | LPL Financial LLC | 155,818 | -10.55 | 13,223 | -2.66 | ||||
| 2025-08-01 | 13F | MorganRosel Wealth Management, LLC | 7,579 | 28.48 | 643 | 39.78 | ||||
| 2025-08-11 | 13F | Cornerstone Planning Group LLC | 4,140 | 10.11 | 353 | 25.62 | ||||
| 2025-07-21 | 13F | HighMark Wealth Management LLC | 47,256 | -0.03 | 4,009 | 8.74 | ||||
| 2025-08-06 | 13F | Legacy Wealth Managment, LLC/ID | 0 | -100.00 | 0 | |||||
| 2025-08-08 | 13F | Biondo Investment Advisors, LLC | 25,480 | 4.82 | 2,162 | 14.09 | ||||
| 2025-08-14 | 13F | Two Sigma Investments, Lp | 9,500 | 806 | ||||||
| 2025-08-08 | 13F | Creative Planning | 3,704 | 0.00 | 314 | 9.03 | ||||
| 2025-08-12 | 13F | Proequities, Inc. | 0 | 0 | ||||||
| 2025-05-14 | 13F | Huntington National Bank | 16 | -11.11 | ||||||
| 2025-09-04 | 13F/A | Advisor Group Holdings, Inc. | 9,925 | -11.78 | 841 | -4.10 | ||||
| 2025-08-06 | 13F | Commonwealth Equity Services, Llc | 13,282 | 19.95 | 1 | |||||
| 2025-04-16 | 13F | New Century Financial Group, LLC | 0 | -100.00 | 0 | -100.00 | ||||
| 2025-08-13 | 13F | Baird Financial Group, Inc. | 31,863 | 1.92 | 2,704 | 10.92 | ||||
| 2025-08-14 | 13F | Fmr Llc | 1,569 | -45.06 | 133 | -40.09 | ||||
| 2025-07-21 | 13F | Creative Capital Management Investments LLC | 147 | 12 | ||||||
| 2025-08-15 | 13F | Morgan Stanley | 340,583 | -6.55 | 28,902 | 1.70 | ||||
| 2025-07-07 | 13F | Investors Research Corp | 44 | 0.00 | 4 | 0.00 | ||||
| 2025-08-08 | 13F | Cetera Investment Advisers | 19,723 | -6.67 | 1,674 | 1.58 | ||||
| 2025-07-10 | 13F | Focus Financial Network, Inc. | 2,791 | -27.41 | 237 | -21.07 | ||||
| 2025-05-05 | 13F | Eagle Bay Advisors LLC | 0 | -100.00 | 0 | -100.00 | ||||
| 2025-08-15 | 13F | ROSS\JOHNSON & Associates LLC | 0 | -100.00 | 0 | |||||
| 2025-04-15 | 13F | Redhawk Wealth Advisors, Inc. | 0 | -100.00 | 0 | |||||
| 2025-08-11 | 13F | Private Advisor Group, LLC | 22,548 | -24.24 | 1,913 | -17.54 | ||||
| 2025-08-14 | 13F | Colony Group, LLC | 3,516 | 0.03 | 298 | 8.76 | ||||
| 2025-05-14 | 13F | CIBC Private Wealth Group, LLC | 0 | -100.00 | 0 | |||||
| 2025-05-09 | 13F | Comprehensive Financial Planning, Inc./PA | 0 | -100.00 | 0 | |||||
| 2025-08-13 | 13F | Northwestern Mutual Wealth Management Co | 40,211 | 10.37 | 3,412 | 20.10 |