Mga Batayang Estadistika
| Pemilik Institusional | 155 total, 155 long only, 0 short only, 0 long/short - change of 2.65% MRQ |
| Alokasi Portofolio Rata-rata | 0.3733 % - change of 6.24% MRQ |
| Saham Institusional (Jangka Panjang) | 12,531,110 (ex 13D/G) - change of -0.33MM shares -2.57% MRQ |
| Nilai Institusional (Jangka Panjang) | $ 794,587 USD ($1000) |
Kepemilikan Institusional dan Pemegang Saham
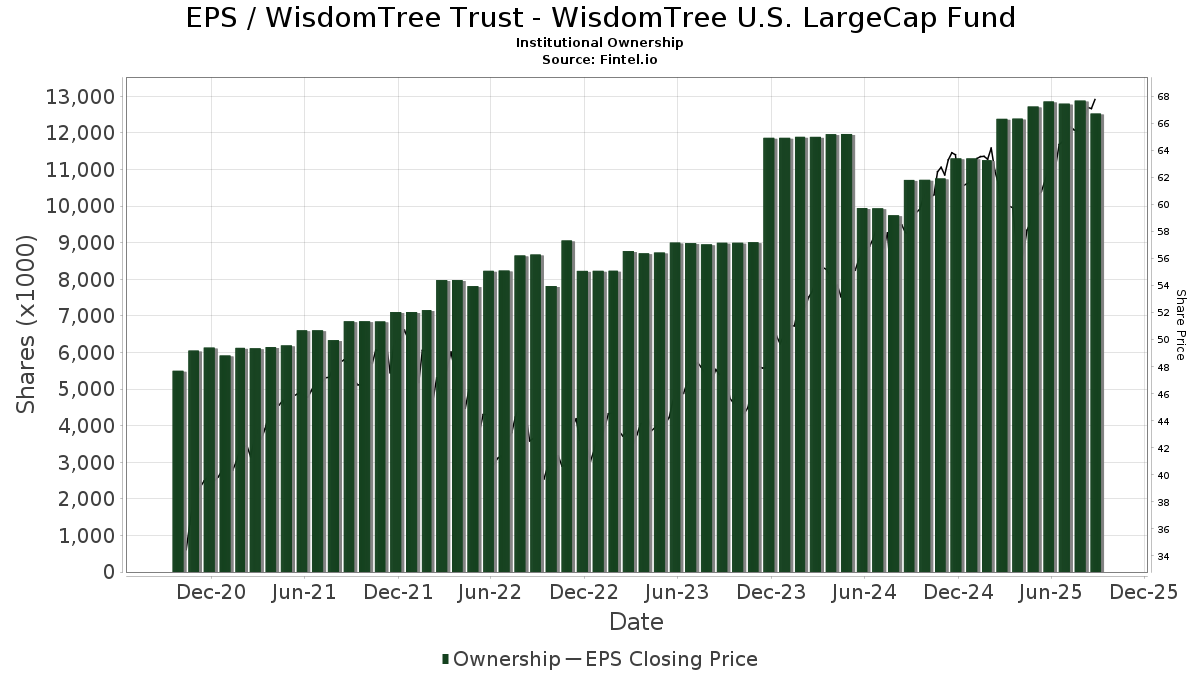
WisdomTree Trust - WisdomTree U.S. LargeCap Fund (US:EPS) memiliki 155 pemilik institusional dan pemegang saham yang telah mengajukan formulir 13D/G atau 13F kepada Komisi Bursa Efek (Securities Exchange Commission/SEC). Lembaga-lembaga ini memegang total 12,531,110 saham. Pemegang saham terbesar meliputi Fiduciary Trust Co, LPL Financial LLC, Private Advisor Group, LLC, Morgan Stanley, Lido Advisors, LLC, Garrett Wealth Advisory Group, LLC, Team Financial Group, LLC, Cetera Investment Advisers, Financial Gravity Companies, Inc., and Ieq Capital, Llc .
Struktur kepemilikan institusional WisdomTree Trust - WisdomTree U.S. LargeCap Fund (ARCA:EPS) menunjukkan posisi terkini di perusahaan oleh institusi dan dana, serta perubahan terbaru dalam ukuran posisi. Pemegang saham utama dapat mencakup investor individu, reksa dana, dana lindung nilai, atau institusi. Jadwal 13D menunjukkan bahwa investor memegang (atau pernah memegang) lebih dari 5% saham perusahaan dan bermaksud (atau pernah bermaksud) untuk secara aktif mengejar perubahan strategi bisnis. Jadwal 13G menunjukkan investasi pasif lebih dari 5%.
The share price as of September 5, 2025 is 67.34 / share. Previously, on September 6, 2024, the share price was 56.68 / share. This represents an increase of 18.80% over that period.
Skor Sentimen Dana
Skor Sentimen Dana (sebelumnya dikenal sebagai Skor Akumulasi Kepemilikan) menemukan saham-saham yang paling banyak dibeli oleh dana. Ini adalah hasil dari model kuantitatif multi-faktor yang canggih yang mengidentifikasi perusahaan dengan tingkat akumulasi institusional tertinggi. Model penilaian menggunakan kombinasi dari total peningkatan pemilik yang diungkapkan, perubahan dalam alokasi portofolio pada pemilik tersebut, dan metrik lainnya. Angka berkisar dari 0 hingga 100, dengan angka yang lebih tinggi menunjukkan tingkat akumulasi yang lebih tinggi dibandingkan dengan perusahaan sejenisnya, dan 50 adalah rata-ratanya.
Frekuensi Pembaruan: Setiap Hari
Lihat Ownership Explorer, yang menyediakan daftar perusahaan dengan peringkat tertinggi.
Rasio Put/Call Institusional
Selain melaporkan isu ekuitas dan utang standar, institusi dengan aset di bawah manajemen lebih dari 100 juta dolar AS juga harus mengungkapkan kepemilikan opsi put dan call mereka. Karena opsi put umumnya menunjukkan sentimen negatif, dan opsi call menunjukkan sentimen positif, kita dapat mengetahui sentimen institusional secara keseluruhan dengan memplot rasio put terhadap call. Grafik di sebelah kanan memplot rasio put/call historis untuk instrumen ini.
Menggunakan Rasio Put/Call sebagai indikator sentimen investor mengatasi salah satu kekurangan utama dari penggunaan total kepemilikan institusional, yaitu sejumlah besar aset yang dikelola diinvestasikan secara pasif untuk melacak indeks. Dana yang dikelola secara pasif biasanya tidak membeli opsi, sehingga indikator rasio put/call lebih akurat dalam melacak sentimen dana yang dikelola secara aktif.
Pengajuan 13F dan NPORT
Detail pada pengajuan 13F tersedia gratis. Detail pada pengajuan NP memerlukan keanggotaan premium. Baris berwarna hijau menunjukkan posisi baru. Baris berwarna merah menunjukkan posisi yang sudah ditutup. Klik tautan ini ikon untuk melihat riwayat transaksi selengkapnya.
Tingkatkan
untuk membuka data premium dan mengekspor ke Excel ![]() .
.
| Tanggal File | Sumber | Investor | Ketik | Presyo ng Avg (Silangan) |
Saham | Δ Saham (%) |
Dilaporkan Nilai ($1000) |
Nilai Δ (%) |
Alokasi Port (%) |
|
|---|---|---|---|---|---|---|---|---|---|---|
| 2025-07-23 | 13F | REAP Financial Group, LLC | 2,773 | -7.97 | 177 | -0.56 | ||||
| 2025-07-23 | 13F | Secured Retirement Advisors, Llc | 3,759 | -24.65 | 241 | -18.64 | ||||
| 2025-08-11 | 13F | Lowe Brockenbrough & Co Inc | 46,252 | 0.00 | 2,961 | 7.99 | ||||
| 2025-07-23 | 13F | Charter Trust Co | 5,721 | 0.00 | 366 | 7.96 | ||||
| 2025-07-29 | 13F | Chicago Partners Investment Group LLC | 26,237 | 0.21 | 1,725 | 12.38 | ||||
| 2025-08-14 | 13F | Quartz Partners, LLC | 10,425 | -0.32 | 667 | 7.75 | ||||
| 2025-07-22 | 13F | Old National Bancorp /in/ | 0 | -100.00 | 0 | |||||
| 2025-08-11 | 13F | Perennial Investment Advisors, LLC | 0 | -100.00 | 0 | |||||
| 2025-08-14 | 13F | Fort Point Capital Partners LLC | 4,810 | 3.89 | 308 | 12.04 | ||||
| 2025-08-05 | 13F | NewSquare Capital LLC | 69,955 | 7.12 | 4,478 | 15.65 | ||||
| 2025-07-10 | 13F | Wealth Enhancement Advisory Services, Llc | 24,615 | 2.44 | 1,599 | 12.22 | ||||
| 2025-07-25 | 13F | Envestnet Portfolio Solutions, Inc. | 0 | -100.00 | 0 | |||||
| 2025-07-22 | 13F | Berger Financial Group, Inc | 8,129 | -0.39 | 520 | 7.66 | ||||
| 2025-08-15 | 13F | Morgan Stanley | 934,478 | -5.27 | 59,816 | 2.29 | ||||
| 2025-08-12 | 13F | Steward Partners Investment Advisory, Llc | 12,514 | -2.20 | 801 | 5.67 | ||||
| 2025-05-14 | 13F | Portfolio Design Labs, LLC | 0 | -100.00 | 0 | |||||
| 2025-04-30 | 13F | Sofos Investments, Inc. | 260,707 | -0.94 | 15,455 | 3.67 | ||||
| 2025-07-25 | 13F | We Are One Seven, LLC | 4,728 | -20.30 | 303 | -13.96 | ||||
| 2025-08-14 | 13F | Smartleaf Asset Management LLC | 132 | 2.33 | 8 | 14.29 | ||||
| 2025-08-14 | 13F | UBS Group AG | 100,724 | -11.63 | 6,447 | -4.57 | ||||
| 2025-08-14 | 13F | Vista Investment Management | 82,899 | 0.90 | 5,306 | 8.95 | ||||
| 2025-08-12 | 13F | SRS Capital Advisors, Inc. | 61 | 4 | ||||||
| 2025-05-12 | 13F | Independent Advisor Alliance | 0 | -100.00 | 0 | |||||
| 2025-07-24 | 13F | Stonebridge Financial Group, LLC | 0 | -100.00 | 0 | |||||
| 2025-07-14 | 13F/A | Seek First Inc. | 10,956 | 0.37 | 701 | 8.35 | ||||
| 2025-08-11 | 13F | Covestor Ltd | 105 | 0.96 | 0 | |||||
| 2025-08-04 | 13F | Spire Wealth Management | 100 | 0.00 | 6 | 20.00 | ||||
| 2025-08-14 | 13F | Ieq Capital, Llc | 265,154 | 0.00 | 16,973 | 7.98 | ||||
| 2025-07-08 | 13F | Nbc Securities, Inc. | 6,797 | -8.30 | 0 | |||||
| 2025-08-13 | 13F | Lido Advisors, LLC | 869,660 | -3.78 | 55,667 | 3.89 | ||||
| 2025-08-13 | 13F | GM Advisory Group, Inc. | 17,414 | -16.59 | 1,115 | -9.94 | ||||
| 2025-08-05 | 13F | GPS Wealth Strategies Group, LLC | 1,375 | 0.00 | 88 | 8.64 | ||||
| 2025-08-06 | 13F | Walkner Condon Financial Advisors LLC | 4,249 | 0.00 | 272 | 7.97 | ||||
| 2025-08-12 | 13F | Garrett Wealth Advisory Group, LLC | 792,460 | 1.78 | 50,725 | 9.90 | ||||
| 2025-08-26 | NP | EVAGX - The E-Valuator Aggressive Growth (85%-99%) RMS Fund Service Class Shares | 26,464 | 1,694 | ||||||
| 2025-07-21 | 13F | Patriot Financial Group Insurance Agency, LLC | 17,066 | -9.69 | 1,092 | -2.50 | ||||
| 2025-08-08 | 13F | Cetera Investment Advisers | 445,451 | 5.27 | 28,513 | 13.67 | ||||
| 2025-08-12 | 13F | CIBC Private Wealth Group, LLC | 160 | 0.00 | 10 | 25.00 | ||||
| 2025-08-08 | 13F | Financial Gravity Companies, Inc. | 277,453 | 15.11 | 17,760 | 20.43 | ||||
| 2025-08-13 | 13F | Maia Wealth LLC | 41,934 | 94.91 | 2,684 | 120.36 | ||||
| 2025-08-07 | 13F | Rathbone Brothers plc | 10,790 | 0.00 | 691 | 7.98 | ||||
| 2025-08-12 | 13F | MAI Capital Management | 1,023 | 0.00 | 65 | 8.33 | ||||
| 2025-08-13 | 13F | Transce3nd, LLC | 268 | 0.00 | 17 | 13.33 | ||||
| 2025-07-07 | 13F | Thurston, Springer, Miller, Herd & Titak, Inc. | 480 | 0.42 | 31 | 7.14 | ||||
| 2025-07-29 | 13F | Swmg, Llc | 4,476 | 295 | ||||||
| 2025-08-04 | 13F | Atria Investments Llc | 9,209 | 29.03 | 589 | 39.24 | ||||
| 2025-07-15 | 13F | Mather Group, Llc. | 0 | -100.00 | 0 | |||||
| 2025-08-14 | 13F | Qube Research & Technologies Ltd | 124 | 0.00 | 8 | 0.00 | ||||
| 2025-08-15 | 13F | Equitable Holdings, Inc. | 14,333 | -19.59 | 917 | -13.16 | ||||
| 2025-08-04 | 13F | Integrity Alliance, Llc. | 146,613 | -73.95 | 9,385 | -71.87 | ||||
| 2025-07-08 | 13F | Melone Private Wealth, LLC | 9,001 | 0.01 | 574 | 7.50 | ||||
| 2025-08-12 | 13F | BlackRock, Inc. | 957 | 0.00 | 61 | 8.93 | ||||
| 2025-08-11 | 13F | Citigroup Inc | 22,806 | 76.39 | 1,460 | 90.47 | ||||
| 2025-07-11 | 13F/A | Umb Bank N A/mo | 3,517 | 0.00 | 225 | 8.17 | ||||
| 2025-07-28 | 13F | WealthPlan Investment Management, LLC | 28,537 | 1,827 | ||||||
| 2025-07-29 | 13F | Huntleigh Advisors, Inc. | 6,498 | -16.66 | 416 | -10.17 | ||||
| 2025-08-18 | 13F/A | Westwood Holdings Group Inc | 5,113 | 0.00 | 327 | 7.92 | ||||
| 2025-05-15 | 13F | Tower Research Capital LLC (TRC) | 0 | -100.00 | 0 | |||||
| 2025-07-15 | 13F | Optima Capital Llc | 5,182 | 0.33 | 332 | 8.17 | ||||
| 2025-08-01 | 13F | Advisory Alpha, LLC | 24,264 | -0.54 | 1,553 | 7.40 | ||||
| 2025-07-25 | 13F | NorthRock Partners, LLC | 2,531 | -2.05 | 162 | 5.88 | ||||
| 2025-08-14 | 13F | Win Advisors, Inc | 140,061 | 8,965 | ||||||
| 2025-08-13 | 13F | Kilter Group LLC | 7,227 | 3.48 | 463 | 11.59 | ||||
| 2025-08-14 | 13F | Citadel Advisors Llc | 29,955 | -49.46 | 1,917 | -45.43 | ||||
| 2025-07-31 | 13F | Cambridge Investment Research Advisors, Inc. | 3,777 | 6.07 | 0 | |||||
| 2025-08-12 | 13F | Global Retirement Partners, LLC | 21,110 | 19.47 | 1,351 | 24.98 | ||||
| 2025-07-10 | 13F | Kmg Fiduciary Partners, Llc | 27,144 | 5.23 | 1,737 | 13.60 | ||||
| 2025-08-13 | 13F | Capital Group Private Client Services, Inc. | 6,385 | -0.03 | 409 | 7.94 | ||||
| 2025-07-07 | 13F | Nova Wealth Management, Inc. | 3,605 | -26.77 | 231 | -20.96 | ||||
| 2025-07-29 | 13F | Private Trust Co Na | 0 | -100.00 | 0 | |||||
| 2025-08-14 | 13F | GWM Advisors LLC | 6,690 | 428 | ||||||
| 2025-08-11 | 13F | Advisor Resource Council | 7,317 | 468 | ||||||
| 2025-08-14 | 13F | Susquehanna International Group, Llp | 42,212 | 27.21 | 2,702 | 37.32 | ||||
| 2025-08-11 | 13F | Private Advisor Group, LLC | 1,058,176 | -1.56 | 67,734 | 6.29 | ||||
| 2025-04-16 | 13F | Defined Financial Planning LLC | 0 | -100.00 | 0 | |||||
| 2025-08-08 | 13F | Creative Planning | 93,914 | 0.00 | 6,011 | 7.98 | ||||
| 2025-04-14 | 13F | Baldwin Brothers Inc/ma | 0 | -100.00 | 0 | |||||
| 2025-08-07 | 13F | Flagship Wealth Advisors, Llc | 87,260 | 9.59 | 5,586 | 18.33 | ||||
| 2025-08-29 | 13F | Centaurus Financial, Inc. | 11,563 | 1 | ||||||
| 2025-07-18 | 13F | Parsons Capital Management Inc/ri | 9,437 | -4.98 | 604 | 2.72 | ||||
| 2025-07-22 | 13F | Marietta Wealth Management, LLC | 98,447 | 2.21 | 6,302 | 10.37 | ||||
| 2025-08-12 | 13F | Coldstream Capital Management Inc | 0 | -100.00 | 0 | |||||
| 2025-08-26 | NP | EVMLX - The E-Valuator Moderate (50%-70%) RMS Fund Service Class Shares | 23,947 | 1,533 | ||||||
| 2025-08-14 | 13F | Mml Investors Services, Llc | 4,057 | -92.23 | 0 | -100.00 | ||||
| 2025-07-30 | 13F | Paul Damon & Associates, Inc. | 10,000 | 0.00 | 640 | 8.11 | ||||
| 2025-08-07 | 13F | Parkside Financial Bank & Trust | 8,816 | 0.00 | 564 | 8.05 | ||||
| 2025-08-15 | 13F | Kestra Advisory Services, LLC | 240,188 | 8.62 | 15,374 | 17.29 | ||||
| 2025-08-07 | 13F | Efficient Advisors, LLC | 0 | -100.00 | 0 | |||||
| 2025-08-13 | 13F | M&t Bank Corp | 5,925 | 0.00 | 379 | 7.98 | ||||
| 2025-08-15 | 13F | CI Private Wealth, LLC | 7,394 | 100.00 | 473 | 115.98 | ||||
| 2025-08-11 | 13F | Principal Securities, Inc. | 286 | 0.00 | 18 | 5.88 | ||||
| 2025-08-18 | 13F | Geneos Wealth Management Inc. | 640 | 60.00 | 41 | 73.91 | ||||
| 2025-07-15 | 13F | Main Street Group, LTD | 50 | 0.00 | 3 | 50.00 | ||||
| 2025-04-28 | 13F | Actinver Wealth Management, Inc. | 0 | -100.00 | 0 | |||||
| 2025-05-08 | 13F | Armis Advisers, LLC | 0 | -100.00 | 0 | |||||
| 2025-08-07 | 13F | Allworth Financial LP | 1,882 | 0.05 | 120 | 11.11 | ||||
| 2025-08-14 | 13F | Royal Bank Of Canada | 26,160 | -0.67 | 1,675 | 7.30 | ||||
| 2025-08-04 | 13F | IFG Advisory, LLC | 5,811 | 0.00 | 372 | 7.85 | ||||
| 2025-08-05 | 13F | Advisors Preferred, LLC | 0 | -100.00 | 0 | |||||
| 2025-08-08 | 13F | Avantax Advisory Services, Inc. | 103,286 | -0.33 | 6,611 | 7.64 | ||||
| 2025-08-14 | 13F | Bank Of America Corp /de/ | 213,770 | -22.22 | 13,683 | -16.01 | ||||
| 2025-08-14 | 13F | Ancora Advisors, LLC | 835 | 0.00 | 53 | 8.16 | ||||
| 2025-08-26 | NP | EVTTX - The E-Valuator Conservative/Moderate (30%-50%) RMS Fund Service Class Shares | 3,824 | 245 | ||||||
| 2025-07-31 | 13F | Moloney Securities Asset Management, LLC | 74,018 | 7.42 | 4,738 | 15.99 | ||||
| 2025-08-12 | 13F | Proequities, Inc. | 0 | 0 | ||||||
| 2025-07-10 | 13F | Moller Financial Services | 3,730 | 0.00 | 239 | 7.69 | ||||
| 2025-08-04 | 13F | Creative Financial Designs Inc /adv | 994 | -15.40 | 64 | -8.70 | ||||
| 2025-07-14 | 13F | Park Avenue Securities Llc | 3,722 | 0 | ||||||
| 2025-07-25 | 13F | Concurrent Investment Advisors, LLC | 37,643 | -15.93 | 2,410 | -9.23 | ||||
| 2025-08-14 | 13F | Fmr Llc | 15,744 | -8.67 | 1,008 | -1.37 | ||||
| 2025-08-14 | 13F | Ameriprise Financial Inc | 10,508 | -0.57 | 673 | 7.35 | ||||
| 2025-08-14 | 13F | Kovitz Investment Group Partners, LLC | 139,475 | 0.02 | 8,925 | 7.96 | ||||
| 2025-08-04 | 13F | Arkadios Wealth Advisors | 13,678 | 2.01 | 876 | 10.20 | ||||
| 2025-07-09 | 13F | Beacon Financial Group | 45,957 | -0.08 | 2,942 | 7.89 | ||||
| 2025-08-08 | 13F | Bouchey Financial Group Ltd | 7,815 | 0.00 | 500 | 7.99 | ||||
| 2025-04-23 | 13F | Western Wealth Management, LLC | 0 | -100.00 | 0 | -100.00 | ||||
| 2025-08-01 | 13F | Envestnet Asset Management Inc | 12,446 | -79.99 | 797 | -78.41 | ||||
| 2025-08-12 | 13F | Jpmorgan Chase & Co | 138,096 | 4.61 | 8,840 | 12.96 | ||||
| 2025-08-26 | NP | EVVLX - The E-Valuator Very Conservative (0%-15%) RMS Fund Service Class Shares | 526 | 34 | ||||||
| 2025-07-30 | 13F | Insight Advisors, LLC/ PA | 0 | -100.00 | 0 | |||||
| 2025-08-12 | 13F | Founders Financial Alliance, LLC | 3,543 | 19.74 | 227 | 29.14 | ||||
| 2025-08-14 | 13F | Mariner, LLC | 0 | -100.00 | 0 | |||||
| 2025-08-14 | 13F | Herold Advisors, Inc. | 17,360 | 0.00 | 1,111 | 7.97 | ||||
| 2025-07-14 | 13F | E&G Advisors, LP | 7,225 | 0.84 | 462 | 8.96 | ||||
| 2025-07-22 | 13F | Beacon Financial Advisory LLC | 20,361 | -14.26 | 1,303 | -7.39 | ||||
| 2025-08-13 | 13F | Jones Financial Companies Lllp | 20,146 | 42.70 | 1,285 | 54.51 | ||||
| 2025-07-18 | 13F | Institute for Wealth Management, LLC. | 9,910 | 0.00 | 634 | 8.01 | ||||
| 2025-08-14 | 13F | Redwood Financial Network Corp | 7,191 | 0.00 | 460 | 7.98 | ||||
| 2025-08-14 | 13F | Stifel Financial Corp | 12,086 | -0.87 | 774 | 7.06 | ||||
| 2025-08-14 | 13F | Betterment LLC | 52,775 | 3.19 | 3 | 0.00 | ||||
| 2025-07-16 | 13F | ORG Partners LLC | 10,703 | -3.25 | 686 | 4.57 | ||||
| 2025-07-28 | 13F | Capital Management Corp /va | 3,225 | -5.84 | 206 | 1.48 | ||||
| 2025-08-14 | 13F | CoreCap Advisors, LLC | 4,648 | -2.02 | 298 | 5.69 | ||||
| 2025-08-06 | 13F | Modera Wealth Management, LLC | 35,094 | -0.28 | 2,246 | 7.67 | ||||
| 2025-08-06 | 13F | Commonwealth Equity Services, Llc | 6,754 | 0.16 | 0 | |||||
| 2025-07-15 | 13F | SJS Investment Consulting Inc. | 1,726 | 0.00 | 110 | 7.84 | ||||
| 2025-08-13 | 13F | First Trust Advisors Lp | 3,718 | 238 | ||||||
| 2025-07-08 | 13F | RMR Wealth Builders | 3,194 | 204 | ||||||
| 2025-08-12 | 13F | Cornerstone Wealth Management, LLC | 8,506 | 0.14 | 544 | 8.15 | ||||
| 2025-08-12 | 13F | LPL Financial LLC | 1,278,743 | 13.04 | 81,852 | 22.06 | ||||
| 2025-07-28 | 13F | Mutual Advisors, LLC | 4,050 | 267 | ||||||
| 2025-08-05 | 13F | C2P Capital Advisory Group, LLC d.b.a. Prosperity Capital Advisors | 28,020 | -2.16 | 1,794 | 5.47 | ||||
| 2025-05-13 | 13F | EPG Wealth Management LLC | 0 | -100.00 | 0 | -100.00 | ||||
| 2025-09-04 | 13F/A | Advisor Group Holdings, Inc. | 25,019 | 256.60 | 1,601 | 285.78 | ||||
| 2025-08-14 | 13F | Integrated Wealth Concepts LLC | 3,420 | -83.57 | 219 | -82.33 | ||||
| 2025-08-14 | 13F | Raymond James Financial Inc | 34,195 | 16.11 | 2,189 | 25.39 | ||||
| 2025-08-12 | 13F | PSI Advisors, LLC | 0 | -100.00 | 0 | |||||
| 2025-08-13 | 13F | Cerity Partners LLC | 4,645 | 0.00 | 297 | 8.00 | ||||
| 2025-08-14 | 13F | Wells Fargo & Company/mn | 81,040 | -0.75 | 5,187 | 7.17 | ||||
| 2025-07-29 | 13F | Systelligence, LLC | 111,186 | 7,117 | ||||||
| 2025-08-14 | 13F | Two Sigma Investments, Lp | 54,400 | 3,482 | ||||||
| 2025-07-29 | 13F | AssuredPartners Investment Advisors, LLC | 43,358 | -2.01 | 2,775 | 5.84 | ||||
| 2025-08-14 | 13F | Fiduciary Trust Co | 2,252,225 | -6.74 | 144,165 | 0.70 | ||||
| 2025-07-10 | 13F | Rockland Trust Co | 37,404 | -2.55 | 2,394 | 5.23 | ||||
| 2025-08-13 | 13F | Northwestern Mutual Wealth Management Co | 109,748 | 16.42 | 7,025 | 25.70 | ||||
| 2025-07-22 | 13F | IFS Advisors, LLC | 4,873 | -3.75 | 312 | 3.67 | ||||
| 2025-08-14 | 13F | Jane Street Group, Llc | 0 | -100.00 | 0 | |||||
| 2025-08-14 | 13F | Comerica Bank | 1,011 | 0.00 | 65 | 8.47 | ||||
| 2025-07-22 | 13F | Team Financial Group, LLC | 451,840 | 5.96 | 28,922 | 14.41 | ||||
| 2025-07-17 | 13F | Coastline Trust Co | 1,380 | 0.00 | 88 | 8.64 | ||||
| 2025-07-23 | 13F | Prime Capital Investment Advisors, LLC | 56,000 | -4.71 | 3,585 | 2.90 | ||||
| 2025-08-06 | 13F | AE Wealth Management LLC | 428 | 2,957.14 | 27 | |||||
| 2025-07-10 | 13F | Focus Financial Network, Inc. | 4,788 | 306 | ||||||
| 2025-08-14 | 13F | Harwood Advisory Group, LLC | 35 | 0.00 | 2 | 0.00 | ||||
| 2025-08-14 | 13F | Essential Planning, LLC. | 10,914 | 0.01 | 699 | 8.05 | ||||
| 2025-07-28 | 13F | Harbour Investments, Inc. | 47,945 | 13.58 | 3,069 | 22.62 | ||||
| 2025-08-08 | 13F | Pnc Financial Services Group, Inc. | 3,872 | 0.00 | 248 | 7.86 | ||||
| 2025-08-26 | NP | EVGLX - The E-Valuator Growth (70%-85%) RMS Fund Service Class Shares | 52,505 | 3,361 | ||||||
| 2025-08-13 | 13F | Jackson Creek Investment Advisors LLC | 8,954 | 0.27 | 1 | |||||
| 2025-07-18 | 13F | Bartlett & Co. Wealth Management Llc | 939 | 0.00 | 60 | 9.09 | ||||
| 2025-08-07 | 13F | Verus Capital Partners, Llc | 8,167 | 5.18 | 523 | 13.48 | ||||
| 2025-08-14 | 13F | Goldman Sachs Group Inc | 78,849 | 191.95 | 5,047 | 215.24 | ||||
| 2025-07-15 | 13F | Garrett Investment Advisors LLC | 4,342 | 0.00 | 278 | 7.78 | ||||
| 2025-05-08 | NP | QALTX - Quantified Alternative Investment Fund Investor Class Shares | 211 | -96.30 | 13 | -96.55 | ||||
| 2025-07-24 | 13F | Ronald Blue Trust, Inc. | 81 | 0.00 | 5 | 25.00 | ||||
| 2025-08-26 | NP | EVCLX - The E-Valuator Conservative (15%-30%) RMS Fund Service Class Shares | 3,920 | 251 | ||||||
| 2025-07-22 | 13F | Simplicity Wealth,LLC | 0 | -100.00 | 0 | |||||
| 2025-08-13 | 13F | Stenger Family Office, LLC | 0 | -100.00 | 0 | |||||
| 2025-08-19 | 13F | Advisory Services Network, LLC | 3,935 | 0.00 | 258 | 10.30 | ||||
| 2025-07-28 | 13F | Axxcess Wealth Management, Llc | 3,561 | 1.40 | 228 | 9.13 |