Mga Batayang Estadistika
| Pemilik Institusional | 134 total, 131 long only, 0 short only, 3 long/short - change of 63.41% MRQ |
| Alokasi Portofolio Rata-rata | 0.2367 % - change of -5.21% MRQ |
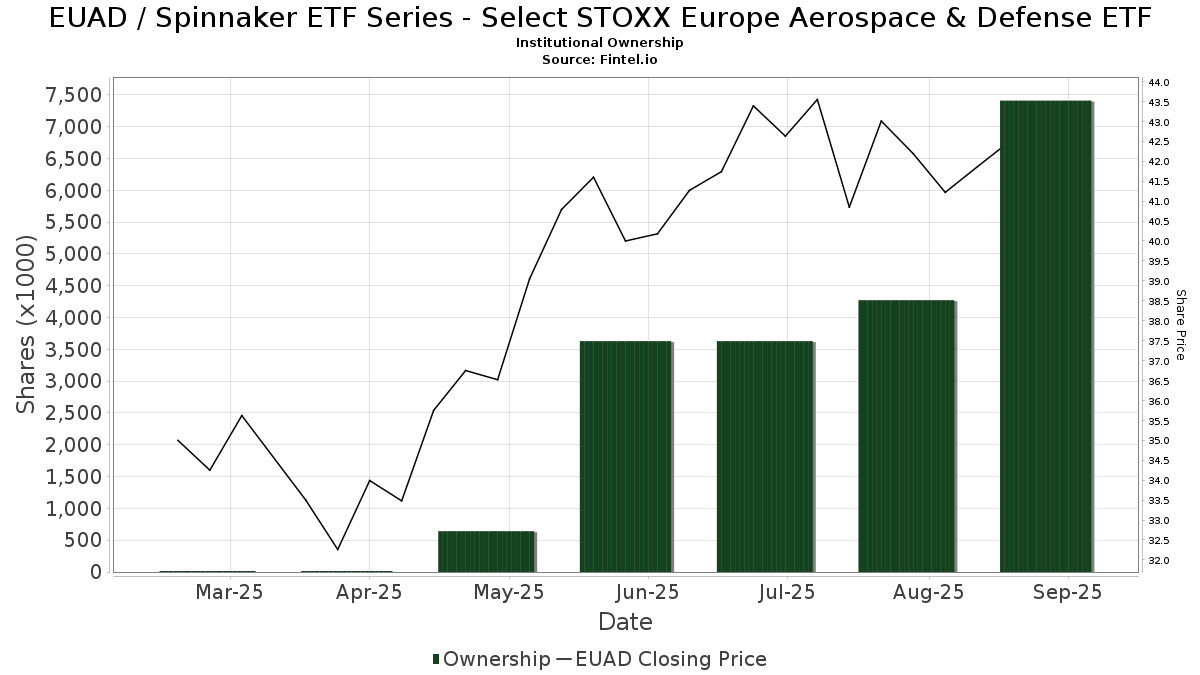
| Saham Institusional (Jangka Panjang) | 7,412,530 (ex 13D/G) - change of 3.78MM shares 104.18% MRQ |
| Nilai Institusional (Jangka Panjang) | $ 262,869 USD ($1000) |
Kepemilikan Institusional dan Pemegang Saham
Spinnaker ETF Series - Select STOXX Europe Aerospace & Defense ETF (US:EUAD) memiliki 134 pemilik institusional dan pemegang saham yang telah mengajukan formulir 13D/G atau 13F kepada Komisi Bursa Efek (Securities Exchange Commission/SEC). Lembaga-lembaga ini memegang total 7,412,530 saham. Pemegang saham terbesar meliputi Bank Of Montreal /can/, Laurel Wealth Advisors LLC, Cetera Investment Advisers, CacheTech Inc., Adams Wealth Management, Quadrature Capital Ltd, SMI Advisory Services, LLC, Royal Bank Of Canada, Commonwealth Equity Services, Llc, and UBS Group AG .
Struktur kepemilikan institusional Spinnaker ETF Series - Select STOXX Europe Aerospace & Defense ETF (BATS:EUAD) menunjukkan posisi terkini di perusahaan oleh institusi dan dana, serta perubahan terbaru dalam ukuran posisi. Pemegang saham utama dapat mencakup investor individu, reksa dana, dana lindung nilai, atau institusi. Jadwal 13D menunjukkan bahwa investor memegang (atau pernah memegang) lebih dari 5% saham perusahaan dan bermaksud (atau pernah bermaksud) untuk secara aktif mengejar perubahan strategi bisnis. Jadwal 13G menunjukkan investasi pasif lebih dari 5%.
The share price as of September 5, 2025 is 42.33 / share. Previously, on October 22, 2024, the share price was 25.17 / share. This represents an increase of 68.14% over that period.
Skor Sentimen Dana
Skor Sentimen Dana (sebelumnya dikenal sebagai Skor Akumulasi Kepemilikan) menemukan saham-saham yang paling banyak dibeli oleh dana. Ini adalah hasil dari model kuantitatif multi-faktor yang canggih yang mengidentifikasi perusahaan dengan tingkat akumulasi institusional tertinggi. Model penilaian menggunakan kombinasi dari total peningkatan pemilik yang diungkapkan, perubahan dalam alokasi portofolio pada pemilik tersebut, dan metrik lainnya. Angka berkisar dari 0 hingga 100, dengan angka yang lebih tinggi menunjukkan tingkat akumulasi yang lebih tinggi dibandingkan dengan perusahaan sejenisnya, dan 50 adalah rata-ratanya.
Frekuensi Pembaruan: Setiap Hari
Lihat Ownership Explorer, yang menyediakan daftar perusahaan dengan peringkat tertinggi.
Rasio Put/Call Institusional
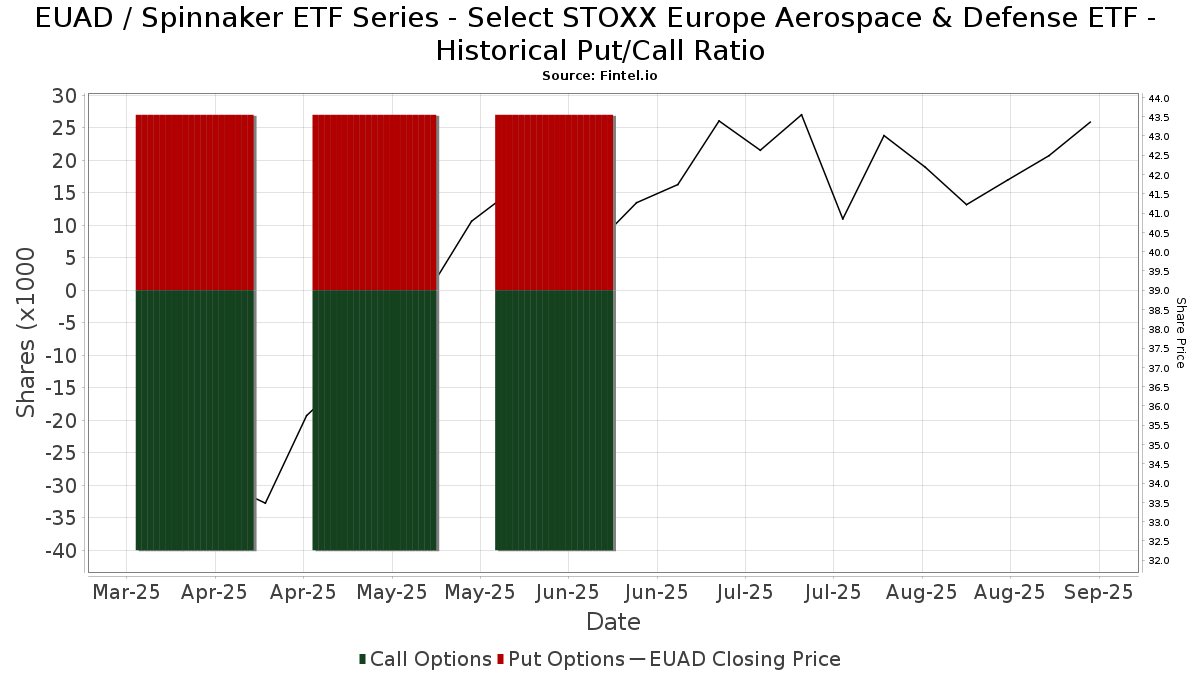
Selain melaporkan isu ekuitas dan utang standar, institusi dengan aset di bawah manajemen lebih dari 100 juta dolar AS juga harus mengungkapkan kepemilikan opsi put dan call mereka. Karena opsi put umumnya menunjukkan sentimen negatif, dan opsi call menunjukkan sentimen positif, kita dapat mengetahui sentimen institusional secara keseluruhan dengan memplot rasio put terhadap call. Grafik di sebelah kanan memplot rasio put/call historis untuk instrumen ini.
Menggunakan Rasio Put/Call sebagai indikator sentimen investor mengatasi salah satu kekurangan utama dari penggunaan total kepemilikan institusional, yaitu sejumlah besar aset yang dikelola diinvestasikan secara pasif untuk melacak indeks. Dana yang dikelola secara pasif biasanya tidak membeli opsi, sehingga indikator rasio put/call lebih akurat dalam melacak sentimen dana yang dikelola secara aktif.
Pengajuan 13F dan NPORT
Detail pada pengajuan 13F tersedia gratis. Detail pada pengajuan NP memerlukan keanggotaan premium. Baris berwarna hijau menunjukkan posisi baru. Baris berwarna merah menunjukkan posisi yang sudah ditutup. Klik tautan ini ikon untuk melihat riwayat transaksi selengkapnya.
Tingkatkan
untuk membuka data premium dan mengekspor ke Excel ![]() .
.
| Tanggal File | Sumber | Investor | Ketik | Presyo ng Avg (Silangan) |
Saham | Δ Saham (%) |
Dilaporkan Nilai ($1000) |
Nilai Δ (%) |
Alokasi Port (%) |
|
|---|---|---|---|---|---|---|---|---|---|---|
| 2025-07-10 | 13F | HWG Holdings LP | 31,467 | 1,358 | ||||||
| 2025-07-29 | 13F | Tradewinds Capital Management, LLC | 25 | 0.00 | 1 | |||||
| 2025-08-05 | 13F | Scarborough Advisors, LLC | 38,479 | 191.31 | 1,660 | 275.57 | ||||
| 2025-08-14 | 13F | Bank Of America Corp /de/ | 1,220 | 201.23 | 53 | 300.00 | ||||
| 2025-08-29 | NP | GDMA - Gadsden Dynamic Multi-Asset ETF | 30,716 | -77.08 | 1,325 | -70.51 | ||||
| 2025-08-13 | 13F | Capital Analysts, Inc. | 1,966 | 227.67 | 0 | |||||
| 2025-07-11 | 13F | Farther Finance Advisors, LLC | 688 | 0.00 | 30 | 26.09 | ||||
| 2025-07-23 | 13F | Foresight Capital Management Advisors, Inc. | 8,232 | 355 | ||||||
| 2025-08-14 | 13F | Susquehanna International Group, Llp | 0 | -100.00 | 0 | |||||
| 2025-08-11 | 13F | Banque Cantonale Vaudoise | 852 | 0 | ||||||
| 2025-08-01 | 13F | Oak Grove Capital LLC | 43,000 | 1,855 | ||||||
| 2025-08-06 | 13F | Commonwealth Equity Services, Llc | 218,320 | 89.65 | 9 | 200.00 | ||||
| 2025-08-18 | 13F | Castleark Management Llc | 147,000 | 0.00 | 6,343 | 28.71 | ||||
| 2025-08-14 | 13F | Wiley Bros.-aintree Capital, Llc | 7,250 | 0.00 | 313 | 27.87 | ||||
| 2025-08-18 | 13F | Hollencrest Capital Management | 160 | 7 | ||||||
| 2025-08-14 | 13F | Tudor Investment Corp Et Al | 0 | -100.00 | 0 | |||||
| 2025-08-01 | 13F | Advisory Alpha, LLC | 5,538 | 239 | ||||||
| 2025-08-12 | 13F | Boreal Capital Management LLC | 860 | 37 | ||||||
| 2025-08-05 | 13F | Simplex Trading, Llc | 28,140 | 1 | ||||||
| 2025-08-01 | 13F | Envestnet Asset Management Inc | 28,884 | 83.55 | 1,246 | 136.43 | ||||
| 2025-08-13 | 13F | WCG Wealth Advisors LLC | 29,000 | 1,251 | ||||||
| 2025-08-14 | 13F | Dearborn Partners Llc | 5,450 | 235 | ||||||
| 2025-08-15 | 13F | Kestra Advisory Services, LLC | 0 | -100.00 | 0 | |||||
| 2025-08-05 | 13F | Bank Of Montreal /can/ | 859,436 | 76.36 | 37,085 | 126.95 | ||||
| 2025-08-13 | 13F | Raab & Moskowitz Asset Management LLC | 15,085 | -9.88 | 651 | 15.86 | ||||
| 2025-07-21 | 13F | Greenwood Capital Associates Llc | 0 | -100.00 | 0 | |||||
| 2025-07-24 | 13F | IFP Advisors, Inc | 6,525 | 357.89 | 282 | 497.87 | ||||
| 2025-08-08 | 13F | Citizens Financial Group Inc/ri | 28,934 | 0.00 | 1,249 | 28.66 | ||||
| 2025-08-14 | 13F | UBS Group AG | 196,393 | 1,915.73 | 8,474 | 2,499.39 | ||||
| 2025-07-30 | 13F | St. Johns Investment Management Company, LLC | 100 | 4 | ||||||
| 2025-08-12 | 13F | Global Retirement Partners, LLC | 290 | 13 | ||||||
| 2025-08-15 | 13F | Captrust Financial Advisors | 8,052 | 347 | ||||||
| 2025-08-19 | 13F | Advisory Services Network, LLC | 32,764 | 445.25 | 1,363 | 577.61 | ||||
| 2025-07-28 | 13F | Harbour Investments, Inc. | 935 | 167.91 | 40 | 263.64 | ||||
| 2025-08-06 | 13F | Ethos Financial Group, LLC | 105,085 | 4,534 | ||||||
| 2025-08-07 | 13F | Montag A & Associates Inc | 300 | 0.00 | 13 | 20.00 | ||||
| 2025-08-14 | 13F | Royal Bank Of Canada | 233,776 | 2,389.63 | 10,087 | 3,102.22 | ||||
| 2025-08-13 | 13F | Quadrature Capital Ltd | 306,539 | 13,204 | ||||||
| 2025-08-12 | 13F | Steward Partners Investment Advisory, Llc | 13,521 | 694.42 | 583 | 922.81 | ||||
| 2025-08-15 | 13F | Northeast Financial Consultants Inc | 51,255 | 2,212 | ||||||
| 2025-08-12 | 13F | Bokf, Na | 300 | 0.00 | 13 | 20.00 | ||||
| 2025-07-25 | 13F | Johnson Investment Counsel Inc | 4,950 | 214 | ||||||
| 2025-08-11 | 13F | TD Waterhouse Canada Inc. | 3,333 | 13.64 | 139 | 39.00 | ||||
| 2025-08-14 | 13F | Federation des caisses Desjardins du Quebec | 5,387 | 67.09 | 232 | 114.81 | ||||
| 2025-08-08 | 13F | Gts Securities Llc | 0 | -100.00 | 0 | |||||
| 2025-07-07 | 13F | Nova Wealth Management, Inc. | 35 | 2 | ||||||
| 2025-07-16 | 13F | St Germain D J Co Inc | 1,309 | 56 | ||||||
| 2025-08-13 | 13F | bLong Financial, LLC | 109,699 | 4,734 | ||||||
| 2025-07-31 | 13F | Ssa Swiss Advisors Ag | 1,746 | 76 | ||||||
| 2025-07-29 | 13F | Activest Wealth Management | 1,171 | 51 | ||||||
| 2025-08-13 | 13F | Renaissance Technologies Llc | 119,800 | 5,169 | ||||||
| 2025-08-14 | 13F | GWM Advisors LLC | 8,124 | 34.08 | 351 | 72.41 | ||||
| 2025-08-14 | 13F | CIBC World Markets Inc. | 103,020 | 328.98 | 4,445 | 452.17 | ||||
| 2025-08-15 | 13F | CI Private Wealth, LLC | 51,034 | 199.51 | 2,202 | 285.64 | ||||
| 2025-07-29 | 13F | JTC Employer Solutions Trusteee Ltd | 7,053 | 0.00 | 0 | |||||
| 2025-08-07 | 13F | David R. Rahn & Associates Inc. | 80,039 | 3,454 | ||||||
| 2025-08-13 | 13F | MYDA Advisors LLC | 60,000 | -7.69 | 2,589 | 18.82 | ||||
| 2025-08-01 | 13F | James Investment Research Inc | 50,833 | 2,193 | ||||||
| 2025-07-31 | 13F | GenTrust, LLC | 5,990 | 258 | ||||||
| 2025-08-08 | 13F | Glassman Wealth Services | 2,494 | 108 | ||||||
| 2025-07-23 | 13F | Nbt Bank N A /ny | 1,400 | 283.56 | 60 | 400.00 | ||||
| 2025-07-18 | 13F | SMI Advisory Services, LLC | 234,206 | 8.53 | 9,984 | 56.15 | ||||
| 2025-08-05 | 13F | Financial Sense Advisors, Inc. | 45,613 | 80.29 | 1,968 | 132.08 | ||||
| 2025-05-12 | 13F | Sandy Spring Bank | 375 | 13 | ||||||
| 2025-08-07 | 13F | Nwam Llc | 5,505 | 225 | ||||||
| 2025-08-11 | 13F | Principal Securities, Inc. | 56,902 | 2,455 | ||||||
| 2025-08-14 | 13F | D. E. Shaw & Co., Inc. | 29,065 | 1,252 | ||||||
| 2025-08-12 | 13F | CIBC Private Wealth Group, LLC | 6,764 | 14.37 | 292 | 62.57 | ||||
| 2025-08-13 | 13F | Loomis Sayles & Co L P | 31,350 | 1,353 | ||||||
| 2025-08-12 | 13F | Terra Nova Asset Management LLC | 22,089 | 9.82 | 953 | 41.39 | ||||
| 2025-07-16 | 13F | Spinnaker Investment Group, LLC | 8,818 | 380 | ||||||
| 2025-07-11 | 13F | SILVER OAK SECURITIES, Inc | 24,682 | 1,065 | ||||||
| 2025-08-18 | 13F/A | National Bank Of Canada /fi/ | 73,176 | 29.76 | 3,152 | 66.77 | ||||
| 2025-07-16 | 13F | ORG Partners LLC | 23,388 | 17.01 | 973 | 43.09 | ||||
| 2025-04-22 | 13F | Bright Futures Wealth Management, LLC. | 32,606 | 1,100 | ||||||
| 2025-08-13 | 13F | Per Stirling Capital Management, LLC. | 27,807 | 1,200 | ||||||
| 2025-08-11 | 13F | FSA Wealth Management LLC | 250 | 11 | ||||||
| 2025-08-14 | 13F | Raymond James Financial Inc | 23,919 | 1,032 | ||||||
| 2025-08-14 | 13F | Hrt Financial Lp | 21,111 | -12.41 | 1 | |||||
| 2025-08-19 | 13F | Newbridge Financial Services Group, Inc. | 0 | -100.00 | 0 | |||||
| 2025-07-22 | 13F | Belpointe Asset Management LLC | 9,676 | 418 | ||||||
| 2025-08-06 | 13F | Atlantic Union Bankshares Corp | 575 | 25 | ||||||
| 2025-08-14 | 13F | CoreCap Advisors, LLC | 167 | 7 | ||||||
| 2025-08-11 | 13F | Sharpepoint Llc | 57,159 | 1.98 | 2,466 | 25.37 | ||||
| 2025-08-11 | 13F | Rothschild Investment Llc | 180 | 20.00 | 8 | 40.00 | ||||
| 2025-07-22 | 13F | Chung Wu Investment Group, LLC | 3,600 | 155 | ||||||
| 2025-08-12 | 13F | Proequities, Inc. | 0 | 0 | ||||||
| 2025-08-13 | 13F | Cresset Asset Management, LLC | 11,564 | 78.51 | 499 | 129.49 | ||||
| 2025-08-28 | NP | EDGI - 3EDGE Dynamic International Equity ETF | 30,513 | 1,317 | ||||||
| 2025-07-28 | 13F | Patten & Patten Inc/tn | 179,220 | 1,597.16 | 7,733 | 2,084.46 | ||||
| 2025-07-17 | 13F | Bluesphere Advisors, LLC | 30,809 | 1,329 | ||||||
| 2025-08-11 | 13F | Heritage Wealth Advisors | 841 | 0.00 | 36 | 28.57 | ||||
| 2025-08-14 | 13F | Citadel Advisors Llc | 13,827 | -80.15 | 597 | -74.48 | ||||
| 2025-08-14 | 13F | Citadel Advisors Llc | Put | 13,400 | 578 | |||||
| 2025-08-18 | 13F | N.E.W. Advisory Services LLC | 0 | -100.00 | 0 | |||||
| 2025-08-11 | 13F | Wealthspire Advisors, LLC | 0 | -100.00 | 0 | |||||
| 2025-08-15 | 13F | Morgan Stanley | 30,662 | 141.74 | 1,323 | 211.29 | ||||
| 2025-08-14 | 13F | Stifel Financial Corp | 7,252 | 313 | ||||||
| 2025-08-14 | 13F | Citadel Advisors Llc | Call | 20,200 | 872 | |||||
| 2025-08-14 | 13F | Jane Street Group, Llc | 59,301 | -79.09 | 2,559 | -73.09 | ||||
| 2025-07-09 | 13F | Dynamic Advisor Solutions LLC | 15,505 | 669 | ||||||
| 2025-07-31 | 13F | 3EDGE Asset Management, LP | 46,671 | 1,992 | ||||||
| 2025-07-29 | 13F | TFC Financial Management | 0 | -100.00 | 0 | |||||
| 2025-08-08 | 13F | Pnc Financial Services Group, Inc. | 2,500 | -5.66 | 108 | 21.59 | ||||
| 2025-08-14 | 13F/A | Barclays Plc | 2,300 | 187.50 | 0 | |||||
| 2025-05-13 | 13F | CacheTech Inc. | 473,001 | 15,860 | ||||||
| 2025-05-13 | 13F | Adams Wealth Management | 473,001 | 15,860 | ||||||
| 2025-07-17 | 13F | Ariose Capital Management Ltd | 64,662 | 0.00 | 2,790 | 28.69 | ||||
| 2025-07-17 | 13F | Nelson, Van Denburg & Campbell Wealth Management Group, LLC | 7,697 | 332 | ||||||
| 2025-07-30 | 13F | Crewe Advisors LLC | 0 | -100.00 | 0 | |||||
| 2025-08-13 | 13F | Marshall Wace, Llp | 130,496 | 32.67 | 5,631 | 70.76 | ||||
| 2025-08-11 | 13F | HighTower Advisors, LLC | 11,787 | 509 | ||||||
| 2025-07-31 | 13F | Cambridge Investment Research Advisors, Inc. | 65,076 | 60.94 | 3 | 100.00 | ||||
| 2025-04-08 | 13F | Parallel Advisors, LLC | 0 | 0 | ||||||
| 2025-08-14 | 13F | Shay Capital LLC | 0 | -100.00 | 0 | |||||
| 2025-07-29 | 13F | Werba Rubin Papier Wealth Management | 8,015 | 0.00 | 346 | 28.73 | ||||
| 2025-08-07 | 13F | Allworth Financial LP | 163 | 0.00 | 7 | 40.00 | ||||
| 2025-08-15 | 13F | Semmax Financial Advisors Inc. | 29,255 | 1,219 | ||||||
| 2025-08-11 | 13F | Empowered Funds, LLC | 30,799 | -77.02 | 1,329 | -70.44 | ||||
| 2025-08-12 | 13F | Laurel Wealth Advisors LLC | 741,749 | 20,475.56 | 17 | -85.83 | ||||
| 2025-07-18 | 13F | Truist Financial Corp | 8,790 | 366 | ||||||
| 2025-07-15 | 13F | Herbst Group, Llc | 56,437 | 2,435 | ||||||
| 2025-08-04 | 13F | Spire Wealth Management | 4,511 | 195 | ||||||
| 2025-07-23 | 13F | Magnolia Capital Management Ltd | 7,235 | 0.00 | 0 | |||||
| 2025-08-13 | 13F | JT Stratford LLC | 5,942 | 256 | ||||||
| 2025-08-01 | 13F | Belvedere Trading LLC | Put | 5,100 | 220 | |||||
| 2025-08-13 | 13F | Financial Freedom, LLC | 579 | 0.00 | 25 | 26.32 | ||||
| 2025-08-14 | 13F | Lazard Asset Management Llc | 0 | -100.00 | 0 | |||||
| 2025-08-13 | 13F | Scotia Capital Inc. | 13,245 | 36.31 | 571 | 75.69 | ||||
| 2025-07-14 | 13F | Toth Financial Advisory Corp | 11 | 0.00 | 0 | |||||
| 2025-07-29 | 13F | Primoris Wealth Advisors, Llc | 68,920 | -16.71 | 2,974 | 7.17 | ||||
| 2025-08-13 | 13F | Northwestern Mutual Wealth Management Co | 121 | 5 | ||||||
| 2025-08-13 | 13F | Custom Index Systems, Llc | 20,485 | 884 | ||||||
| 2025-08-08 | 13F | Cetera Investment Advisers | 673,363 | 5,949.98 | 29,056 | 7,689.54 | ||||
| 2025-08-13 | 13F | Northern Trust Corp | 10,249 | 442 | ||||||
| 2025-07-18 | 13F | Viewpoint Investment Partners Corp | 62,018 | 149.57 | 2,676 | 221.25 | ||||
| 2025-08-13 | 13F | Cerity Partners LLC | 18,425 | 140.85 | 795 | 210.55 | ||||
| 2025-08-18 | 13F | Wolverine Trading, Llc | Call | 4,900 | 208 | |||||
| 2025-08-18 | 13F | Wolverine Trading, Llc | Put | 8,700 | 369 | |||||
| 2025-08-04 | 13F | Pensionmark Financial Group, Llc | 13,226 | 571 | ||||||
| 2025-08-18 | 13F | Wolverine Trading, Llc | 13,699 | 582 | ||||||
| 2025-08-14 | 13F | Barometer Capital Management Inc. | 13,000 | 209.52 | 561 | 300.00 | ||||
| 2025-08-07 | 13F | CENTRAL TRUST Co | 1,275 | 55 | ||||||
| 2025-07-31 | 13F | Oppenheimer & Co Inc | 41,127 | 343.08 | 1,775 | 470.42 | ||||
| 2025-08-04 | 13F | Simon Quick Advisors, Llc | 6,011 | 259 | ||||||
| 2025-08-14 | 13F | Hilltop Holdings Inc. | 5,834 | 252 | ||||||
| 2025-08-01 | 13F | Belvedere Trading LLC | 3,867 | 167 | ||||||
| 2025-08-01 | 13F | Belvedere Trading LLC | Call | 15,100 | 652 | |||||
| 2025-08-08 | 13F | Creative Planning | 9,847 | 57.60 | 425 | 102.87 | ||||
| 2025-08-12 | 13F | J.w. Cole Advisors, Inc. | 29,880 | 1,289 | ||||||
| 2025-07-17 | 13F | Sound Income Strategies, LLC | 12 | 1 | ||||||
| 2025-08-11 | 13F | Y.D. More Investments Ltd | 1,000 | 42 | ||||||
| 2025-07-31 | 13F | AlTi Global, Inc. | 12,240 | 0.00 | 531 | 29.51 | ||||
| 2025-09-04 | 13F/A | Advisor Group Holdings, Inc. | 1,578 | 18.83 | 68 | 54.55 |