Mga Batayang Estadistika
| Pemilik Institusional | 149 total, 149 long only, 0 short only, 0 long/short - change of 3.45% MRQ |
| Alokasi Portofolio Rata-rata | 0.1631 % - change of -21.95% MRQ |
| Saham Institusional (Jangka Panjang) | 14,008,758 (ex 13D/G) - change of -0.33MM shares -2.33% MRQ |
| Nilai Institusional (Jangka Panjang) | $ 325,118 USD ($1000) |
Kepemilikan Institusional dan Pemegang Saham
Eaton Vance Tax-Advantaged Dividend Income Fund (US:EVT) memiliki 149 pemilik institusional dan pemegang saham yang telah mengajukan formulir 13D/G atau 13F kepada Komisi Bursa Efek (Securities Exchange Commission/SEC). Lembaga-lembaga ini memegang total 14,008,758 saham. Pemegang saham terbesar meliputi Morgan Stanley, Bank Of America Corp /de/, UBS Group AG, McGowan Group Asset Management, Inc., Raymond James Financial Inc, 1607 Capital Partners, LLC, Wells Fargo & Company/mn, Joel Isaacson & Co., LLC, Karpus Management, Inc., and LPL Financial LLC .
Struktur kepemilikan institusional Eaton Vance Tax-Advantaged Dividend Income Fund (NYSE:EVT) menunjukkan posisi terkini di perusahaan oleh institusi dan dana, serta perubahan terbaru dalam ukuran posisi. Pemegang saham utama dapat mencakup investor individu, reksa dana, dana lindung nilai, atau institusi. Jadwal 13D menunjukkan bahwa investor memegang (atau pernah memegang) lebih dari 5% saham perusahaan dan bermaksud (atau pernah bermaksud) untuk secara aktif mengejar perubahan strategi bisnis. Jadwal 13G menunjukkan investasi pasif lebih dari 5%.
The share price as of September 5, 2025 is 24.32 / share. Previously, on September 9, 2024, the share price was 23.82 / share. This represents an increase of 2.10% over that period.

Skor Sentimen Dana
Skor Sentimen Dana (sebelumnya dikenal sebagai Skor Akumulasi Kepemilikan) menemukan saham-saham yang paling banyak dibeli oleh dana. Ini adalah hasil dari model kuantitatif multi-faktor yang canggih yang mengidentifikasi perusahaan dengan tingkat akumulasi institusional tertinggi. Model penilaian menggunakan kombinasi dari total peningkatan pemilik yang diungkapkan, perubahan dalam alokasi portofolio pada pemilik tersebut, dan metrik lainnya. Angka berkisar dari 0 hingga 100, dengan angka yang lebih tinggi menunjukkan tingkat akumulasi yang lebih tinggi dibandingkan dengan perusahaan sejenisnya, dan 50 adalah rata-ratanya.
Frekuensi Pembaruan: Setiap Hari
Lihat Ownership Explorer, yang menyediakan daftar perusahaan dengan peringkat tertinggi.
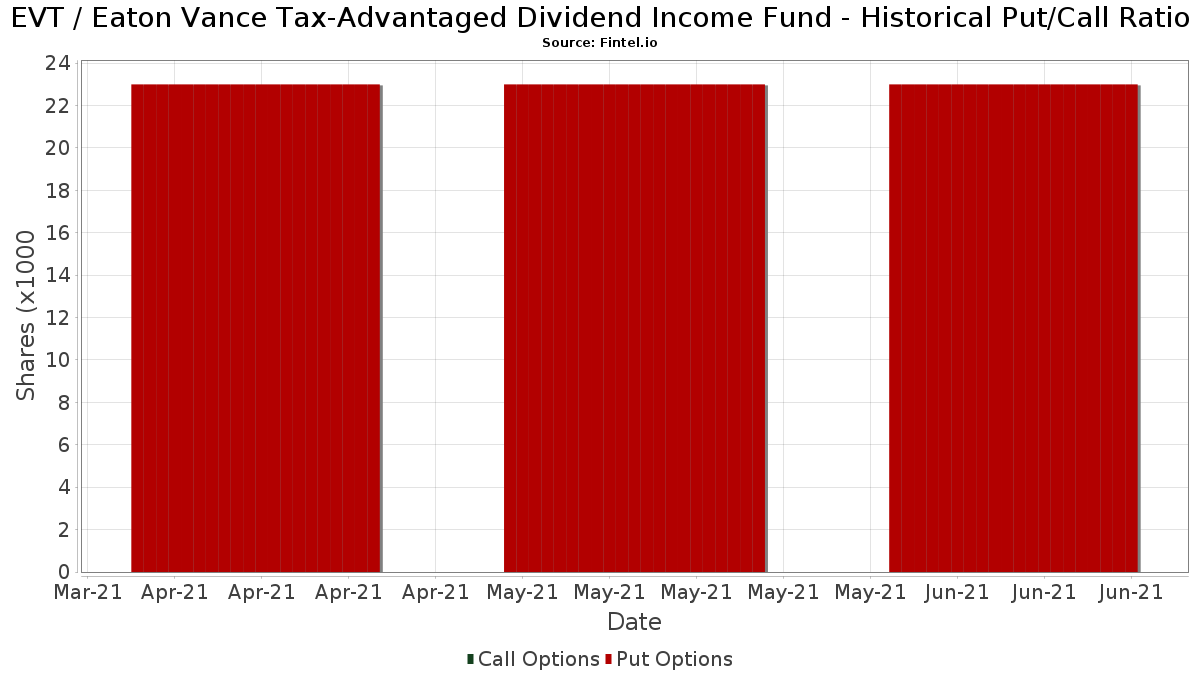
Rasio Put/Call Institusional
Selain melaporkan isu ekuitas dan utang standar, institusi dengan aset di bawah manajemen lebih dari 100 juta dolar AS juga harus mengungkapkan kepemilikan opsi put dan call mereka. Karena opsi put umumnya menunjukkan sentimen negatif, dan opsi call menunjukkan sentimen positif, kita dapat mengetahui sentimen institusional secara keseluruhan dengan memplot rasio put terhadap call. Grafik di sebelah kanan memplot rasio put/call historis untuk instrumen ini.
Menggunakan Rasio Put/Call sebagai indikator sentimen investor mengatasi salah satu kekurangan utama dari penggunaan total kepemilikan institusional, yaitu sejumlah besar aset yang dikelola diinvestasikan secara pasif untuk melacak indeks. Dana yang dikelola secara pasif biasanya tidak membeli opsi, sehingga indikator rasio put/call lebih akurat dalam melacak sentimen dana yang dikelola secara aktif.
Pengajuan 13F dan NPORT
Detail pada pengajuan 13F tersedia gratis. Detail pada pengajuan NP memerlukan keanggotaan premium. Baris berwarna hijau menunjukkan posisi baru. Baris berwarna merah menunjukkan posisi yang sudah ditutup. Klik tautan ini ikon untuk melihat riwayat transaksi selengkapnya.
Tingkatkan
untuk membuka data premium dan mengekspor ke Excel ![]() .
.
| Tanggal File | Sumber | Investor | Ketik | Presyo ng Avg (Silangan) |
Saham | Δ Saham (%) |
Dilaporkan Nilai ($1000) |
Nilai Δ (%) |
Alokasi Port (%) |
|
|---|---|---|---|---|---|---|---|---|---|---|
| 2025-07-14 | 13F | Sowell Financial Services LLC | 26,797 | -11.06 | 646 | -7.99 | ||||
| 2025-08-14 | 13F | Parvin Asset Management, LLC | 2,350 | 0.00 | 57 | 3.70 | ||||
| 2025-08-12 | 13F | Richmond Investment Services, LLC | 34,684 | 100.75 | 836 | 107.71 | ||||
| 2025-08-14 | 13F | Mariner, LLC | 37,622 | 0.67 | 907 | 4.26 | ||||
| 2025-08-01 | 13F | Yukon Wealth Management, Inc. | 0 | -100.00 | 0 | |||||
| 2025-08-13 | 13F | Baird Financial Group, Inc. | 21,535 | 14.34 | 519 | 18.26 | ||||
| 2025-08-18 | 13F | N.E.W. Advisory Services LLC | 2,022 | -6.17 | 49 | -4.00 | ||||
| 2025-08-14 | 13F | Comerica Bank | 8,314 | -1.62 | 200 | 2.04 | ||||
| 2025-08-12 | 13F | Insigneo Advisory Services, Llc | 15,500 | 0.00 | 374 | 3.61 | ||||
| 2025-07-25 | NP | FCEF - First Trust CEF Income Opportunity ETF This fund is a listed as child fund of First Trust Advisors Lp and if that institution has disclosed ownership in this security, then these positions will not be double counted when calculating total shares and total value | 61,484 | 7.09 | 1,429 | 3.85 | ||||
| 2025-08-05 | 13F | GPS Wealth Strategies Group, LLC | 0 | -100.00 | 0 | |||||
| 2025-08-22 | NP | Cornerstone Strategic Value Fund Inc | 140,775 | -42.47 | 3,393 | -40.42 | ||||
| 2025-08-12 | 13F | J.w. Cole Advisors, Inc. | 10,292 | 248 | ||||||
| 2025-08-25 | 13F | Silverlake Wealth Management Llc | 21,769 | 0.00 | 525 | 3.56 | ||||
| 2025-07-14 | 13F | Bank & Trust Co | 2,729 | 0.00 | 66 | 3.17 | ||||
| 2025-07-15 | 13F | Mather Group, Llc. | 0 | -100.00 | 0 | |||||
| 2025-07-16 | 13F | Dakota Wealth Management | 9,340 | 0.00 | 225 | 3.69 | ||||
| 2025-05-14 | 13F | Venture Visionary Partners LLC | 0 | -100.00 | 0 | -100.00 | ||||
| 2025-08-14 | 13F | Hancock Whitney Corp | 10,663 | 0.00 | 257 | 3.23 | ||||
| 2025-07-14 | 13F | GAMMA Investing LLC | 1,500 | 0.00 | 36 | 5.88 | ||||
| 2025-07-29 | 13F | Salomon & Ludwin, LLC | 2,594 | 0.00 | 63 | 5.00 | ||||
| 2025-07-15 | 13F | North Star Investment Management Corp. | 12,260 | -7.37 | 295 | -3.91 | ||||
| 2025-08-06 | 13F | Commonwealth Equity Services, Llc | 203,309 | 2.92 | 5 | 0.00 | ||||
| 2025-08-12 | 13F | Jpmorgan Chase & Co | 136 | -27.27 | 3 | -25.00 | ||||
| 2025-08-14 | 13F | Millennium Management Llc | 0 | -100.00 | 0 | |||||
| 2025-08-06 | 13F | Prospera Financial Services Inc | 26,816 | -3.55 | 646 | 0.00 | ||||
| 2025-08-04 | 13F | Wolverine Asset Management Llc | 69,057 | 8.37 | 1,664 | 12.28 | ||||
| 2025-07-24 | 13F | Financial Security Advisor, Inc. | 12,000 | 9.09 | 289 | 13.33 | ||||
| 2025-05-13 | 13F | Sit Investment Associates Inc | 0 | -100.00 | 0 | |||||
| 2025-08-12 | 13F | NorthStar Asset Management LLC /NJ/ | 9,339 | -0.72 | 225 | 3.21 | ||||
| 2025-08-19 | 13F | Newbridge Financial Services Group, Inc. | 7,296 | 176 | ||||||
| 2025-08-11 | 13F | Private Advisor Group, LLC | 177,497 | -0.30 | 4,278 | 3.26 | ||||
| 2025-08-15 | 13F | Prevail Innovative Wealth Advisors, Llc | 66,918 | 13.71 | 1,613 | 17.75 | ||||
| 2025-07-24 | 13F | IFP Advisors, Inc | 1,700 | 0.00 | 41 | 2.56 | ||||
| 2025-08-13 | 13F | Kayne Anderson Rudnick Investment Management Llc | 10,000 | 0.00 | 241 | 3.88 | ||||
| 2025-07-31 | 13F | Cambridge Investment Research Advisors, Inc. | 70,641 | -20.63 | 2 | -50.00 | ||||
| 2025-08-01 | 13F | Envestnet Asset Management Inc | 11,567 | 279 | ||||||
| 2025-08-28 | NP | Cohen & Steers Closed-end Opportunity Fund, Inc. | 120,913 | -44.37 | 2,914 | -42.38 | ||||
| 2025-08-13 | 13F | McGowan Group Asset Management, Inc. | 833,437 | 0.51 | 20,086 | 4.09 | ||||
| 2025-07-08 | 13F | Morris Retirement Advisors, LLC | 85,401 | 3.53 | 2,058 | 7.24 | ||||
| 2025-07-17 | 13F | Johnson & White Wealth Management, LLC | 14,351 | 47.66 | 0 | |||||
| 2025-08-08 | 13F | Cornerstone Advisors, LLC | 184,683 | -35.69 | 4,451 | -33.41 | ||||
| 2025-08-14 | 13F | Polar Asset Management Partners Inc. | 242,141 | 124.90 | 5,836 | 132.93 | ||||
| 2025-07-16 | 13F | Formidable Asset Management, LLC | 148,841 | 0.00 | 3,464 | 0.00 | ||||
| 2025-08-14 | 13F | Wells Fargo & Company/mn | 675,255 | -1.05 | 16,274 | 2.48 | ||||
| 2025-08-12 | 13F | Cornerstone Wealth Management, LLC | 22,470 | 102.61 | 542 | 109.69 | ||||
| 2025-07-22 | 13F/A | Kingstone Capital Partners Texas, LLC | 300,527 | -10.17 | 7,243 | -6.96 | ||||
| 2025-08-04 | 13F | Spire Wealth Management | 113,200 | 4.79 | 2,728 | 8.56 | ||||
| 2025-08-14 | 13F | Karpus Management, Inc. | 629,393 | -0.93 | 15,168 | 2.60 | ||||
| 2025-07-17 | 13F | Vermillion Wealth Management, Inc. | 832 | 0.00 | 20 | 5.26 | ||||
| 2025-07-22 | 13F | Kessler Investment Group, LLC | 2,024 | -5.60 | 49 | -2.04 | ||||
| 2025-08-20 | NP | ADANX - AQR Diversified Arbitrage Fund Class N | 34,041 | -38.25 | 820 | -36.04 | ||||
| 2025-07-10 | 13F | Wealth Enhancement Advisory Services, Llc | 199,482 | 15.36 | 4,867 | 20.98 | ||||
| 2025-08-13 | 13F | Invesco Ltd. | 20,311 | 0.17 | 489 | 3.82 | ||||
| 2025-07-16 | 13F | ORG Partners LLC | 1,742 | 0.00 | 42 | 5.00 | ||||
| 2025-08-12 | 13F | Heritage Trust Co | 14,888 | -16.83 | 359 | -13.94 | ||||
| 2025-08-13 | 13F | Guggenheim Capital Llc | 357,795 | -5.07 | 8,623 | -1.69 | ||||
| 2025-08-15 | 13F | Morgan Stanley | 930,631 | -0.78 | 22,428 | 2.76 | ||||
| 2025-08-14 | 13F | Colony Group, LLC | 16,862 | -32.31 | 406 | -29.88 | ||||
| 2025-08-13 | 13F | EverSource Wealth Advisors, LLC | 750 | 0.00 | 18 | 5.88 | ||||
| 2025-04-23 | 13F | GHP Investment Advisors, Inc. | 0 | -100.00 | 0 | |||||
| 2025-07-29 | 13F | Stratos Wealth Partners, LTD. | 342,599 | 0.67 | 8,257 | 4.26 | ||||
| 2025-08-11 | 13F | Blue Bell Private Wealth Management, Llc | 900 | 22 | ||||||
| 2025-07-23 | 13F | Joel Isaacson & Co., LLC | 658,913 | -3.56 | 15,880 | -0.13 | ||||
| 2025-08-14 | 13F | Ameriprise Financial Inc | 311,391 | 11.93 | 7,506 | 15.93 | ||||
| 2025-08-14 | 13F | Cnh Partners Llc | 89,732 | -52.65 | 2,163 | -50.36 | ||||
| 2025-08-12 | 13F | CIBC Private Wealth Group, LLC | 2,702 | 0.00 | 65 | 18.18 | ||||
| 2025-07-23 | 13F | Prime Capital Investment Advisors, LLC | 24,251 | -7.00 | 584 | -3.63 | ||||
| 2025-08-12 | 13F | Proequities, Inc. | 0 | 0 | ||||||
| 2025-08-14 | 13F | Snowden Capital Advisors LLC | 21,264 | 0.00 | 512 | 3.64 | ||||
| 2025-08-27 | NP | RYMSX - Guggenheim Multi-Hedge Strategies Fund Class P | 79 | -37.30 | 2 | -50.00 | ||||
| 2025-07-29 | 13F | Commons Capital, Llc | 12,423 | 0.75 | 299 | 4.55 | ||||
| 2025-08-15 | 13F | Tower Research Capital LLC (TRC) | 1 | -90.91 | 0 | |||||
| 2025-08-13 | 13F | Denver Wealth Management, Inc. | 22,689 | -2.12 | 547 | 1.30 | ||||
| 2025-07-25 | 13F | Allspring Global Investments Holdings, LLC | 29,519 | 101.14 | 711 | 108.50 | ||||
| 2025-08-13 | 13F | Northwestern Mutual Wealth Management Co | 1,779 | -28.84 | 43 | -27.59 | ||||
| 2025-08-14 | 13F | Royal Bank Of Canada | 211,425 | 0.01 | 5,096 | 3.60 | ||||
| 2025-08-14 | 13F | Stifel Financial Corp | 55,800 | 3.96 | 1,345 | 7.61 | ||||
| 2025-08-11 | 13F | Principal Securities, Inc. | 950 | 72.73 | 23 | 69.23 | ||||
| 2025-08-13 | 13F | Cresset Asset Management, LLC | 9,264 | 2.15 | 223 | 5.69 | ||||
| 2025-08-07 | 13F | BOK Financial Private Wealth, Inc. | 1,719 | 0.00 | 41 | 2.50 | ||||
| 2025-08-12 | 13F | Advisors Asset Management, Inc. | 251,748 | 1.05 | 6,067 | 4.66 | ||||
| 2025-07-31 | 13F | Oppenheimer & Co Inc | 29,847 | 64.29 | 719 | 70.38 | ||||
| 2025-08-06 | 13F | Smh Capital Advisors Inc | 8,884 | -1.86 | 214 | 1.90 | ||||
| 2025-08-13 | 13F | First Trust Advisors Lp | 124,258 | 2.58 | 2,995 | 6.25 | ||||
| 2025-04-29 | 13F | Truist Financial Corp | 0 | -100.00 | 0 | |||||
| 2025-04-08 | 13F | Parallel Advisors, LLC | 0 | -100.00 | 0 | -100.00 | ||||
| 2025-08-08 | 13F | 1776 Wealth LLC | 72,608 | -0.82 | 1,750 | 2.70 | ||||
| 2025-08-14 | 13F | CoreCap Advisors, LLC | 4,129 | 0.00 | 100 | 3.13 | ||||
| 2025-07-07 | 13F | Wealth Alliance Advisory Group, LLC | 17,037 | 0.00 | 411 | 3.54 | ||||
| 2025-07-21 | 13F | Future Financial Wealth Managment LLC | 1,468 | 2.16 | 35 | 6.06 | ||||
| 2025-08-18 | 13F | Hollencrest Capital Management | 37,855 | 0.00 | 912 | 3.64 | ||||
| 2025-04-29 | 13F | Penserra Capital Management LLC | 0 | -100.00 | 0 | |||||
| 2025-07-10 | 13F | Perkins Coie Trust Co | 500 | 0.00 | 12 | 9.09 | ||||
| 2025-08-11 | 13F | Elequin Capital Lp | 1,275 | 31 | ||||||
| 2025-08-08 | 13F | Pnc Financial Services Group, Inc. | 12,751 | -41.14 | 307 | -39.09 | ||||
| 2025-06-27 | NP | Calamos ETF Trust - Calamos CEF Income & Arbitrage ETF | 12,903 | -11.54 | 287 | -19.83 | ||||
| 2025-08-12 | 13F | Steward Partners Investment Advisory, Llc | 93,018 | -8.23 | 2,242 | -4.96 | ||||
| 2025-08-08 | 13F | Avantax Advisory Services, Inc. | 19,909 | 3.15 | 480 | 6.68 | ||||
| 2025-07-08 | 13F | Nbc Securities, Inc. | 4,350 | 0.00 | 0 | |||||
| 2025-07-11 | 13F | Farther Finance Advisors, LLC | 803 | 0.00 | 19 | 5.56 | ||||
| 2025-07-25 | 13F | Concurrent Investment Advisors, LLC | 11,511 | 14.75 | 277 | 18.88 | ||||
| 2025-07-28 | 13F | RFG Advisory, LLC | 24,901 | -24.68 | 600 | -21.98 | ||||
| 2025-04-15 | 13F | Fifth Third Bancorp | 0 | -100.00 | 0 | -100.00 | ||||
| 2025-08-14 | 13F | Two Sigma Investments, Lp | 81,682 | 1,969 | ||||||
| 2025-07-25 | 13F | Cwm, Llc | 6,221 | 0.00 | 0 | |||||
| 2025-07-15 | 13F | Xcel Wealth Management, LLC | 11,370 | 0.00 | 274 | 3.79 | ||||
| 2025-08-07 | 13F | Allworth Financial LP | 9,863 | -0.10 | 238 | 9.22 | ||||
| 2025-07-17 | 13F | Sound Income Strategies, LLC | 298 | 10.78 | 7 | 16.67 | ||||
| 2025-08-14 | 13F | Wiley Bros.-aintree Capital, Llc | 42,399 | 164.93 | 1,022 | 175.95 | ||||
| 2025-08-06 | 13F | Stonebridge Financial Planning Group, LLC | 13,403 | 3.10 | 323 | 6.95 | ||||
| 2025-08-12 | 13F | Financial Advocates Investment Management | 0 | -100.00 | 0 | |||||
| 2025-07-21 | 13F | Kennebec Savings Bank | 589 | 0.00 | 14 | 7.69 | ||||
| 2025-08-14 | 13F/A | Rockefeller Capital Management L.P. | 217,388 | -0.82 | 5,239 | 2.73 | ||||
| 2025-08-14 | 13F | Aqr Capital Management Llc | 22,505 | 542 | ||||||
| 2025-05-08 | 13F | Plante Moran Financial Advisors, LLC | 0 | -100.00 | 0 | |||||
| 2025-07-16 | 13F | St Germain D J Co Inc | 293 | 0.00 | 7 | 16.67 | ||||
| 2025-07-28 | 13F | Harbour Investments, Inc. | 3,450 | 0.00 | 83 | 3.75 | ||||
| 2025-08-08 | 13F | Meridian Wealth Management, LLC | 38,483 | 13.88 | 927 | 17.94 | ||||
| 2025-08-14 | 13F | Mml Investors Services, Llc | 47,885 | 8.26 | 1 | 0.00 | ||||
| 2025-09-04 | 13F/A | Advisor Group Holdings, Inc. | 227,074 | 7.61 | 5,473 | 11.45 | ||||
| 2025-07-17 | 13F | Janney Montgomery Scott LLC | 48,380 | 1.97 | 1 | 0.00 | ||||
| 2025-08-07 | 13F | Vista Investment Partners Ii, Llc | 8,496 | 205 | ||||||
| 2025-06-30 | 13F/A | Deutsche Bank Ag\ | 0 | -100.00 | 0 | |||||
| 2025-07-24 | 13F | Us Bancorp \de\ | 8,200 | 0.00 | 198 | 3.68 | ||||
| 2025-07-09 | 13F | Dynamic Advisor Solutions LLC | 10,890 | 4.56 | 262 | 8.26 | ||||
| 2025-07-21 | 13F | Ameritas Advisory Services, LLC | 2,700 | 65 | ||||||
| 2025-08-14 | 13F | 1607 Capital Partners, LLC | 750,342 | 35.99 | 18,083 | 40.84 | ||||
| 2025-08-27 | NP | RYDEX VARIABLE TRUST - Multi-Hedge Strategies Fund Variable Annuity | 133 | -18.40 | 3 | 0.00 | ||||
| 2025-08-13 | 13F | Jones Financial Companies Lllp | 60 | 1 | ||||||
| 2025-08-14 | 13F | MGB Wealth Management, LLC | 11,467 | -36.06 | 276 | -34.91 | ||||
| 2025-05-05 | 13F | Transce3nd, LLC | 0 | -100.00 | 0 | |||||
| 2025-08-08 | 13F | Cetera Investment Advisers | 123,973 | 3.28 | 2,988 | 6.95 | ||||
| 2025-08-14 | 13F | Raymond James Financial Inc | 829,247 | 17.15 | 19,985 | 21.33 | ||||
| 2025-08-08 | 13F | TD Capital Management LLC | 631 | 0.00 | 15 | 7.14 | ||||
| 2025-08-22 | NP | Cornerstone Total Return Fund Inc | 43,908 | 3.29 | 1,058 | 6.98 | ||||
| 2025-08-04 | 13F | Kovack Advisors, Inc. | 17,132 | 413 | ||||||
| 2025-08-12 | 13F | LPL Financial LLC | 434,417 | 1.58 | 10,469 | 5.19 | ||||
| 2025-08-04 | 13F | Live Oak Private Wealth LLC | 24,589 | 0.00 | 593 | 3.50 | ||||
| 2025-08-12 | 13F | Putnam Fl Investment Management Co | 20,000 | 0.00 | 482 | 3.66 | ||||
| 2025-08-14 | 13F | Cohen & Steers, Inc. | 117,413 | -45.98 | 3 | -60.00 | ||||
| 2025-07-07 | 13F | Investors Research Corp | 3,145 | 0.00 | 76 | 2.74 | ||||
| 2025-08-14 | 13F | Fiduciary Trust Co | 15,457 | 0.00 | 373 | 3.62 | ||||
| 2025-07-25 | 13F | Atria Wealth Solutions, Inc. | 13,712 | 17.72 | 330 | 21.77 | ||||
| 2025-08-14 | 13F | UBS Group AG | 883,785 | -4.49 | 21,299 | -1.08 | ||||
| 2025-08-05 | 13F | Huntington National Bank | 0 | |||||||
| 2025-08-14 | 13F | Bank Of America Corp /de/ | 927,449 | 1.93 | 22,352 | 5.56 | ||||
| 2025-08-07 | 13F | Readystate Asset Management Lp | 10,435 | 251 | ||||||
| 2025-08-05 | 13F | Shaker Financial Services, LLC | 117,919 | -59.14 | 2,842 | -57.69 | ||||
| 2025-08-14 | 13F | GWM Advisors LLC | 14,331 | 174.38 | 345 | 185.12 | ||||
| 2025-08-15 | 13F | CI Private Wealth, LLC | 27,827 | 0.00 | 671 | 3.55 | ||||
| 2025-07-22 | 13F | Accel Wealth Management | 108,641 | -1.27 | 2,618 | 2.27 | ||||
| 2025-08-12 | 13F | Founders Financial Alliance, LLC | 35,108 | 1.37 | 846 | 5.09 | ||||
| 2025-08-07 | 13F | Kestra Private Wealth Services, Llc | 12,761 | -12.55 | 308 | -9.44 | ||||
| 2025-08-08 | 13F | Kingsview Wealth Management, LLC | 14,103 | 0.06 | 340 | 3.35 | ||||
| 2025-08-12 | 13F | AlphaCore Capital LLC | 13,316 | 9.46 | 321 | 13.07 | ||||
| 2025-08-11 | 13F | HighTower Advisors, LLC | 49,918 | 0.61 | 1,203 | 4.25 | ||||
| 2025-07-14 | 13F | Armstrong Advisory Group, Inc | 544 | 13 | ||||||
| 2025-08-13 | 13F | Summit Financial, LLC | 18,740 | 452 | ||||||
| 2025-08-12 | 13F | Virtu Financial LLC | 0 | -100.00 | 0 | |||||
| 2025-08-12 | 13F | MAI Capital Management | 492 | 0.00 | 12 | 0.00 | ||||
| 2025-07-22 | 13F | DAVENPORT & Co LLC | 18,899 | -4.06 | 455 | -0.66 | ||||
| 2025-08-29 | 13F | Evolution Wealth Management Inc. | 371 | 9 | ||||||
| 2025-08-04 | 13F | Hantz Financial Services, Inc. | 2 | 0 | ||||||
| 2025-07-29 | 13F | Private Trust Co Na | 5,136 | 0.67 | 124 | 4.24 | ||||
| 2025-08-08 | 13F | Calamos Advisors LLC | 12,903 | -8.00 | 311 | -4.91 | ||||
| 2025-08-05 | 13F | Summit Investment Advisory Services, LLC | 0 | -100.00 | 0 | |||||
| 2025-08-08 | 13F | Creative Planning | 24,736 | 13.76 | 596 | 18.02 |