Mga Batayang Estadistika
| Pemilik Institusional | 251 total, 251 long only, 0 short only, 0 long/short - change of -8.06% MRQ |
| Alokasi Portofolio Rata-rata | 0.0745 % - change of -14.30% MRQ |
| Saham Institusional (Jangka Panjang) | 3,176,863 (ex 13D/G) - change of -0.25MM shares -7.25% MRQ |
| Nilai Institusional (Jangka Panjang) | $ 492,406 USD ($1000) |
Kepemilikan Institusional dan Pemegang Saham
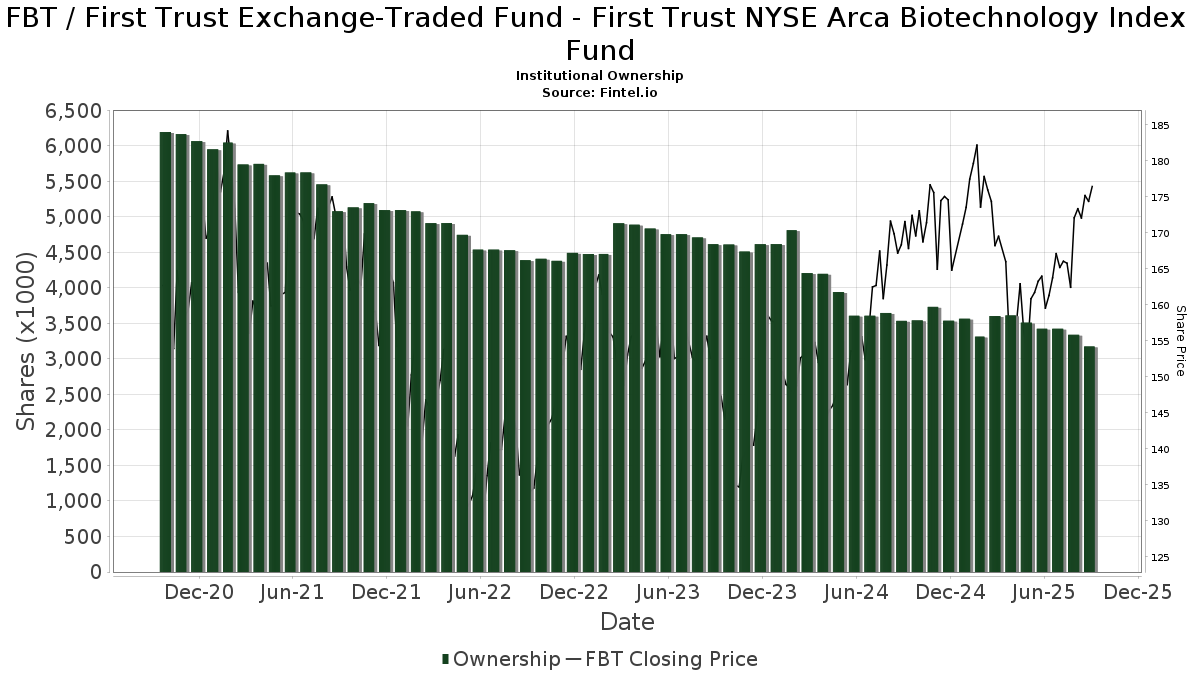
First Trust Exchange-Traded Fund - First Trust NYSE Arca Biotechnology Index Fund (US:FBT) memiliki 251 pemilik institusional dan pemegang saham yang telah mengajukan formulir 13D/G atau 13F kepada Komisi Bursa Efek (Securities Exchange Commission/SEC). Lembaga-lembaga ini memegang total 3,176,863 saham. Pemegang saham terbesar meliputi Morgan Stanley, LPL Financial LLC, Bank Of America Corp /de/, Wells Fargo & Company/mn, UBS Group AG, Royal Bank Of Canada, Raymond James Financial Inc, Envestnet Asset Management Inc, Berger Financial Group, Inc, and Goldman Sachs Group Inc .
Struktur kepemilikan institusional First Trust Exchange-Traded Fund - First Trust NYSE Arca Biotechnology Index Fund (ARCA:FBT) menunjukkan posisi terkini di perusahaan oleh institusi dan dana, serta perubahan terbaru dalam ukuran posisi. Pemegang saham utama dapat mencakup investor individu, reksa dana, dana lindung nilai, atau institusi. Jadwal 13D menunjukkan bahwa investor memegang (atau pernah memegang) lebih dari 5% saham perusahaan dan bermaksud (atau pernah bermaksud) untuk secara aktif mengejar perubahan strategi bisnis. Jadwal 13G menunjukkan investasi pasif lebih dari 5%.
The share price as of September 5, 2025 is 178.54 / share. Previously, on September 9, 2024, the share price was 166.15 / share. This represents an increase of 7.46% over that period.
Skor Sentimen Dana
Skor Sentimen Dana (sebelumnya dikenal sebagai Skor Akumulasi Kepemilikan) menemukan saham-saham yang paling banyak dibeli oleh dana. Ini adalah hasil dari model kuantitatif multi-faktor yang canggih yang mengidentifikasi perusahaan dengan tingkat akumulasi institusional tertinggi. Model penilaian menggunakan kombinasi dari total peningkatan pemilik yang diungkapkan, perubahan dalam alokasi portofolio pada pemilik tersebut, dan metrik lainnya. Angka berkisar dari 0 hingga 100, dengan angka yang lebih tinggi menunjukkan tingkat akumulasi yang lebih tinggi dibandingkan dengan perusahaan sejenisnya, dan 50 adalah rata-ratanya.
Frekuensi Pembaruan: Setiap Hari
Lihat Ownership Explorer, yang menyediakan daftar perusahaan dengan peringkat tertinggi.
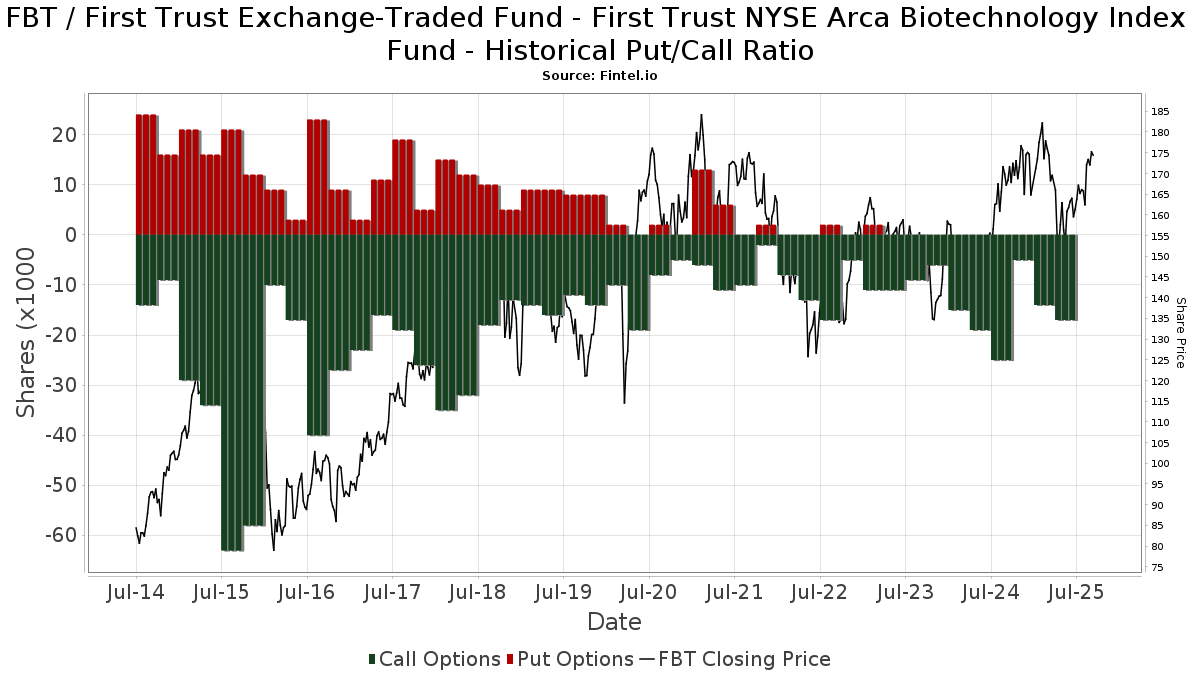
Rasio Put/Call Institusional
Selain melaporkan isu ekuitas dan utang standar, institusi dengan aset di bawah manajemen lebih dari 100 juta dolar AS juga harus mengungkapkan kepemilikan opsi put dan call mereka. Karena opsi put umumnya menunjukkan sentimen negatif, dan opsi call menunjukkan sentimen positif, kita dapat mengetahui sentimen institusional secara keseluruhan dengan memplot rasio put terhadap call. Grafik di sebelah kanan memplot rasio put/call historis untuk instrumen ini.
Menggunakan Rasio Put/Call sebagai indikator sentimen investor mengatasi salah satu kekurangan utama dari penggunaan total kepemilikan institusional, yaitu sejumlah besar aset yang dikelola diinvestasikan secara pasif untuk melacak indeks. Dana yang dikelola secara pasif biasanya tidak membeli opsi, sehingga indikator rasio put/call lebih akurat dalam melacak sentimen dana yang dikelola secara aktif.
Pengajuan 13F dan NPORT
Detail pada pengajuan 13F tersedia gratis. Detail pada pengajuan NP memerlukan keanggotaan premium. Baris berwarna hijau menunjukkan posisi baru. Baris berwarna merah menunjukkan posisi yang sudah ditutup. Klik tautan ini ikon untuk melihat riwayat transaksi selengkapnya.
Tingkatkan
untuk membuka data premium dan mengekspor ke Excel ![]() .
.
| Tanggal File | Sumber | Investor | Ketik | Presyo ng Avg (Silangan) |
Saham | Δ Saham (%) |
Dilaporkan Nilai ($1000) |
Nilai Δ (%) |
Alokasi Port (%) |
|
|---|---|---|---|---|---|---|---|---|---|---|
| 2025-08-05 | 13F | Tsfg, Llc | 441 | 0.00 | 0 | |||||
| 2025-08-04 | 13F | Kovack Advisors, Inc. | 1,568 | -3.09 | 253 | -8.36 | ||||
| 2025-08-13 | 13F | Brown Advisory Inc | 10,489 | 0.00 | 1,692 | -5.16 | ||||
| 2025-05-15 | 13F/A | Orion Portfolio Solutions, LLC | 18,483 | 236.54 | 1,657 | 81.58 | ||||
| 2025-08-07 | 13F | Kestra Private Wealth Services, Llc | 8,984 | 2.98 | 1,449 | -2.36 | ||||
| 2025-04-11 | 13F | Davis Capital Management | 22 | 0.00 | 4 | 0.00 | ||||
| 2025-08-13 | 13F | Summit Financial, LLC | 3,704 | -51.64 | 598 | -54.15 | ||||
| 2025-08-12 | 13F | Park Square Financial Group, LLC | 244 | -61.76 | 39 | -63.89 | ||||
| 2025-08-14 | 13F | Comerica Bank | 1,339 | 4.20 | 216 | -1.38 | ||||
| 2025-08-12 | 13F | Resolute Wealth Strategies, LLC | 0 | -100.00 | 0 | |||||
| 2025-08-12 | 13F | Jacobi Capital Management LLC | 1,374 | -1.43 | 222 | -6.75 | ||||
| 2025-08-14 | 13F | Main Street Financial Solutions, LLC | 0 | -100.00 | 0 | |||||
| 2025-07-10 | 13F | Sovran Advisors, LLC | 1,599 | 3.23 | 263 | 11.49 | ||||
| 2025-08-14 | 13F | Goldman Sachs Group Inc | 55,052 | 37.10 | 8,882 | 30.03 | ||||
| 2025-08-07 | 13F | PFG Advisors | 1,741 | -35.37 | 281 | -38.86 | ||||
| 2025-07-08 | 13F | Webster Bank, N. A. | 238 | 0.00 | 38 | -5.00 | ||||
| 2025-08-14 | 13F | Avenir Tech Ltd | 1 | 0.00 | 0 | |||||
| 2025-07-17 | 13F | Janney Montgomery Scott LLC | 28,270 | 1.37 | 5 | 0.00 | ||||
| 2025-07-17 | 13F | Beacon Capital Management, LLC | 80 | 0.00 | 13 | -7.69 | ||||
| 2025-08-12 | 13F | SRS Capital Advisors, Inc. | 5,537 | 1.10 | 893 | -4.08 | ||||
| 2025-07-22 | 13F | Mascoma Wealth Management LLC | 98 | 0.00 | 16 | -6.25 | ||||
| 2025-07-07 | 13F | Thurston, Springer, Miller, Herd & Titak, Inc. | 1,257 | -0.63 | 203 | -5.58 | ||||
| 2025-07-28 | 13F | RFG Advisory, LLC | 1,407 | -28.25 | 227 | -31.83 | ||||
| 2025-04-10 | 13F | Richard P Slaughter Associates Inc | 0 | -100.00 | 0 | |||||
| 2025-08-11 | 13F | Covestor Ltd | 13 | 0.00 | 0 | |||||
| 2025-08-11 | 13F | Citigroup Inc | 12,161 | -3.59 | 1,962 | -8.58 | ||||
| 2025-08-04 | 13F | Pensionmark Financial Group, Llc | 8,134 | 4.14 | 1,312 | -1.20 | ||||
| 2025-07-14 | 13F | Sowell Financial Services LLC | 1,629 | -2.34 | 263 | -7.42 | ||||
| 2025-09-04 | 13F/A | Advisor Group Holdings, Inc. | 37,843 | -9.01 | 6,108 | -13.72 | ||||
| 2025-08-11 | 13F | Synergy Investment Management, LLC | 0 | -100.00 | 0 | |||||
| 2025-08-12 | 13F | NFP Retirement, Inc. | 6,725 | 0.00 | 1,085 | -5.24 | ||||
| 2025-08-12 | 13F | Steward Partners Investment Advisory, Llc | 1,664 | -39.80 | 269 | -42.98 | ||||
| 2025-08-12 | 13F | LPL Financial LLC | 193,773 | 5.42 | 31,261 | -0.03 | ||||
| 2025-04-24 | 13F | Kraft, Davis & Associates, LLC | 0 | -100.00 | 0 | |||||
| 2025-08-06 | 13F | Savant Capital, LLC | 0 | -100.00 | 0 | |||||
| 2025-08-15 | 13F | Puff Wealth Management, Llc | 1,308 | -24.31 | 211 | -28.23 | ||||
| 2025-07-29 | 13F | Koshinski Asset Management, Inc. | 3,086 | -2.31 | 498 | -7.45 | ||||
| 2025-08-11 | 13F | GKV Capital Management Co., Inc. | 0 | -100.00 | 0 | -100.00 | ||||
| 2025-07-14 | 13F | GAMMA Investing LLC | 566 | 0.00 | 91 | -5.21 | ||||
| 2025-08-04 | 13F | Daymark Wealth Partners, Llc | 5,751 | 9.52 | 928 | 3.81 | ||||
| 2025-08-08 | 13F | Capital Investment Advisory Services, LLC | 111 | -68.56 | 18 | -71.67 | ||||
| 2025-08-06 | 13F | Commonwealth Equity Services, Llc | 35,769 | -9.42 | 6 | -16.67 | ||||
| 2025-08-13 | 13F | Stablepoint Partners, LLC | 4,468 | 3.00 | 721 | -2.31 | ||||
| 2025-08-12 | 13F | Quantum Private Wealth, LLC | 5,060 | -26.49 | 816 | -30.26 | ||||
| 2025-07-21 | 13F | Ameritas Advisory Services, LLC | 36,463 | -5.11 | 5,883 | -9.99 | ||||
| 2025-08-11 | 13F | United Advisor Group, LLC | 0 | -100.00 | 0 | |||||
| 2025-07-14 | 13F | Clear Harbor Asset Management, LLC | 8,132 | -5.80 | 1,312 | -10.69 | ||||
| 2025-08-13 | 13F | Dynamic Wealth Strategies, LLC | 465 | 0.00 | 75 | -5.06 | ||||
| 2025-08-13 | 13F | Northwestern Mutual Wealth Management Co | 12,413 | -3.45 | 2,003 | -8.46 | ||||
| 2025-08-01 | 13F | Rossby Financial, LCC | 65 | 0.00 | 10 | 0.00 | ||||
| 2025-07-10 | 13F | Global Financial Private Client, LLC | 0 | -100.00 | 0 | |||||
| 2025-08-12 | 13F | Coldstream Capital Management Inc | 0 | -100.00 | 0 | |||||
| 2025-08-14 | 13F | Mariner, LLC | 2,725 | 116.61 | 440 | 105.14 | ||||
| 2025-07-17 | 13F | Global Trust Asset Management, LLC | 80 | 0.00 | 13 | -7.69 | ||||
| 2025-08-06 | 13F | RFG - Bristol Wealth Advisors, LLC | 0 | -100.00 | 0 | |||||
| 2025-08-08 | 13F | Creative Planning | 4,473 | 22.35 | 722 | 15.92 | ||||
| 2025-07-31 | 13F | Hartford Financial Management Inc. | 30,597 | -3.19 | 4,936 | -8.18 | ||||
| 2025-08-11 | 13F | Hexagon Capital Partners LLC | 0 | -100.00 | 0 | |||||
| 2025-08-15 | 13F | Morgan Stanley | 345,245 | -4.25 | 55,699 | -9.19 | ||||
| 2025-08-13 | 13F | Luminist Capital LLC | 1 | 0.00 | 0 | |||||
| 2025-08-14 | 13F | Wharton Business Group, LLC | 0 | -100.00 | 0 | |||||
| 2025-08-05 | 13F | GPS Wealth Strategies Group, LLC | 2,733 | 16.00 | 441 | 10.00 | ||||
| 2025-08-14 | 13F | Headlands Technologies LLC | 55 | 0.00 | 9 | -11.11 | ||||
| 2025-07-31 | 13F | Oppenheimer & Co Inc | 2,958 | -49.77 | 477 | -52.35 | ||||
| 2025-08-11 | 13F | SFI Advisors, LLC | 23,797 | -4.71 | 3,839 | -9.63 | ||||
| 2025-08-14 | 13F | C M Bidwell & Associates Ltd | 75 | 0.00 | 12 | 0.00 | ||||
| 2025-07-28 | 13F | Mutual Advisors, LLC | 5,206 | 2.00 | 865 | 6.27 | ||||
| 2025-08-14 | 13F | Great Valley Advisor Group, Inc. | 3,547 | -3.74 | 573 | -8.77 | ||||
| 2025-08-14 | 13F | Colony Group, LLC | 0 | -100.00 | 0 | |||||
| 2025-07-25 | 13F | Cwm, Llc | 5,387 | -4.86 | 1 | |||||
| 2025-08-06 | 13F | Adviser Investments LLC | 4,431 | -12.55 | 715 | -17.07 | ||||
| 2025-07-24 | 13F | Robertson Stephens Wealth Management, LLC | 3,677 | 18.57 | 593 | 12.52 | ||||
| 2025-08-14 | 13F | GWM Advisors LLC | 5,481 | 9.95 | 884 | 4.37 | ||||
| 2025-08-13 | 13F | Cerity Partners LLC | 0 | -100.00 | 0 | |||||
| 2025-07-08 | 13F | Atwood & Palmer Inc | 75 | 0.00 | 12 | 0.00 | ||||
| 2025-07-23 | 13F | Clear Creek Financial Management, LLC | 2,664 | -34.61 | 430 | -38.01 | ||||
| 2025-08-14 | 13F | Fmr Llc | 983 | -18.49 | 159 | -22.93 | ||||
| 2025-07-17 | 13F | Independence Bank of Kentucky | 200 | 0.00 | 32 | -5.88 | ||||
| 2025-08-01 | 13F | Envestnet Asset Management Inc | 120,485 | 4.28 | 19,438 | -1.11 | ||||
| 2025-08-12 | 13F | Founders Financial Alliance, LLC | 0 | -100.00 | 0 | |||||
| 2025-07-14 | 13F | Hoey Investments, Inc | 15 | 0.00 | 2 | 0.00 | ||||
| 2025-07-22 | 13F | Belpointe Asset Management LLC | 1,252 | 0.00 | 202 | -5.16 | ||||
| 2025-08-12 | 13F | Franklin Resources Inc | 89 | 14 | ||||||
| 2025-08-14 | 13F | Royal Bank Of Canada | 153,673 | -3.22 | 24,792 | -8.22 | ||||
| 2025-07-14 | 13F | Signature Securities Group Corporation | 3,906 | -0.41 | 630 | -5.55 | ||||
| 2025-08-11 | 13F | Novak & Powell Financial Services, Inc. | 1,512 | 0.00 | 244 | -5.45 | ||||
| 2025-07-16 | 13F | RWM Asset Management, LLC | 1,938 | 0.00 | 313 | -5.17 | ||||
| 2025-08-13 | 13F | Twin Peaks Wealth Advisors, LLC | 2,054 | -2.84 | 343 | 4.57 | ||||
| 2025-07-30 | 13F | Financial Perspectives, Inc | 148 | 0.00 | 24 | -8.00 | ||||
| 2025-04-10 | 13F | Clarus Wealth Advisors | 0 | -100.00 | 0 | |||||
| 2025-08-08 | 13F | Pnc Financial Services Group, Inc. | 894 | -16.45 | 144 | -20.88 | ||||
| 2025-05-09 | 13F | Altfest L J & Co Inc | 0 | -100.00 | 0 | |||||
| 2025-08-15 | 13F | Kestra Advisory Services, LLC | 16,286 | -2.02 | 2,627 | -7.07 | ||||
| 2025-08-12 | 13F | BlackRock, Inc. | 3,297 | -1.23 | 532 | -6.35 | ||||
| 2025-07-01 | 13F | Harbor Investment Advisory, Llc | 615 | 0.00 | 99 | -4.81 | ||||
| 2025-08-04 | 13F | Center for Financial Planning, Inc. | 175 | 0.00 | 28 | -3.45 | ||||
| 2025-05-06 | 13F | Venturi Wealth Management, LLC | 0 | -100.00 | 0 | |||||
| 2025-08-12 | 13F | RPG Investment Advisory, LLC | 24,771 | -52.45 | 3,996 | -54.91 | ||||
| 2025-07-29 | 13F | Stratos Wealth Partners, LTD. | 1,621 | 3.84 | 262 | -1.51 | ||||
| 2025-07-21 | 13F | Barrett & Company, Inc. | 905 | -5.73 | 146 | -10.43 | ||||
| 2025-07-24 | 13F | McKinley Carter Wealth Services, Inc. | 7,358 | 0.00 | 1,187 | -5.12 | ||||
| 2025-08-15 | 13F | Captrust Financial Advisors | 4,028 | -3.03 | 650 | -8.07 | ||||
| 2025-08-07 | 13F | Allworth Financial LP | 5,993 | 19.50 | 967 | 20.15 | ||||
| 2025-08-06 | 13F | Texas Yale Capital Corp. | 9,300 | 0.00 | 1,500 | -5.18 | ||||
| 2025-07-23 | 13F | REAP Financial Group, LLC | 980 | 0.00 | 158 | -4.82 | ||||
| 2025-08-14 | 13F | Snowden Capital Advisors LLC | 6,243 | -7.37 | 1,007 | -12.13 | ||||
| 2025-08-14 | 13F | Stifel Financial Corp | 45,577 | 7.91 | 7,353 | 2.34 | ||||
| 2025-08-04 | 13F | Creative Financial Designs Inc /adv | 356 | 8.21 | 57 | 1.79 | ||||
| 2025-07-25 | 13F | Sequoia Financial Advisors, LLC | 1,625 | -8.45 | 262 | -12.96 | ||||
| 2025-07-28 | 13F | Arlington Financial Advisors, LLC | 26,710 | 4,309 | ||||||
| 2025-07-08 | 13F | Nbc Securities, Inc. | 1,130 | -17.28 | 0 | |||||
| 2025-07-30 | 13F | Whittier Trust Co Of Nevada Inc | 85 | -19.05 | 14 | -23.53 | ||||
| 2025-07-22 | 13F | Berger Financial Group, Inc | 113,019 | 1.84 | 18,233 | -3.42 | ||||
| 2025-07-17 | 13F | Tritonpoint Wealth, Llc | 2,280 | 0.00 | 368 | -5.17 | ||||
| 2025-07-08 | 13F | Juncture Wealth Strategies, Llc | 11,073 | -3.73 | 1,786 | -8.69 | ||||
| 2025-08-12 | 13F | Global Retirement Partners, LLC | 2,108 | -9.64 | 340 | -12.14 | ||||
| 2025-08-12 | 13F | O'shaughnessy Asset Management, Llc | 25 | 0.00 | 4 | 0.00 | ||||
| 2025-07-21 | 13F | Cornell Pochily Investment Advisors, Inc. | 0 | -100.00 | 0 | |||||
| 2025-07-25 | 13F | Hazlett, Burt & Watson, Inc. | 100 | 0 | ||||||
| 2025-08-12 | 13F | Jpmorgan Chase & Co | 13,716 | -6.71 | 2,213 | -11.56 | ||||
| 2025-08-14 | 13F | Sherman Asset Management, Inc. | 0 | -100.00 | 0 | |||||
| 2025-08-06 | 13F | AE Wealth Management LLC | 11,063 | -9.98 | 1,785 | -14.64 | ||||
| 2025-08-08 | 13F | Meridian Wealth Management, LLC | 3,498 | 0.00 | 564 | -5.21 | ||||
| 2025-08-18 | 13F | Pacific Center for Financial Services | 52 | 0.00 | 8 | 0.00 | ||||
| 2025-07-16 | 13F | Diversified Enterprises, LLC | 2,417 | 0.00 | 390 | -5.35 | ||||
| 2025-07-31 | 13F | Cambridge Investment Research Advisors, Inc. | 35,338 | 13.77 | 6 | 0.00 | ||||
| 2025-08-14 | 13F | Sunbelt Securities, Inc. | 90 | 5.88 | 15 | 0.00 | ||||
| 2025-08-05 | 13F | Sigma Planning Corp | 1,282 | -10.10 | 207 | -14.88 | ||||
| 2025-07-15 | 13F | MCF Advisors LLC | 120 | 0.00 | 19 | -5.00 | ||||
| 2025-08-14 | 13F | UBS Group AG | 160,352 | -20.32 | 25,870 | -24.43 | ||||
| 2025-08-08 | 13F | TD Capital Management LLC | 1,148 | 0.00 | 185 | -5.13 | ||||
| 2025-08-15 | 13F | CI Private Wealth, LLC | 4,290 | 692 | ||||||
| 2025-08-11 | 13F | Western Wealth Management, LLC | 0 | -100.00 | 0 | |||||
| 2025-08-08 | 13F | Hartland & Co., LLC | 1,179 | 0.00 | 190 | -5.00 | ||||
| 2025-08-13 | 13F | Transce3nd, LLC | 13 | -27.78 | 2 | -33.33 | ||||
| 2025-08-14 | 13F | Citadel Advisors Llc | Put | 0 | -100.00 | 0 | ||||
| 2025-08-13 | 13F | Beacon Pointe Advisors, LLC | 7,076 | 8.06 | 1,142 | 2.52 | ||||
| 2025-07-10 | 13F | American Financial Advisors, LLC | 2,057 | 0.00 | 332 | -5.16 | ||||
| 2025-07-28 | 13F | Harbour Investments, Inc. | 5,767 | 1.21 | 930 | -4.02 | ||||
| 2025-08-08 | 13F | New England Capital Financial Advisors LLC | 97 | 0.00 | 16 | -6.25 | ||||
| 2025-08-14 | 13F | Ancora Advisors, LLC | 9,756 | -0.24 | 1,574 | -5.41 | ||||
| 2025-07-17 | 13F | Wagner Wealth Management, Llc | 177 | -2.75 | 29 | -6.67 | ||||
| 2025-08-14 | 13F | IHT Wealth Management, LLC | 1,348 | 0.00 | 217 | -5.24 | ||||
| 2025-05-01 | 13F | Quest 10 Wealth Builders, Inc. | 16 | 0.00 | 3 | 0.00 | ||||
| 2025-05-05 | 13F | OneAscent Financial Services LLC | 0 | -100.00 | 0 | |||||
| 2025-07-24 | 13F | Stonebridge Financial Group, LLC | 0 | -100.00 | 0 | |||||
| 2025-08-08 | 13F | Cetera Investment Advisers | 45,416 | 4.92 | 7,327 | -0.50 | ||||
| 2025-08-20 | 13F | Forefront Wealth Partners, LLC | 3,115 | 507 | ||||||
| 2025-07-25 | 13F | Apollon Wealth Management, LLC | 3,864 | -9.21 | 623 | -13.95 | ||||
| 2025-08-15 | 13F | Tower Research Capital LLC (TRC) | 9 | 350.00 | 1 | |||||
| 2025-07-24 | 13F | WMG Financial Advisors, LLC | 2,896 | -12.38 | 467 | -16.90 | ||||
| 2025-08-05 | 13F | Plante Moran Financial Advisors, LLC | 37 | 0.00 | 6 | -16.67 | ||||
| 2025-07-14 | 13F | Iams Wealth Management, Llc | 5,897 | 11.24 | 951 | 5.55 | ||||
| 2025-08-11 | 13F | Independent Advisor Alliance | 28,242 | 17.24 | 4,556 | 11.18 | ||||
| 2025-08-11 | 13F | Wbi Investments, Inc. | 1,500 | 242 | ||||||
| 2025-07-30 | 13F | Pacific Sun Financial Corp | 8,100 | -3.40 | 1,307 | -8.42 | ||||
| 2025-08-14 | 13F | Raymond James Financial Inc | 144,291 | -7.80 | 23,278 | -12.56 | ||||
| 2025-07-21 | 13F | Mechanics Financial Corp | 122 | 0.00 | 20 | -5.00 | ||||
| 2025-07-09 | 13F | WealthCare Investment Partners, LLC | 1,476 | -0.07 | 242 | 8.52 | ||||
| 2025-07-22 | 13F/A | Kingstone Capital Partners Texas, LLC | 1,552 | -7.51 | 250 | -12.28 | ||||
| 2025-07-18 | 13F | Truist Financial Corp | 45,234 | 12.81 | 7,298 | 6.98 | ||||
| 2025-08-14 | 13F | Wells Fargo & Company/mn | 189,117 | -3.30 | 30,510 | -8.29 | ||||
| 2025-07-23 | 13F | Morey & Quinn Wealth Partners, LLC | 3,238 | -0.52 | 522 | -5.61 | ||||
| 2025-07-25 | 13F | Envestnet Portfolio Solutions, Inc. | 1,511 | -70.41 | 244 | -72.00 | ||||
| 2025-07-24 | 13F | Blair William & Co/il | 325 | 0.00 | 52 | -5.45 | ||||
| 2025-05-02 | 13F | Cullen/frost Bankers, Inc. | 0 | -100.00 | 0 | |||||
| 2025-08-12 | 13F | CIBC Private Wealth Group, LLC | 18 | -88.00 | 3 | -90.48 | ||||
| 2025-08-14 | 13F | Synovus Financial Corp | 2,134 | 57.37 | 344 | 49.57 | ||||
| 2025-08-05 | 13F | Dunhill Financial, LLC | 9 | 0.00 | 1 | 0.00 | ||||
| 2025-07-22 | 13F | Cedar Mountain Advisors, LLC | 244 | 0.00 | 39 | -4.88 | ||||
| 2025-08-11 | 13F | TD Waterhouse Canada Inc. | 34,622 | -5.71 | 5,611 | -7.04 | ||||
| 2025-08-14 | 13F | Guardian Wealth Advisors, Llc / Nc | 2 | 0.00 | 0 | |||||
| 2025-07-30 | 13F | Strategic Blueprint, LLC | 0 | -100.00 | 0 | |||||
| 2025-07-30 | 13F | D.a. Davidson & Co. | 38,830 | -2.53 | 6,264 | -7.56 | ||||
| 2025-08-07 | 13F | 1st Source Bank | 3,757 | -13.31 | 606 | -17.77 | ||||
| 2025-08-14 | 13F | Wiley Bros.-aintree Capital, Llc | 6,767 | 138.53 | 1,092 | 133.62 | ||||
| 2025-07-24 | 13F | IFP Advisors, Inc | 10,288 | -1.44 | 1,660 | -6.54 | ||||
| 2025-07-28 | 13F | Private Wealth Asset Management, LLC | 30 | 5 | ||||||
| 2025-08-12 | 13F | Ameritas Investment Partners, Inc. | 125 | 0.00 | 20 | -4.76 | ||||
| 2025-07-15 | 13F | North Star Investment Management Corp. | 75 | 0.00 | 12 | 0.00 | ||||
| 2025-07-16 | 13F | EdgeRock Capital LLC | 1,244 | -28.79 | 201 | -32.66 | ||||
| 2025-08-13 | 13F | Summit Wealth Group Llc / Co | 2,165 | 349 | ||||||
| 2025-07-08 | 13F | Davis Investment Partners, LLC | 4,700 | 0.00 | 762 | 3.96 | ||||
| 2025-08-06 | 13F | Moors & Cabot, Inc. | 1,517 | -73.91 | 245 | -75.33 | ||||
| 2025-08-12 | 13F | J.w. Cole Advisors, Inc. | 0 | -100.00 | 0 | |||||
| 2025-08-06 | 13F | Eukles Asset Management | 212 | 0.00 | 34 | -5.56 | ||||
| 2025-08-13 | 13F | Jones Financial Companies Lllp | 8,275 | 5.44 | 1,335 | 3.17 | ||||
| 2025-08-14 | 13F | Moneta Group Investment Advisors Llc | 0 | -100.00 | 0 | |||||
| 2025-07-29 | 13F | Harbor Asset Planning, Inc. | 77 | 12 | ||||||
| 2025-08-13 | 13F | Capital Analysts, Inc. | 118 | -71.77 | 0 | |||||
| 2025-07-25 | 13F | Atria Wealth Solutions, Inc. | 2,802 | -55.66 | 452 | -57.91 | ||||
| 2025-08-12 | 13F | Archer Investment Corp | 10 | 0.00 | 2 | 0.00 | ||||
| 2025-08-08 | 13F | Avantax Advisory Services, Inc. | 6,762 | 12.55 | 1,091 | 6.65 | ||||
| 2025-08-14 | 13F | MGB Wealth Management, LLC | 1,479 | 0.00 | 239 | -5.18 | ||||
| 2025-07-10 | 13F | HF Advisory Group, LLC | 1,276 | 0.39 | 206 | -5.09 | ||||
| 2025-08-13 | 13F | Flow Traders U.s. Llc | 2,907 | 0 | ||||||
| 2025-08-05 | 13F | Bank of New York Mellon Corp | 7,300 | 9.22 | 1,178 | 3.61 | ||||
| 2025-08-19 | 13F | National Asset Management, Inc. | 9,526 | 1,537 | ||||||
| 2025-05-16 | 13F/A | Kestra Investment Management, LLC | 0 | -100.00 | 0 | |||||
| 2025-07-29 | 13F | Private Trust Co Na | 49 | -41.67 | 8 | -50.00 | ||||
| 2025-08-14 | 13F | Modern Wealth Management, LLC | 42,030 | 39.53 | 6,781 | 32.32 | ||||
| 2025-08-12 | 13F | PKS Advisory Services, LLC | 1,666 | 0.00 | 269 | -5.30 | ||||
| 2025-07-15 | 13F | Yarbrough Capital, LLC | 31,160 | 0.00 | 5,027 | -5.15 | ||||
| 2025-08-14 | 13F | Benjamin Edwards Inc | 28,808 | 40.50 | 4,648 | 33.23 | ||||
| 2025-08-04 | 13F | IFG Advisory, LLC | 2,663 | 14.78 | 430 | 8.88 | ||||
| 2025-08-11 | 13F | NewEdge Wealth, LLC | 8,571 | -6.44 | 1,405 | -9.88 | ||||
| 2025-08-04 | 13F | Spire Wealth Management | 31 | -61.73 | 5 | -61.54 | ||||
| 2025-08-15 | 13F | First Heartland Consultants, Inc. | 3,075 | -9.13 | 496 | -13.74 | ||||
| 2025-08-14 | 13F | Glen Eagle Advisors, LLC | 30 | 0.00 | 5 | -20.00 | ||||
| 2025-08-04 | 13F | Atria Investments Llc | 5,578 | 11.32 | 900 | 5.52 | ||||
| 2025-08-14 | 13F | CoreCap Advisors, LLC | 228 | 0.00 | 37 | -5.26 | ||||
| 2025-05-15 | 13F | Nova Wealth Management, Inc. | 0 | 0 | ||||||
| 2025-07-14 | 13F | Financial Enhancement Group LLC | 5,658 | 1.89 | 943 | 9.03 | ||||
| 2025-08-08 | 13F | Glassman Wealth Services | 0 | -100.00 | 0 | |||||
| 2025-08-11 | 13F | Brass Tax Wealth Management, Inc | 1,712 | 0.00 | 276 | -5.15 | ||||
| 2025-08-14 | 13F | Susquehanna International Group, Llp | Call | 14,900 | 28.45 | 2,404 | 21.79 | |||
| 2025-08-11 | 13F | Aptus Capital Advisors, LLC | 2 | 0.00 | 0 | |||||
| 2025-08-14 | 13F | Susquehanna International Group, Llp | 48,655 | 1,551.00 | 7,850 | 1,466.67 | ||||
| 2025-08-08 | 13F | Gts Securities Llc | 0 | -100.00 | 0 | |||||
| 2025-08-14 | 13F | Integrated Wealth Concepts LLC | 30,012 | -4.09 | 4,842 | -9.06 | ||||
| 2025-07-08 | 13F/A | Salem Investment Counselors Inc | 100 | 0.00 | 16 | -5.88 | ||||
| 2025-07-23 | 13F | Gentry Private Wealth, Llc | 4,663 | 0.00 | 752 | -5.17 | ||||
| 2025-07-11 | 13F | Quad-Cities Investment Group, LLC | 9,007 | -7.94 | 1,453 | -12.68 | ||||
| 2025-07-18 | 13F | McGuire Investment Group, LLC | 0 | -100.00 | 0 | |||||
| 2025-07-23 | 13F | RMG Wealth Management LLC | 486 | 80 | ||||||
| 2025-08-13 | 13F | Russell Investments Group, Ltd. | 2 | 0.00 | 0 | |||||
| 2025-08-14 | 13F | Two Sigma Investments, Lp | 11,700 | -75.52 | 1,888 | -76.79 | ||||
| 2025-07-16 | 13F/A | CX Institutional | 151 | 0.00 | 0 | |||||
| 2025-07-15 | 13F | FLP Wealth Management, LLC | 0 | -100.00 | 0 | |||||
| 2025-04-17 | 13F | Copia Wealth Management | 0 | -100.00 | 0 | |||||
| 2025-08-06 | 13F | North Capital, Inc. | 200 | 0.00 | 32 | -5.88 | ||||
| 2025-08-14 | 13F | Ameriprise Financial Inc | 42,218 | -0.96 | 6,811 | -6.09 | ||||
| 2025-07-24 | 13F | Us Bancorp \de\ | 70 | 250.00 | 11 | 266.67 | ||||
| 2025-08-13 | 13F | Shepherd Financial Partners LLC | 1,567 | 0.00 | 253 | -5.26 | ||||
| 2025-08-12 | 13F | Proequities, Inc. | 0 | 0 | ||||||
| 2025-08-14 | 13F | Two Sigma Securities, Llc | 2,001 | 56.45 | 323 | 48.39 | ||||
| 2025-08-04 | 13F | Assetmark, Inc | 38,091 | 29.47 | 6,145 | 22.80 | ||||
| 2025-05-12 | 13F | Sandy Spring Bank | 100 | -32.89 | 17 | -29.17 | ||||
| 2025-07-29 | 13F | Stratos Wealth Advisors, LLC | 0 | -100.00 | 0 | |||||
| 2025-08-01 | 13F | Bessemer Group Inc | 600 | -14.29 | 0 | |||||
| 2025-08-12 | 13F/A | Cozad Asset Management Inc | 1,340 | 0.00 | 216 | -4.85 | ||||
| 2025-08-05 | 13F | Holistic Financial Partners | 17,922 | 209.48 | 2,891 | 193.50 | ||||
| 2025-07-10 | 13F | Wealth Enhancement Advisory Services, Llc | 10,773 | 2.01 | 1,769 | -1.50 | ||||
| 2025-07-21 | 13F | DHJJ Financial Advisors, Ltd. | 289 | 0.00 | 47 | -6.12 | ||||
| 2025-08-11 | 13F | Bedell Frazier Investment Counseling, LLC | 3,143 | -45.82 | 507 | -48.58 | ||||
| 2025-08-06 | 13F | Csenge Advisory Group | 0 | -100.00 | 0 | |||||
| 2025-08-04 | 13F | Pinnacle Associates Ltd | 5,260 | -4.42 | 849 | -9.40 | ||||
| 2025-08-13 | 13F | Icapital Wealth Llc | 0 | -100.00 | 0 | |||||
| 2025-08-13 | 13F | Gateway Wealth Partners, LLC | 6,127 | 1.85 | 988 | -3.42 | ||||
| 2025-07-17 | 13F | Walker Asset Management, LLC | 0 | -100.00 | 0 | |||||
| 2025-08-13 | 13F | Baird Financial Group, Inc. | 8,039 | 12.86 | 1,297 | 7.02 | ||||
| 2025-07-16 | 13F | American National Bank | 14 | 0.00 | 2 | 0.00 | ||||
| 2025-08-13 | 13F | Maia Wealth LLC | 3,869 | -5.26 | 624 | -1.89 | ||||
| 2025-08-13 | 13F | Virtue Capital Management, LLC | 0 | -100.00 | 0 | |||||
| 2025-08-14 | 13F | Pinnacle Family Advisors, LLC | 3,831 | 1.73 | 618 | -3.44 | ||||
| 2025-07-29 | 13F | Stephens Inc /ar/ | 1,508 | -29.57 | 243 | -33.24 | ||||
| 2025-08-06 | 13F | Prospera Financial Services Inc | 8,677 | -13.73 | 1,401 | -18.27 | ||||
| 2025-07-07 | 13F | RDA Financial Network | 1,476 | -18.77 | 238 | -22.98 | ||||
| 2025-07-11 | 13F | Farther Finance Advisors, LLC | 5,956 | 0.81 | 961 | -1.13 | ||||
| 2025-08-15 | 13F | Equitable Holdings, Inc. | 2,168 | -1.94 | 350 | -7.18 | ||||
| 2025-08-13 | 13F | Level Four Advisory Services, Llc | 3,061 | -2.79 | 494 | -7.85 | ||||
| 2025-08-11 | 13F | Principal Securities, Inc. | 839 | 14.93 | 135 | 11.57 | ||||
| 2025-08-14 | 13F | Citadel Advisors Llc | 5,679 | -79.36 | 916 | -80.43 | ||||
| 2025-08-14 | 13F | Smartleaf Asset Management LLC | 80 | 0.00 | 13 | -7.69 | ||||
| 2025-08-20 | 13F/A | Coppell Advisory Solutions LLC | 3,042 | -37.14 | 491 | -36.86 | ||||
| 2025-05-12 | 13F | Empirical Asset Management, LLC | 0 | -100.00 | 0 | |||||
| 2025-08-14 | 13F | Jane Street Group, Llc | 15,721 | -15.59 | 2,536 | -19.95 | ||||
| 2025-08-07 | 13F | Resources Investment Advisors, LLC. | 0 | -100.00 | 0 | |||||
| 2025-08-14 | 13F | Citadel Advisors Llc | Call | 2,600 | 8.33 | 419 | 2.70 | |||
| 2025-07-15 | 13F | Wealth Effects Llc | 2,285 | -16.76 | 369 | -21.03 | ||||
| 2025-08-18 | 13F | Geneos Wealth Management Inc. | 546 | 67.48 | 88 | 60.00 | ||||
| 2025-07-08 | 13F | Parallel Advisors, LLC | 13 | 0.00 | 2 | 0.00 | ||||
| 2025-08-11 | 13F | Tidemark, LLC | 85 | -19.05 | 14 | -23.53 | ||||
| 2025-08-01 | 13F | GoalVest Advisory LLC | 4,663 | 0.00 | 752 | -5.17 | ||||
| 2025-05-02 | 13F | Capital A Wealth Management, LLC | 0 | -100.00 | 0 | |||||
| 2025-08-13 | 13F | Congress Wealth Management LLC / DE / | 43,402 | -0.22 | 7,002 | -5.38 | ||||
| 2025-08-11 | 13F | Oder Investment Management, LLC | 3,209 | -0.03 | 518 | -5.14 | ||||
| 2025-08-04 | 13F | Barnes Dennig Private Wealth Management LLC | 50 | 0.00 | 8 | 0.00 | ||||
| 2025-08-14 | 13F | Bank Of America Corp /de/ | 192,556 | -0.23 | 31,065 | -5.38 | ||||
| 2025-05-09 | 13F | GeoWealth Management, LLC | 0 | -100.00 | 0 | |||||
| 2025-07-14 | 13F | Park Avenue Securities Llc | 4,071 | -0.73 | 1 | |||||
| 2025-07-17 | 13F | Sound Income Strategies, LLC | 1 | 0.00 | 0 | |||||
| 2025-08-06 | 13F | Atlantic Union Bankshares Corp | 100 | 16 | ||||||
| 2025-07-29 | 13F | Dale Q Rice Investment Management Ltd | 3,940 | -51.96 | 651 | -53.41 | ||||
| 2025-08-11 | 13F | Lake Street Financial Llc | 3,556 | -11.89 | 574 | -16.47 | ||||
| 2025-07-25 | 13F | Concurrent Investment Advisors, LLC | 1,746 | 5.12 | 282 | -0.35 | ||||
| 2025-08-05 | 13F | Bank Of Montreal /can/ | 1,366 | 0.29 | 220 | -4.76 | ||||
| 2025-08-11 | 13F | HighTower Advisors, LLC | 18,275 | 24.91 | 2,948 | 18.49 | ||||
| 2025-08-13 | 13F | Continuum Advisory, LLC | 0 | -100.00 | 0 | |||||
| 2025-07-21 | 13F | Ameriflex Group, Inc. | 164 | -40.15 | 27 | -43.48 | ||||
| 2025-08-07 | 13F | Addison Advisors LLC | 41 | 0.00 | 7 | 0.00 | ||||
| 2025-08-14 | 13F | Qube Research & Technologies Ltd | 707 | -76.50 | 114 | -77.69 | ||||
| 2025-07-16 | 13F | Signaturefd, Llc | 180 | 0.00 | 29 | -3.33 | ||||
| 2025-08-08 | 13F | Emerald Investment Partners, Llc | 4,781 | 2.20 | 771 | -3.02 | ||||
| 2025-08-12 | 13F | MAI Capital Management | 8,051 | 8.04 | 1,299 | 2.45 | ||||
| 2025-08-27 | 13F/A | Brinker Capital Investments, LLC | 5,382 | -70.88 | 868 | -47.58 | ||||
| 2025-08-13 | 13F | First Trust Advisors Lp | 8,393 | 0.79 | 1,355 | -4.45 | ||||
| 2025-08-13 | 13F/A | StoneX Group Inc. | 2,509 | -46.91 | 387 | -38.04 | ||||
| 2025-08-11 | 13F | Private Advisor Group, LLC | 6,889 | -11.98 | 1,111 | -16.53 | ||||
| 2025-08-14 | 13F | Mml Investors Services, Llc | 2,596 | -23.58 | 0 |
Other Listings
| MX:FBT |